McDonald's Financial Analysis (2015-2021): An MS Excel Case Study
VerifiedAdded on 2023/06/12
|9
|1730
|499
Practical Assignment
AI Summary
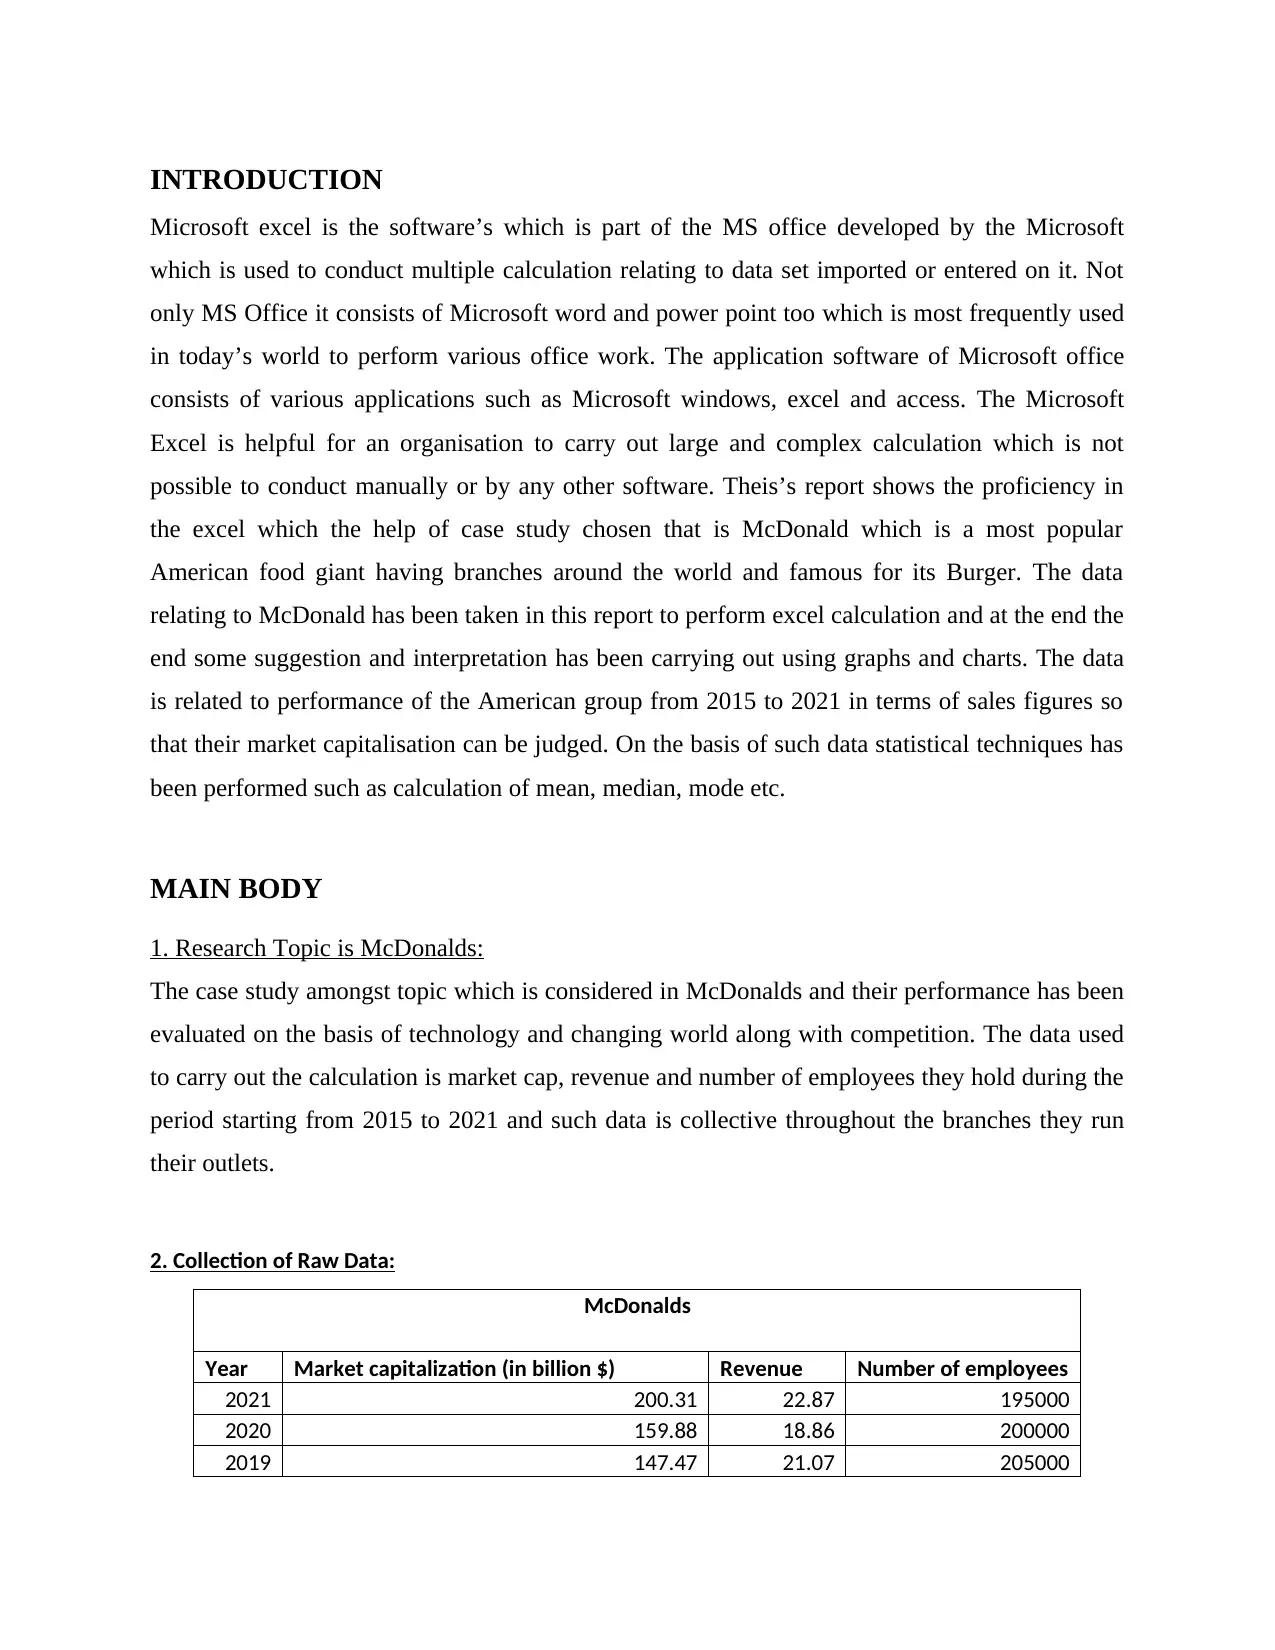
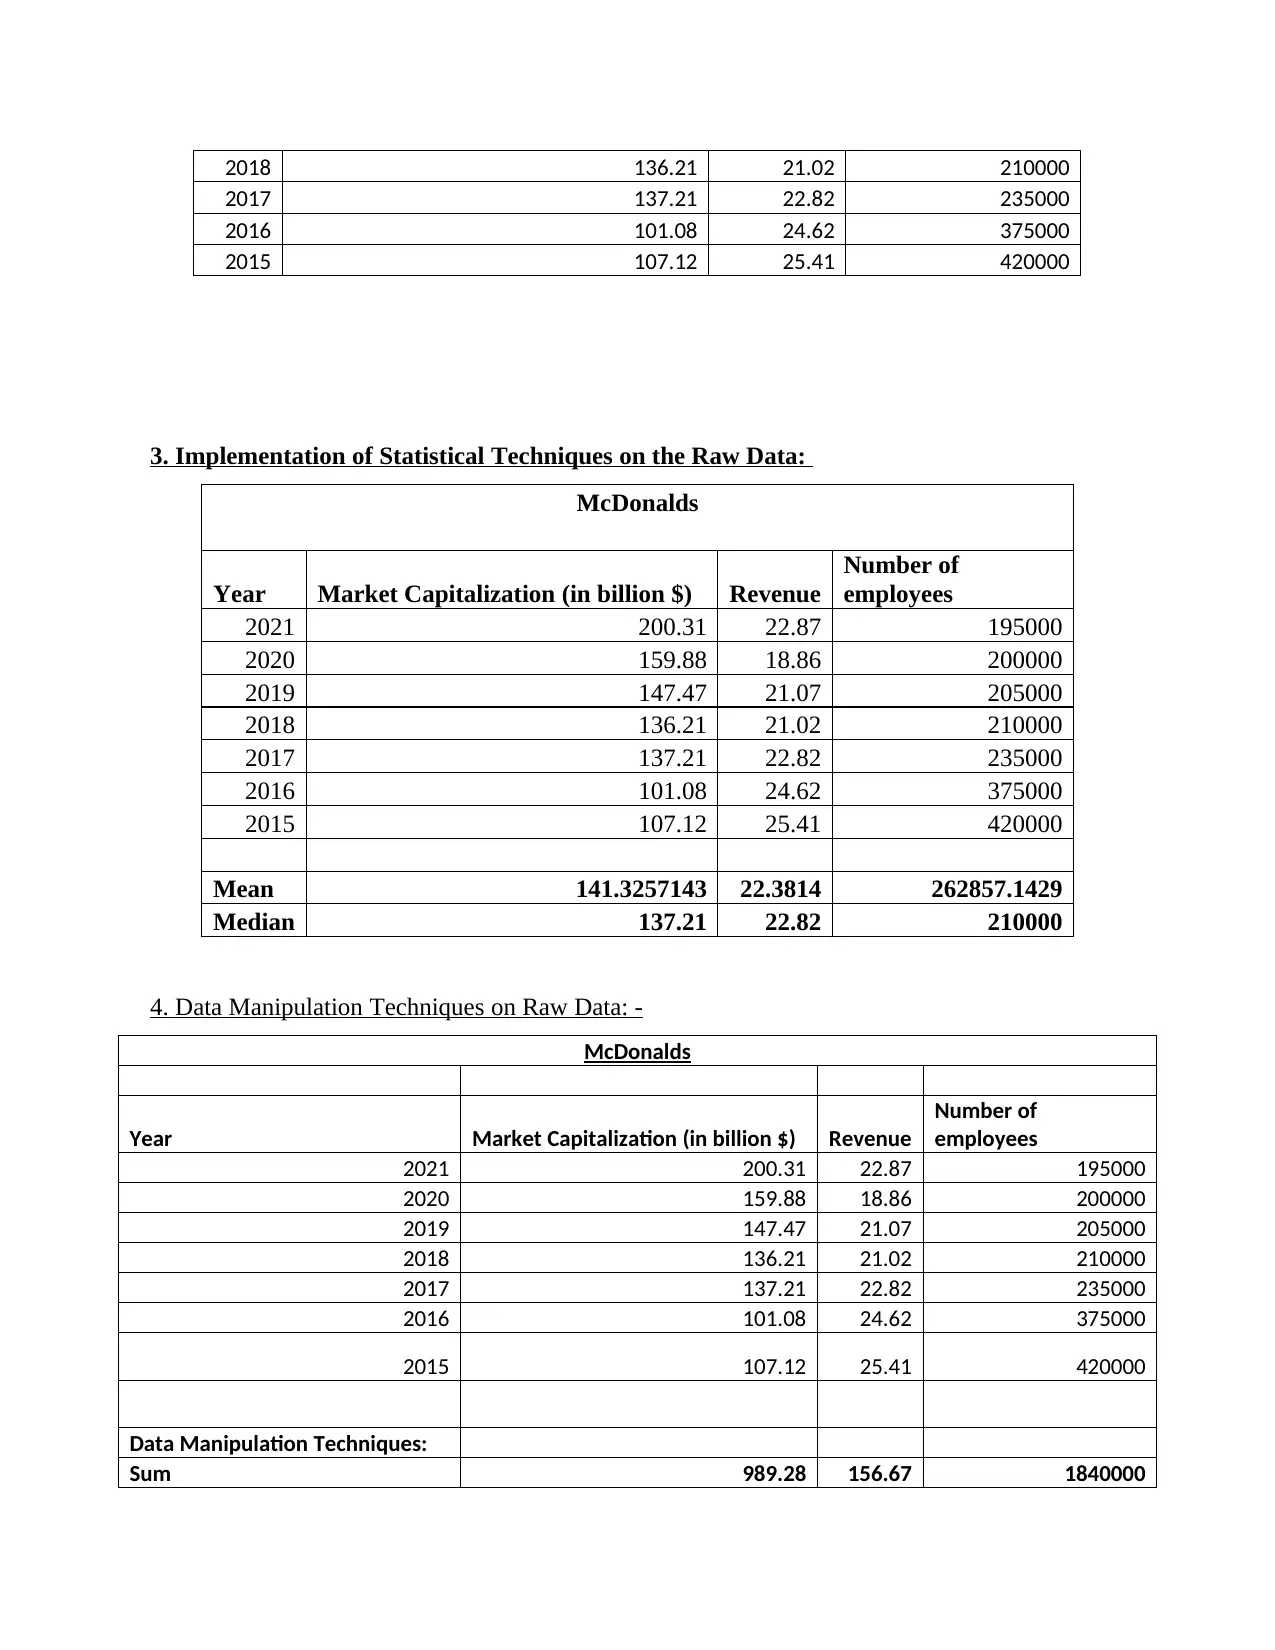
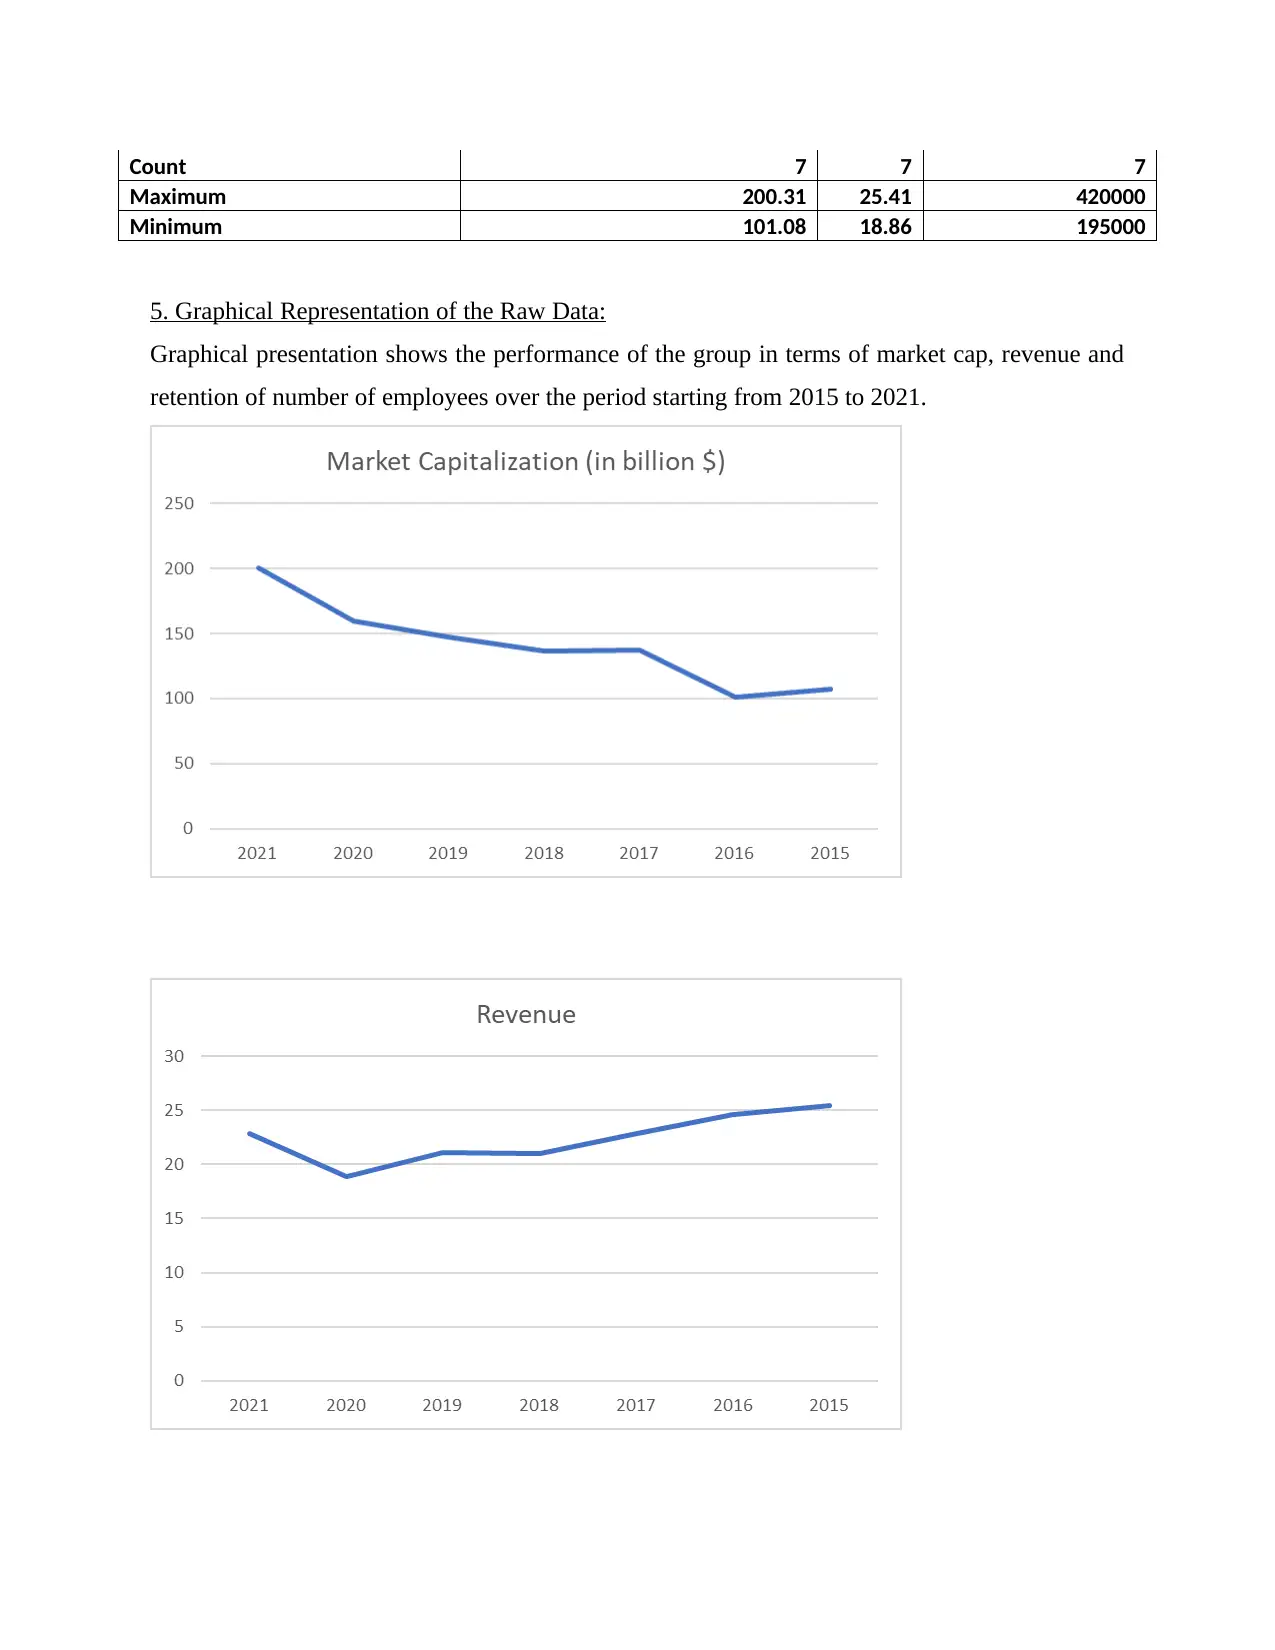
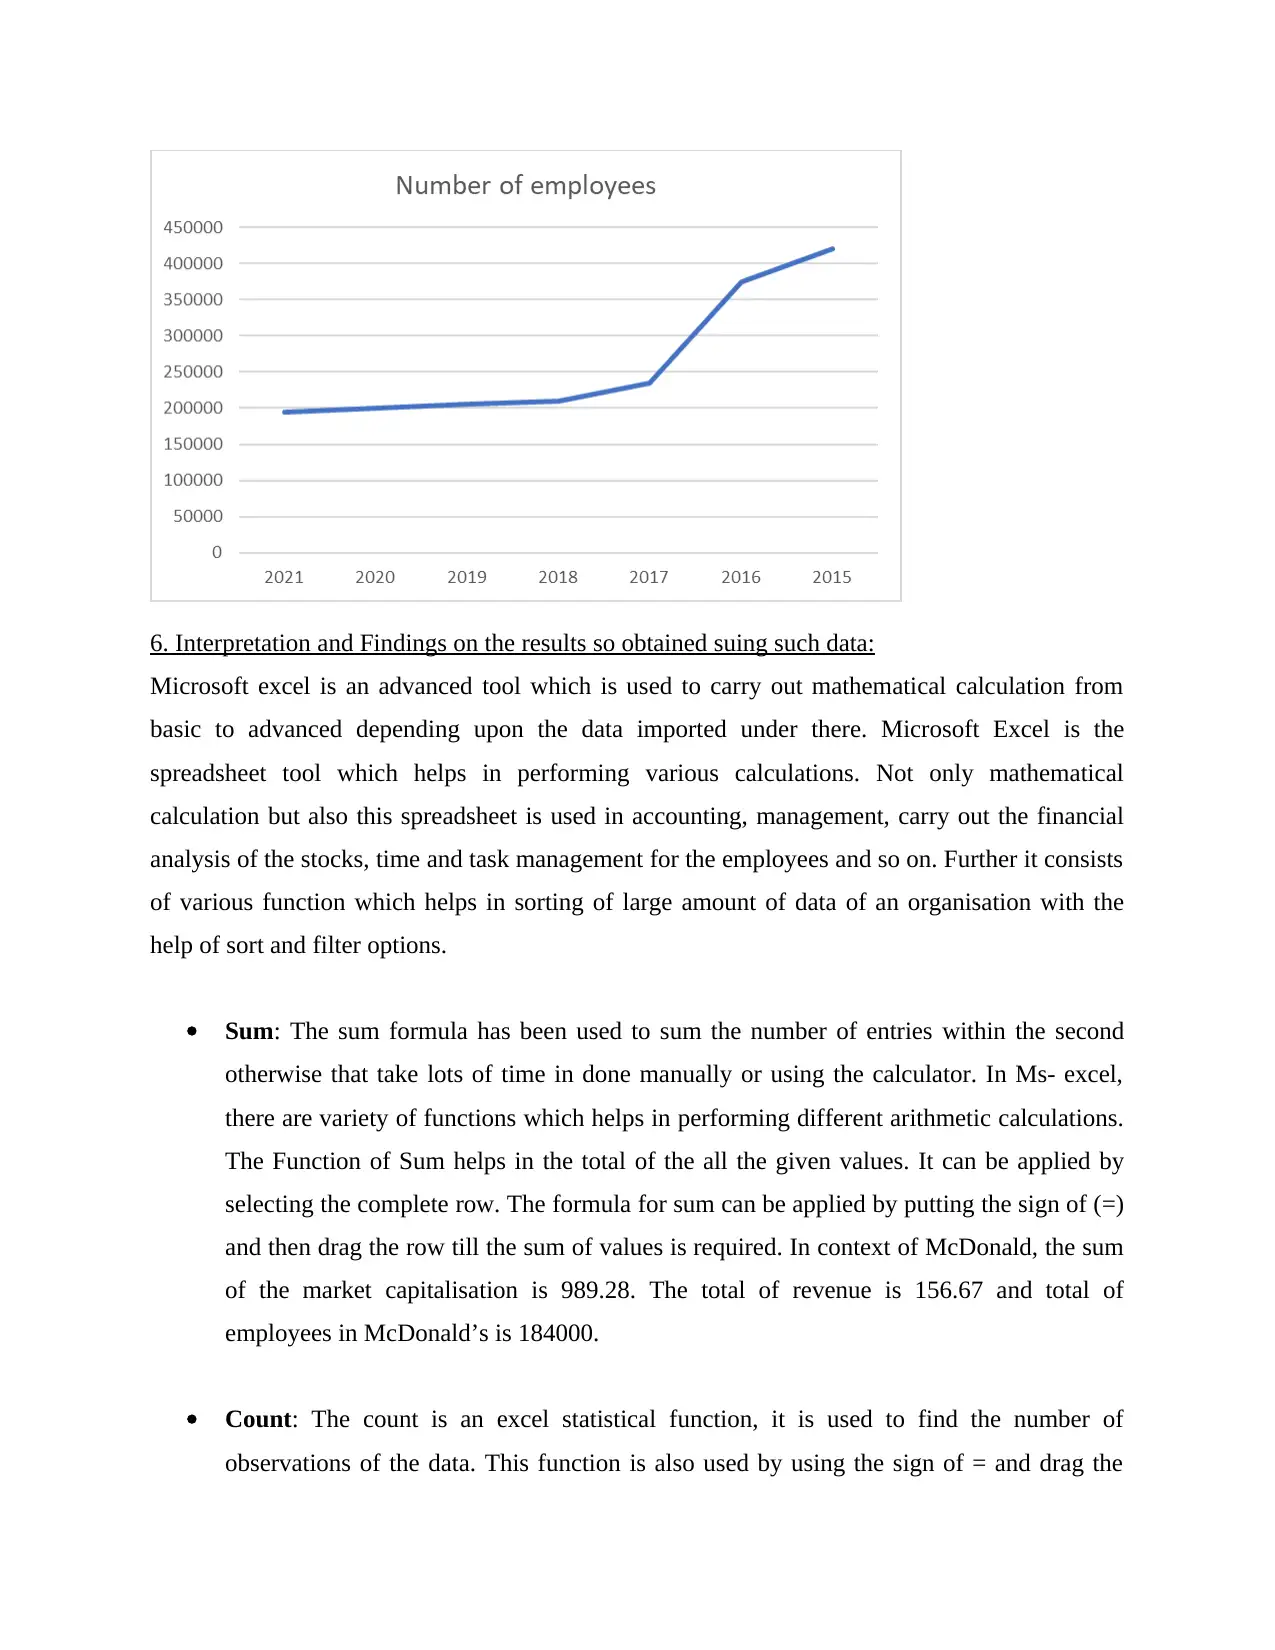
This assignment showcases MS Excel proficiency through a case study analyzing McDonald's financial data from 2015 to 2021. The analysis includes data manipulation, graphical representation, and statistical techniques such as calculating mean, median, mode, sum, count, minimum, and maximum values for key metrics like market capitalization, revenue, and number of employees. The report interprets the results, providing insights into McDonald's performance over the specified period and demonstrates how Excel can be used for complex calculations, financial analysis, and decision-making. The assignment concludes that MS Excel is a valuable tool for data analysis, enabling efficient calculations and informed decision-making through its various functions and capabilities.
Contribute Materials
Your contribution can guide someone’s learning journey. Share your
documents today.

MS EXCEL TASK
Secure Best Marks with AI Grader
Need help grading? Try our AI Grader for instant feedback on your assignments.

Contents
INTRODUCTION...........................................................................................................................3
MAIN BODY..................................................................................................................................3
1. Research Topic is McDonalds:................................................................................................3
2. Collection of Raw Data:..........................................................................................................3
3. Implementation of Statistical Techniques on the Raw Data:...................................................4
4. Data Manipulation Techniques on Raw Data: -......................................................................4
5. Graphical Representation of the Raw Data:............................................................................5
6. Interpretation and Findings on the results so obtained suing such data:.................................6
CONCLUSION................................................................................................................................8
REFERENCES................................................................................................................................9

INTRODUCTION
Microsoft excel is the software’s which is part of the MS office developed by the Microsoft
which is used to conduct multiple calculation relating to data set imported or entered on it. Not
only MS Office it consists of Microsoft word and power point too which is most frequently used
in today’s world to perform various office work. The application software of Microsoft office
consists of various applications such as Microsoft windows, excel and access. The Microsoft
Excel is helpful for an organisation to carry out large and complex calculation which is not
possible to conduct manually or by any other software. Theis’s report shows the proficiency in
the excel which the help of case study chosen that is McDonald which is a most popular
American food giant having branches around the world and famous for its Burger. The data
relating to McDonald has been taken in this report to perform excel calculation and at the end the
end some suggestion and interpretation has been carrying out using graphs and charts. The data
is related to performance of the American group from 2015 to 2021 in terms of sales figures so
that their market capitalisation can be judged. On the basis of such data statistical techniques has
been performed such as calculation of mean, median, mode etc.
MAIN BODY
1. Research Topic is McDonalds:
The case study amongst topic which is considered in McDonalds and their performance has been
evaluated on the basis of technology and changing world along with competition. The data used
to carry out the calculation is market cap, revenue and number of employees they hold during the
period starting from 2015 to 2021 and such data is collective throughout the branches they run
their outlets.
2. Collection of Raw Data:
McDonalds
Year Market capitalization (in billion $) Revenue Number of employees
2021 200.31 22.87 195000
2020 159.88 18.86 200000
2019 147.47 21.07 205000

2018 136.21 21.02 210000
2017 137.21 22.82 235000
2016 101.08 24.62 375000
2015 107.12 25.41 420000
3. Implementation of Statistical Techniques on the Raw Data:
McDonalds
Year Market Capitalization (in billion $) Revenue
Number of
employees
2021 200.31 22.87 195000
2020 159.88 18.86 200000
2019 147.47 21.07 205000
2018 136.21 21.02 210000
2017 137.21 22.82 235000
2016 101.08 24.62 375000
2015 107.12 25.41 420000
Mean 141.3257143 22.3814 262857.1429
Median 137.21 22.82 210000
4. Data Manipulation Techniques on Raw Data: -
McDonalds
Year Market Capitalization (in billion $) Revenue
Number of
employees
2021 200.31 22.87 195000
2020 159.88 18.86 200000
2019 147.47 21.07 205000
2018 136.21 21.02 210000
2017 137.21 22.82 235000
2016 101.08 24.62 375000
2015 107.12 25.41 420000
Data Manipulation Techniques:
Sum 989.28 156.67 1840000
2017 137.21 22.82 235000
2016 101.08 24.62 375000
2015 107.12 25.41 420000
3. Implementation of Statistical Techniques on the Raw Data:
McDonalds
Year Market Capitalization (in billion $) Revenue
Number of
employees
2021 200.31 22.87 195000
2020 159.88 18.86 200000
2019 147.47 21.07 205000
2018 136.21 21.02 210000
2017 137.21 22.82 235000
2016 101.08 24.62 375000
2015 107.12 25.41 420000
Mean 141.3257143 22.3814 262857.1429
Median 137.21 22.82 210000
4. Data Manipulation Techniques on Raw Data: -
McDonalds
Year Market Capitalization (in billion $) Revenue
Number of
employees
2021 200.31 22.87 195000
2020 159.88 18.86 200000
2019 147.47 21.07 205000
2018 136.21 21.02 210000
2017 137.21 22.82 235000
2016 101.08 24.62 375000
2015 107.12 25.41 420000
Data Manipulation Techniques:
Sum 989.28 156.67 1840000
Secure Best Marks with AI Grader
Need help grading? Try our AI Grader for instant feedback on your assignments.

Count 7 7 7
Maximum 200.31 25.41 420000
Minimum 101.08 18.86 195000
5. Graphical Representation of the Raw Data:
Graphical presentation shows the performance of the group in terms of market cap, revenue and
retention of number of employees over the period starting from 2015 to 2021.
Maximum 200.31 25.41 420000
Minimum 101.08 18.86 195000
5. Graphical Representation of the Raw Data:
Graphical presentation shows the performance of the group in terms of market cap, revenue and
retention of number of employees over the period starting from 2015 to 2021.

6. Interpretation and Findings on the results so obtained suing such data:
Microsoft excel is an advanced tool which is used to carry out mathematical calculation from
basic to advanced depending upon the data imported under there. Microsoft Excel is the
spreadsheet tool which helps in performing various calculations. Not only mathematical
calculation but also this spreadsheet is used in accounting, management, carry out the financial
analysis of the stocks, time and task management for the employees and so on. Further it consists
of various function which helps in sorting of large amount of data of an organisation with the
help of sort and filter options.
Sum: The sum formula has been used to sum the number of entries within the second
otherwise that take lots of time in done manually or using the calculator. In Ms- excel,
there are variety of functions which helps in performing different arithmetic calculations.
The Function of Sum helps in the total of the all the given values. It can be applied by
selecting the complete row. The formula for sum can be applied by putting the sign of (=)
and then drag the row till the sum of values is required. In context of McDonald, the sum
of the market capitalisation is 989.28. The total of revenue is 156.67 and total of
employees in McDonald’s is 184000.
Count: The count is an excel statistical function, it is used to find the number of
observations of the data. This function is also used by using the sign of = and drag the

rows till the count of observations is required. According to the data of McDonald, the
count of market capitalisation, revenue and number of employees are 7. It is same in all
the three different variables.
Maximum: This function of Ms-excel is used to produce the highest value from the total
given events in the series. It can be used by putting the sign (=) and writing the name of
the function. The maximum value in case of market capitalisation rate is 200.31 and
maximum revenue is 25.41. The maximum number of employees is 420000. The graphs
can also be created which shows the graphical representation of the given data.
Minimum: The minimum function will return the lowest value. The minimum value of
market capitalisation of McDonald's is 101.08. The lowest value of revenue and number
of employees are 18.86 and 195000. This function can be applied by = min () and in the
brackets, the range of cells is specified.
Mean: The mean is the average value of the given data set. The mean is the measure of
central tendency which can be computed by adding all the given values and divided by
the number of observations. The mean for the market capitalisation rate is 141.3257143
and average value for the revenue is 22.3814 and mean for number of employees is
262857.1429. It is impacted by the extreme values and helpful in further algebraic
treatment.
Median: The median is defined as the mid value of the data set. It can be computed
differently in case of odd and even observations. When observations are even, n+1/2 is
applied and when observations are odd, n/2 formula will be applied. The median for the
market capitalisation rate is 137.21 and mid value for revenue of McDonald is 22.82. the
mid value for number of employees is 21000.
Paraphrase This Document
Need a fresh take? Get an instant paraphrase of this document with our AI Paraphraser

CONCLUSION
The above report consists of performing the excel proficiency test on the raw data which has
been collected from the McDonald case study. The data so collected put it into the excel format
so that data manipulation, graphical representation and statistical tools along with graphs can be
applied on such data accordingly. From the above report, it can be concluded that Ms- Excel is
an application software which eases the work by performing complex calculation in very less
time. The function of spreadsheet such as sum, count, minimum and maximum helps to find the
total and maximum values from the revenue of McDonald. The measures of central tendency
such as mean, mode and median of the revenue and market capitalisation rate can also be
analysed which helps in taking the various decisions. At the end of this report graphs has been
prepared so that performance can be analysed of the McDonald in the period which is considered
in the given data set.

REFERENCES
Books and Journals
Chertchom, P., 2018, May. A comparison study between data mining tools over regression
methods: Recommendation for SMEs. In 2018 5th International Conference on
Business and Industrial Research (ICBIR) (pp. 46-50). IEEE.
Gembarski, P.C., 2020. On the conception of a multi-agent analysis and optimization tool for
mechanical engineering parts. In Agents and Multi-Agent Systems: Technologies and
Applications 2020 (pp. 93-102). Springer, Singapore.
Loong, E.Y.K. and Herbert, S., 2018. Primary school teachers’ use of digital technology in
mathematics: The complexities. Mathematics Education Research Journal, 30(4),
pp.475-498.
Lwakatare, L.E., Raj, A., and Olsson, H.H., 2020. Large-scale machine learning systems in real-
world industrial settings: A review of challenges and solutions. Information and
software technology, 127, p.106368.
Masters, K., 2020. Ethics in medical education digital scholarship: AMEE Guide No.
134. Medical Teacher, 42(3), pp.252-265.
Rotondo, A., Mannina, L. and Salvo, A., 2019. Multiple assignment recovered analysis (MARA)
NMR for a direct food labeling: The case study of olive oils. Food Analytical
Methods, 12(5), pp.1238-1245.
Villiere, A., Mason, B., and Turner, A., 2021. The physical characteristics underpinning
performance of wheelchair fencing athletes: A Delphi study of Paralympic
coaches. Journal of Sports Sciences, 39(17), pp.2006-2014.
Yigit, S. and Ozorhon, B., 2018. A simulation-based optimization method for designing energy
efficient buildings. Energy and Buildings, 178, pp.216-227.
1 out of 9
Related Documents

Your All-in-One AI-Powered Toolkit for Academic Success.
+13062052269
info@desklib.com
Available 24*7 on WhatsApp / Email
Unlock your academic potential
© 2024 | Zucol Services PVT LTD | All rights reserved.