Financial Performance Analysis of McDonald's Using MS Excel

Verified

Added on  2023/06/11

|8
|1315
|395
Practical Assignment
AI Summary
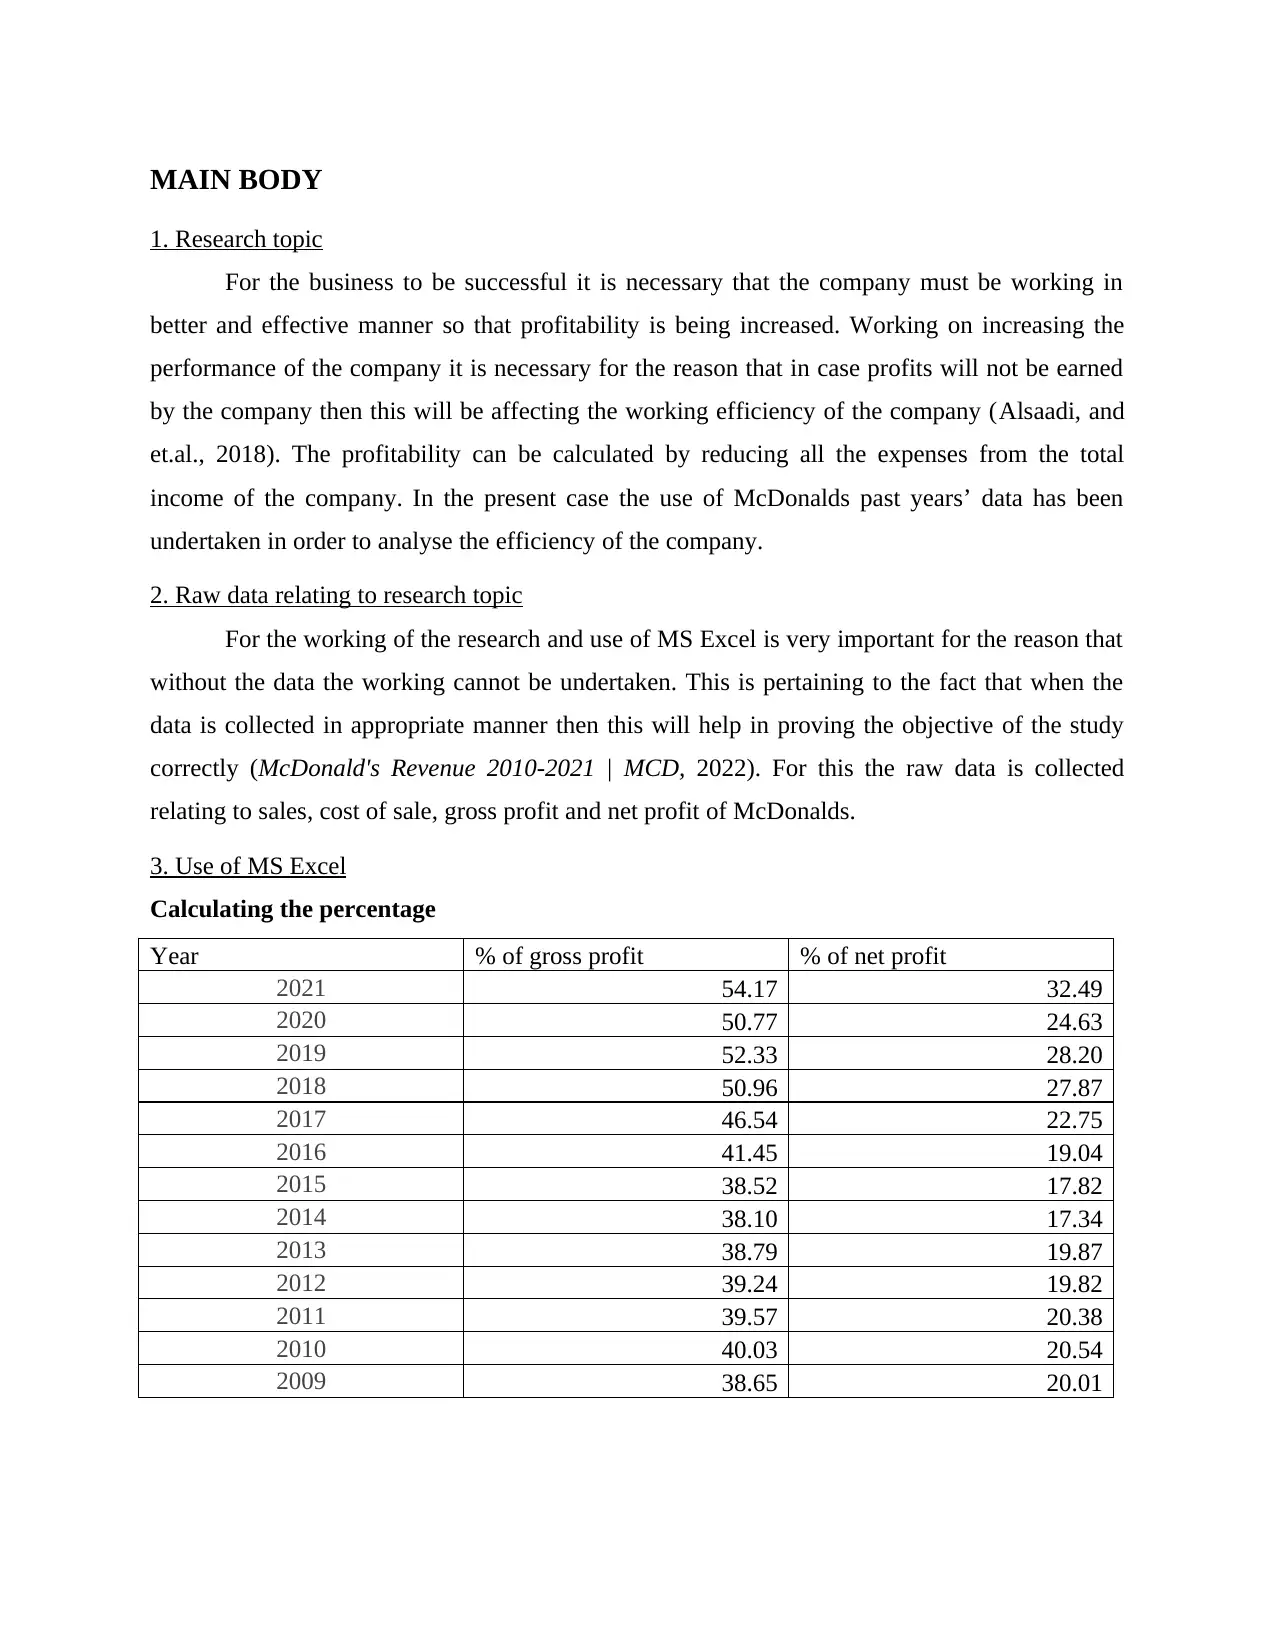
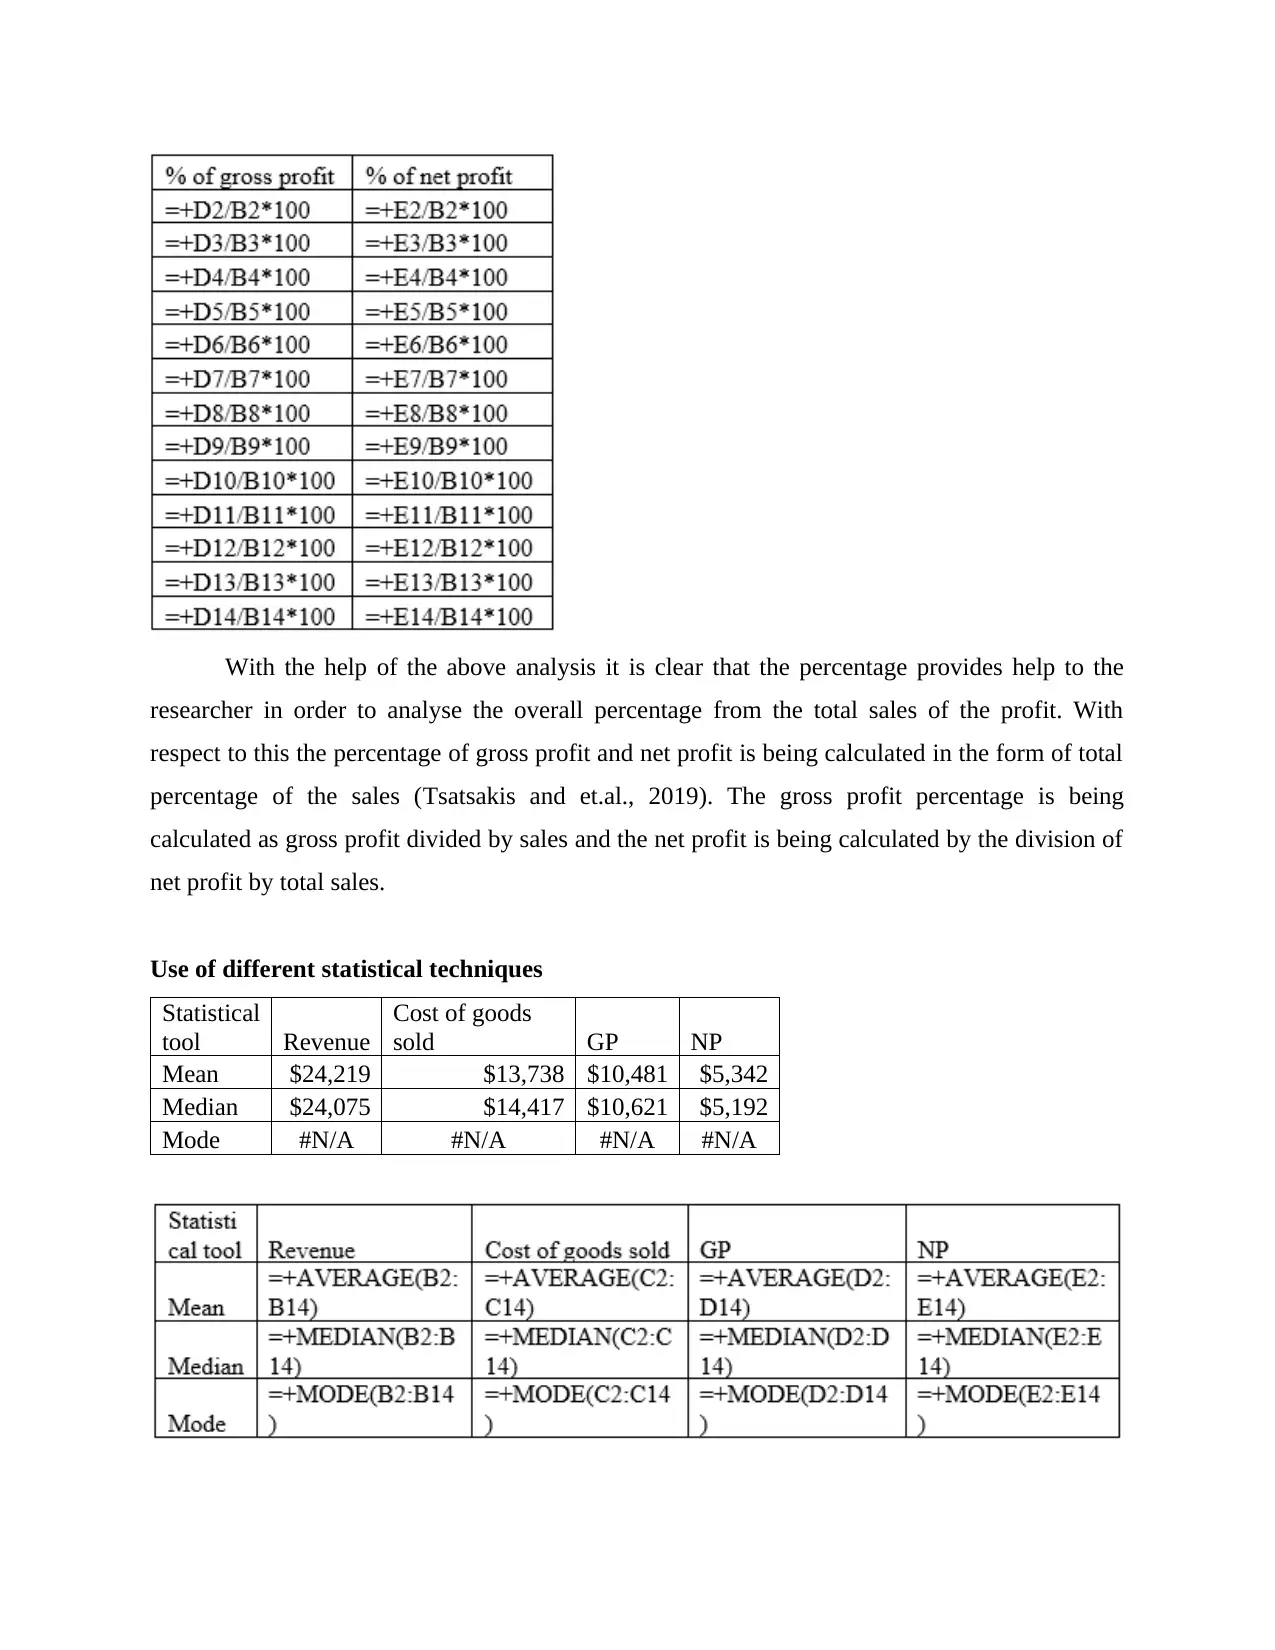
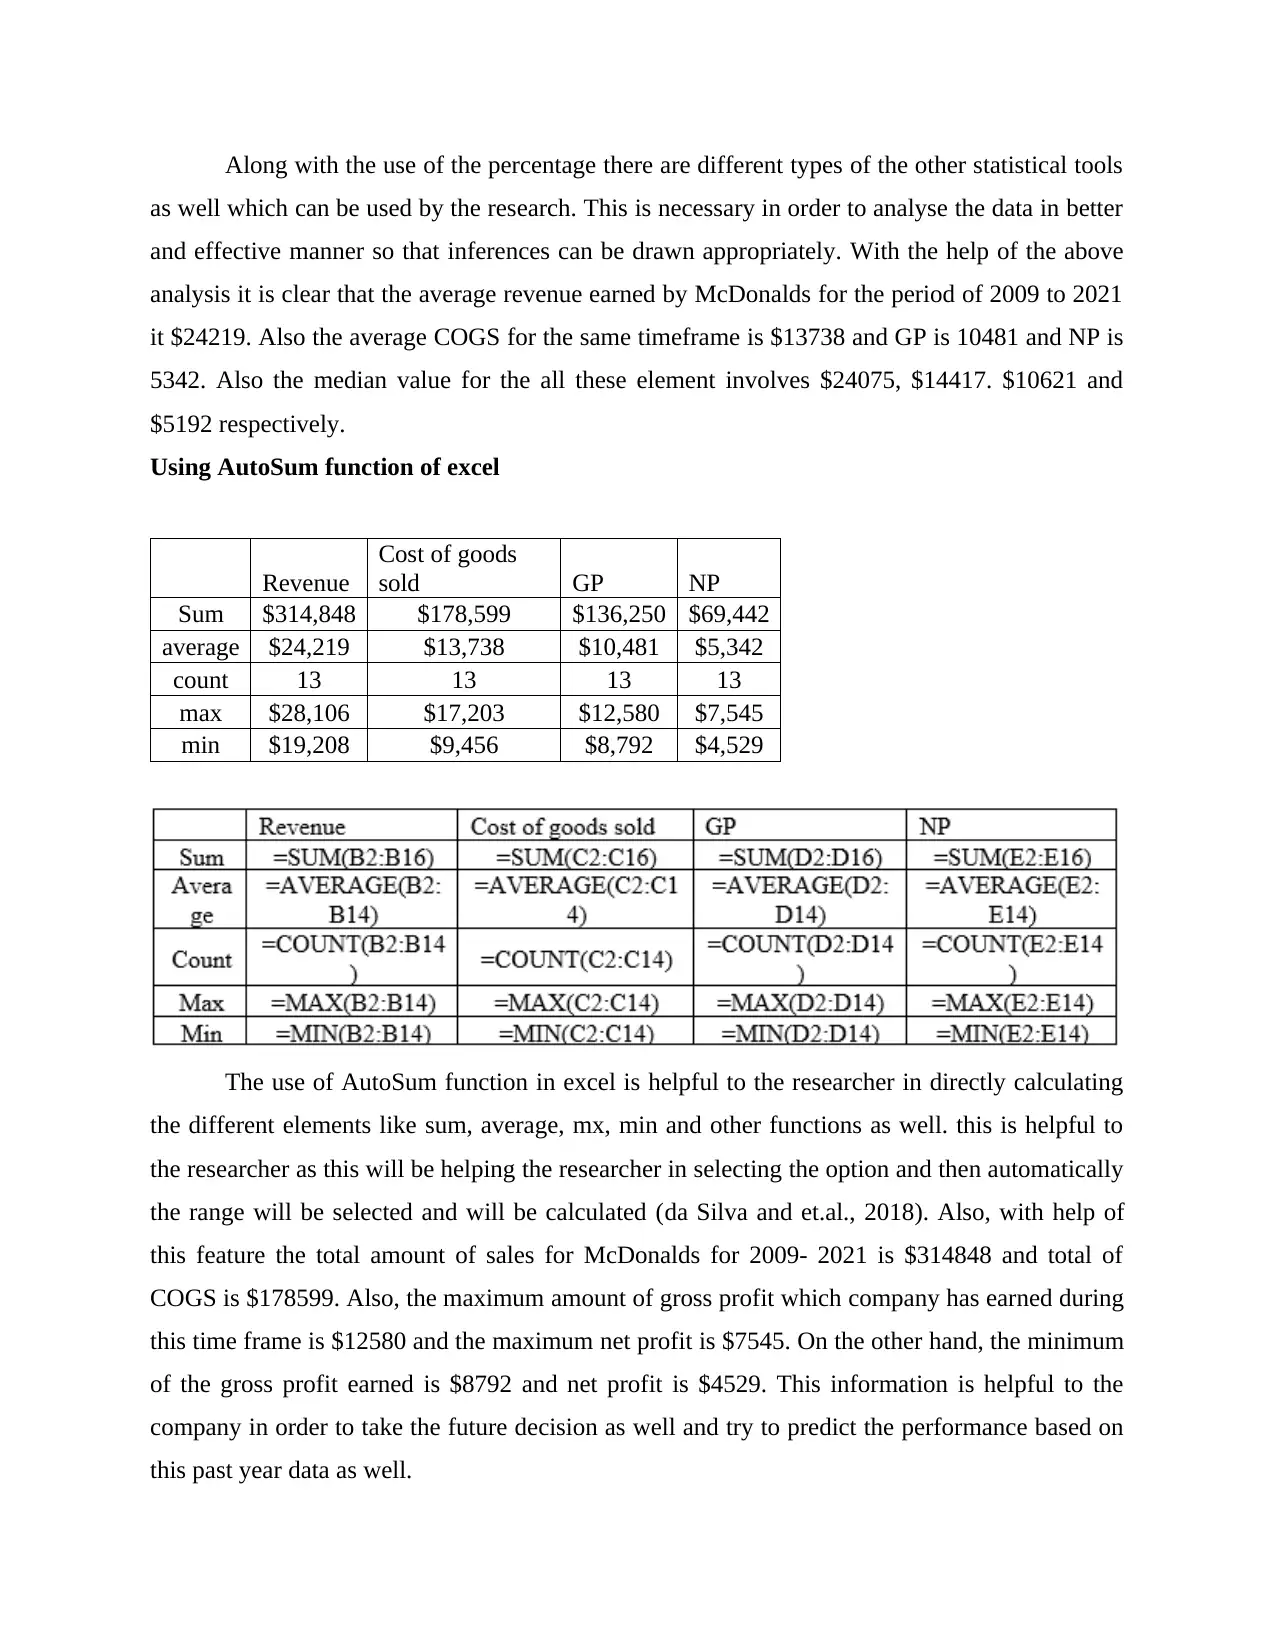
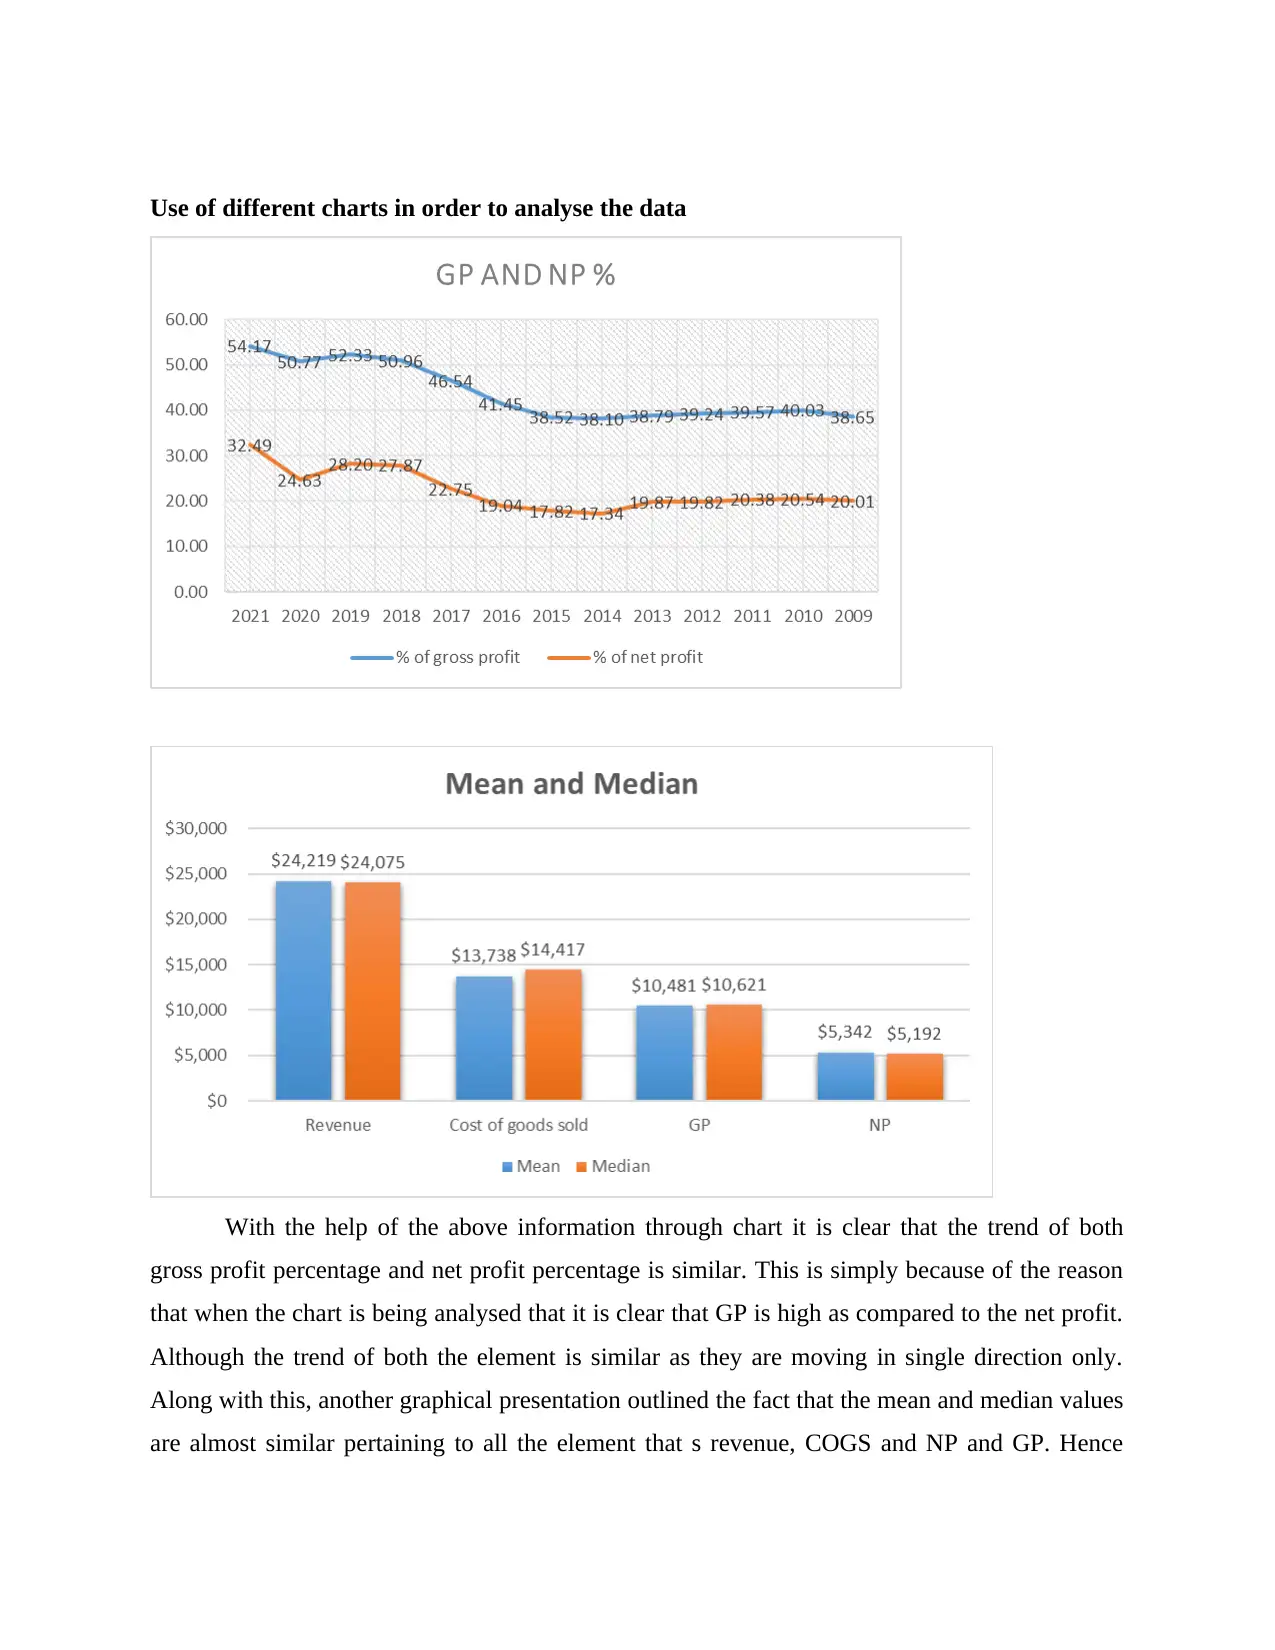
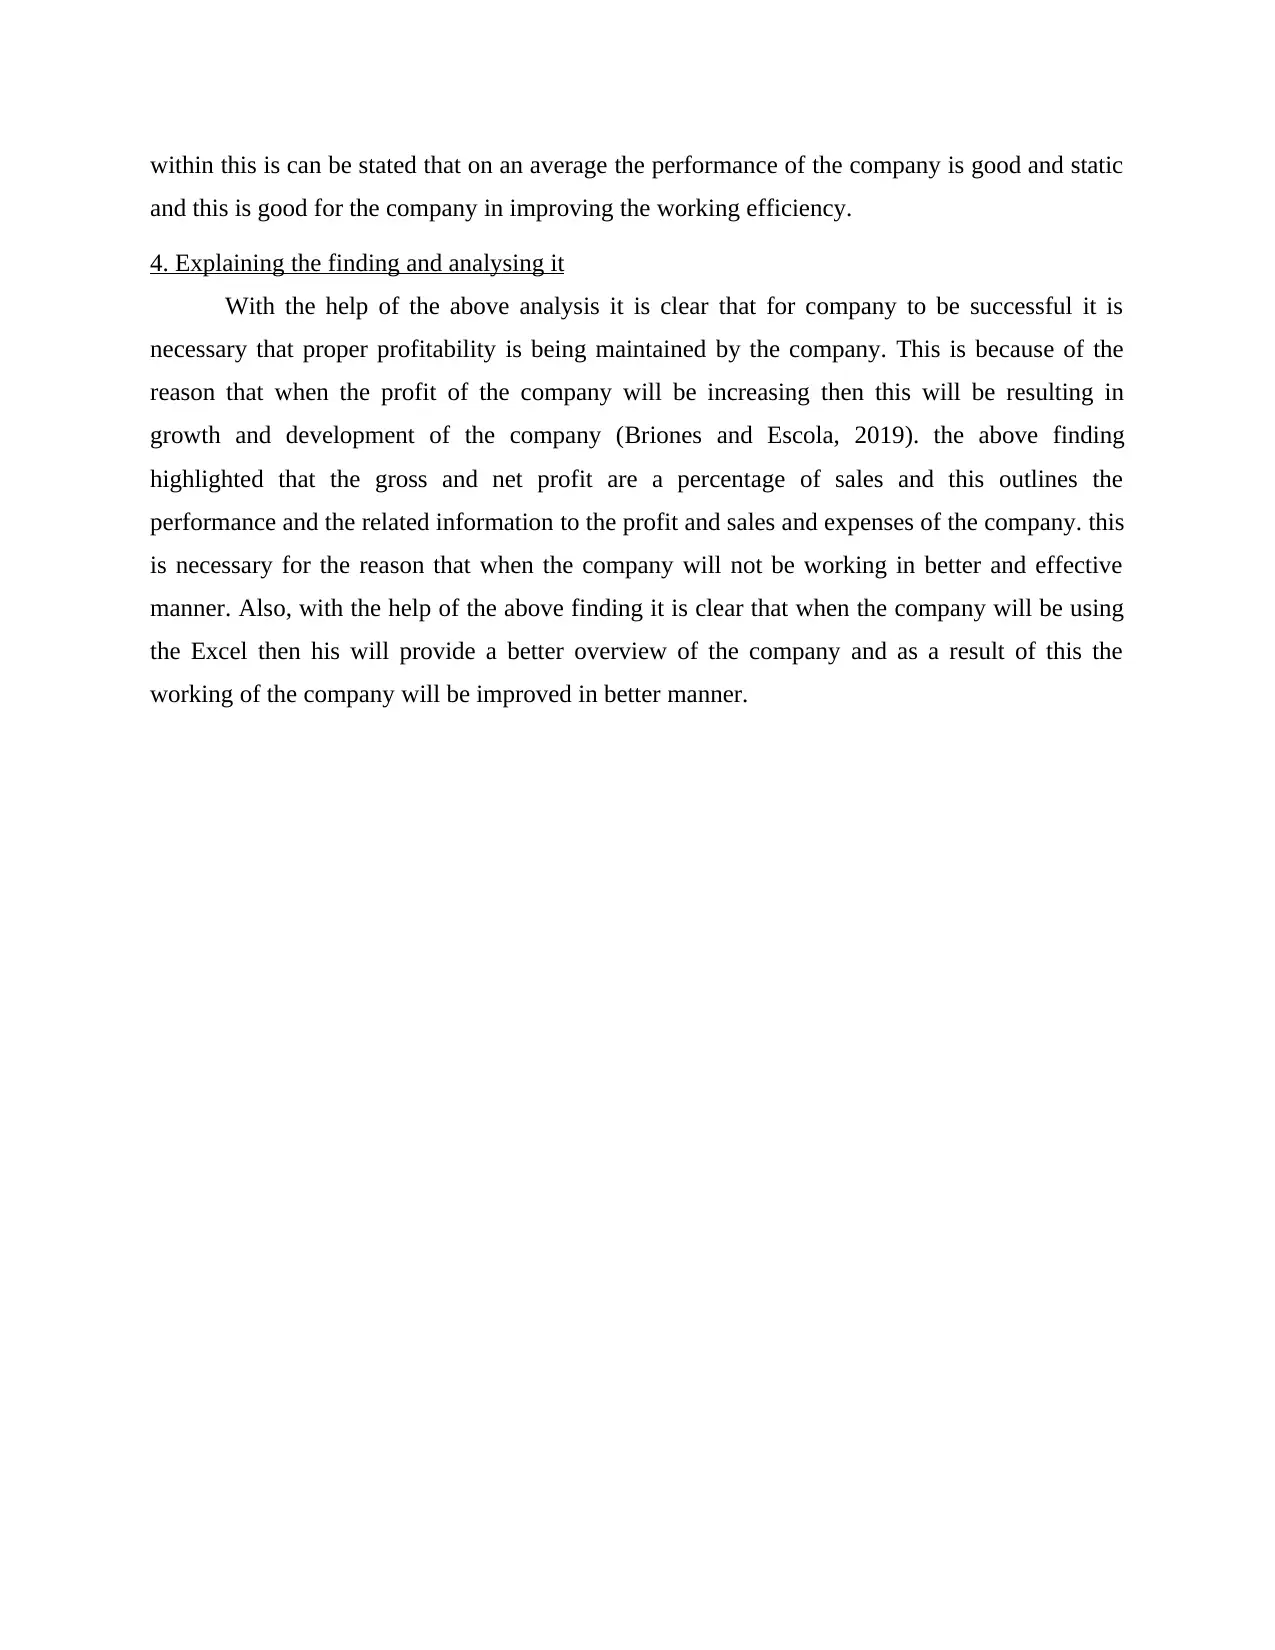
This assignment focuses on analyzing McDonald's financial performance from 2009 to 2021 using MS Excel. The analysis includes calculating percentages of gross and net profit, employing statistical tools like mean, median, and mode, and utilizing the AutoSum function for calculating sums, averages, maximums, and minimums for revenue, cost of goods sold (COGS), gross profit (GP), and net profit (NP). Different charts are used to visualize the data and analyze trends in gross profit and net profit percentages. The findings highlight the importance of profitability for company success and demonstrate how Excel can provide a better overview of a company's financial health, aiding in improved decision-making and working efficiency. The document also includes a list of references used for the analysis.
Document Page
MS Excel task
tabler-icon-diamond-filled.svg

Paraphrase This Document

Need a fresh take? Get an instant paraphrase of this document with our AI Paraphraser
Document Page
TABLE OF CONTENTS
MAIN BODY...................................................................................................................................3
1. Research topic.........................................................................................................................3
2. Raw data relating to research topic.........................................................................................3
3. Use of MS Excel.....................................................................................................................3
4. Explaining the finding and analysing it..................................................................................7
REFERENCES................................................................................................................................8
Document Page
MAIN BODY
1. Research topic
For the business to be successful it is necessary that the company must be working in
better and effective manner so that profitability is being increased. Working on increasing the
performance of the company it is necessary for the reason that in case profits will not be earned
by the company then this will be affecting the working efficiency of the company (Alsaadi, and
et.al., 2018). The profitability can be calculated by reducing all the expenses from the total
income of the company. In the present case the use of McDonalds past years’ data has been
undertaken in order to analyse the efficiency of the company.
2. Raw data relating to research topic
For the working of the research and use of MS Excel is very important for the reason that
without the data the working cannot be undertaken. This is pertaining to the fact that when the
data is collected in appropriate manner then this will help in proving the objective of the study
correctly (McDonald's Revenue 2010-2021 | MCD, 2022). For this the raw data is collected
relating to sales, cost of sale, gross profit and net profit of McDonalds.
3. Use of MS Excel
Calculating the percentage
Year % of gross profit % of net profit
2021 54.17 32.49
2020 50.77 24.63
2019 52.33 28.20
2018 50.96 27.87
2017 46.54 22.75
2016 41.45 19.04
2015 38.52 17.82
2014 38.10 17.34
2013 38.79 19.87
2012 39.24 19.82
2011 39.57 20.38
2010 40.03 20.54
2009 38.65 20.01
Document Page
With the help of the above analysis it is clear that the percentage provides help to the
researcher in order to analyse the overall percentage from the total sales of the profit. With
respect to this the percentage of gross profit and net profit is being calculated in the form of total
percentage of the sales (Tsatsakis and et.al., 2019). The gross profit percentage is being
calculated as gross profit divided by sales and the net profit is being calculated by the division of
net profit by total sales.
Use of different statistical techniques
Statistical
tool Revenue
Cost of goods
sold GP NP
Mean $24,219 $13,738 $10,481 $5,342
Median $24,075 $14,417 $10,621 $5,192
Mode #N/A #N/A #N/A #N/A
tabler-icon-diamond-filled.svg

Paraphrase This Document

Need a fresh take? Get an instant paraphrase of this document with our AI Paraphraser
Document Page
Along with the use of the percentage there are different types of the other statistical tools
as well which can be used by the research. This is necessary in order to analyse the data in better
and effective manner so that inferences can be drawn appropriately. With the help of the above
analysis it is clear that the average revenue earned by McDonalds for the period of 2009 to 2021
it $24219. Also the average COGS for the same timeframe is $13738 and GP is 10481 and NP is
5342. Also the median value for the all these element involves $24075, $14417. $10621 and
$5192 respectively.
Using AutoSum function of excel
Revenue
Cost of goods
sold GP NP
Sum $314,848 $178,599 $136,250 $69,442
average $24,219 $13,738 $10,481 $5,342
count 13 13 13 13
max $28,106 $17,203 $12,580 $7,545
min $19,208 $9,456 $8,792 $4,529
The use of AutoSum function in excel is helpful to the researcher in directly calculating
the different elements like sum, average, mx, min and other functions as well. this is helpful to
the researcher as this will be helping the researcher in selecting the option and then automatically
the range will be selected and will be calculated (da Silva and et.al., 2018). Also, with help of
this feature the total amount of sales for McDonalds for 2009- 2021 is $314848 and total of
COGS is $178599. Also, the maximum amount of gross profit which company has earned during
this time frame is $12580 and the maximum net profit is $7545. On the other hand, the minimum
of the gross profit earned is $8792 and net profit is $4529. This information is helpful to the
company in order to take the future decision as well and try to predict the performance based on
this past year data as well.
Document Page
Use of different charts in order to analyse the data
With the help of the above information through chart it is clear that the trend of both
gross profit percentage and net profit percentage is similar. This is simply because of the reason
that when the chart is being analysed that it is clear that GP is high as compared to the net profit.
Although the trend of both the element is similar as they are moving in single direction only.
Along with this, another graphical presentation outlined the fact that the mean and median values
are almost similar pertaining to all the element that s revenue, COGS and NP and GP. Hence
Document Page
within this is can be stated that on an average the performance of the company is good and static
and this is good for the company in improving the working efficiency.
4. Explaining the finding and analysing it
With the help of the above analysis it is clear that for company to be successful it is
necessary that proper profitability is being maintained by the company. This is because of the
reason that when the profit of the company will be increasing then this will be resulting in
growth and development of the company (Briones and Escola, 2019). the above finding
highlighted that the gross and net profit are a percentage of sales and this outlines the
performance and the related information to the profit and sales and expenses of the company. this
is necessary for the reason that when the company will not be working in better and effective
manner. Also, with the help of the above finding it is clear that when the company will be using
the Excel then his will provide a better overview of the company and as a result of this the
working of the company will be improved in better manner.
tabler-icon-diamond-filled.svg

Paraphrase This Document

Need a fresh take? Get an instant paraphrase of this document with our AI Paraphraser
Document Page
REFERENCES
Books and Journals
Alsaadi, H. I. and et.al., 2018, October. Text steganography in font color of MS excel sheet.
In Proceedings of the First International Conference on Data Science, E-learning and
Information Systems (pp. 1-7).
Briones, L. and Escola, J. M., 2019. Application of the Microsoft Excel Solver tool in the
solution of optimization problems of heat exchanger network systems. Education for
Chemical Engineers. 26. pp.41-47.
da Silva, R. J. and et.al., 2018. Tutorial and spreadsheets for Bayesian evaluation of risks of false
decisions on conformity of a multicomponent material or object due to measurement
uncertainty. Chemometrics and Intelligent Laboratory Systems. 182. pp.109-116.
Tsatsakis, A. and et.al., 2019. Developing BIOTEL: A semi-automated spreadsheet for
estimating telomere length and biological age. Frontiers in genetics. 10. p.84.
Online
McDonald's Revenue 2010-2021 | MCD. 2022. [Online]. Available through: <
https://www.macrotrends.net/stocks/charts/MCD/mcdonalds/revenue>
chevron_up_icon
1 out of 8
circle_padding
hide_on_mobile
zoom_out_icon
[object Object]