Financial Report: McDonald's Profit & Revenue Analysis (2009-2021)

Verified

Added on  2023/06/12

|15
|773
|293
Report
AI Summary
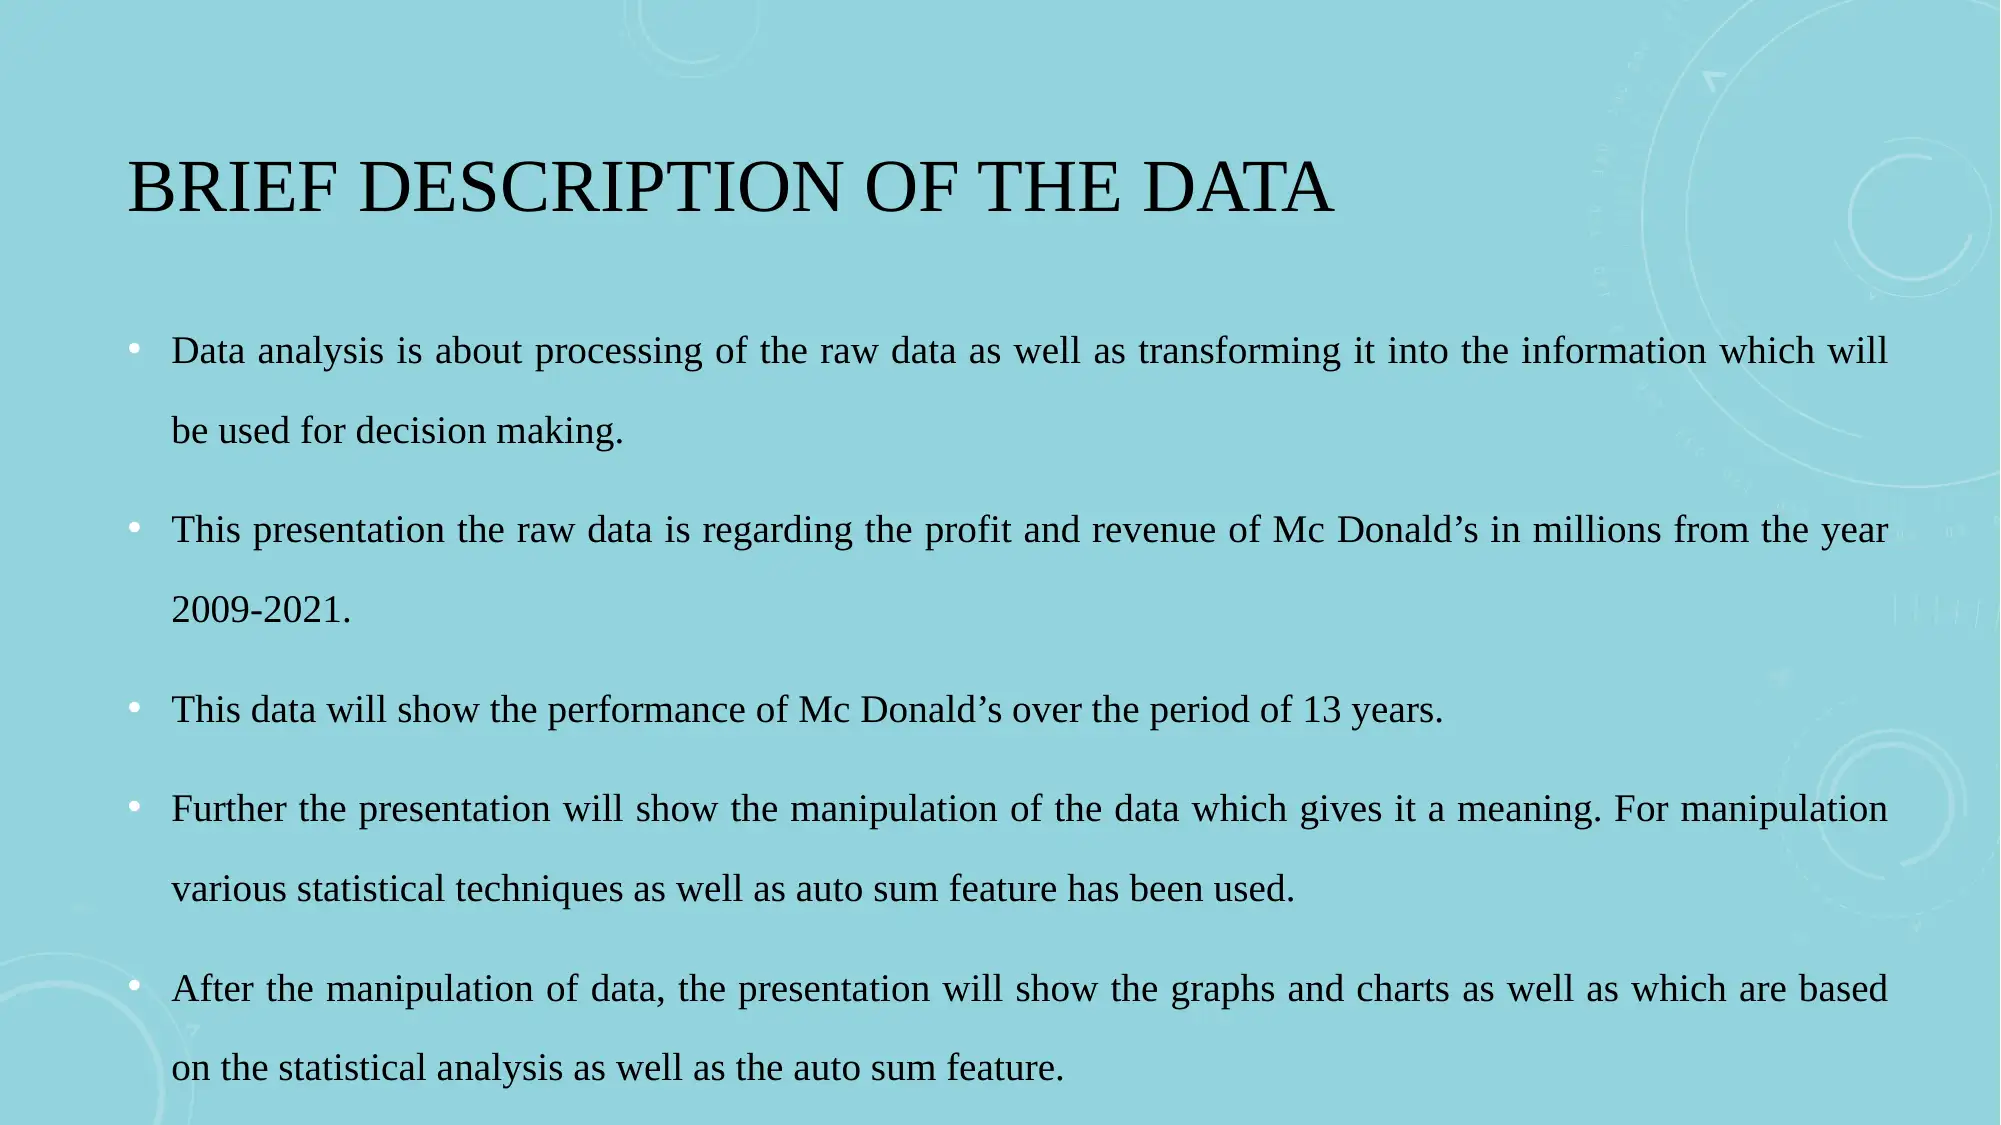
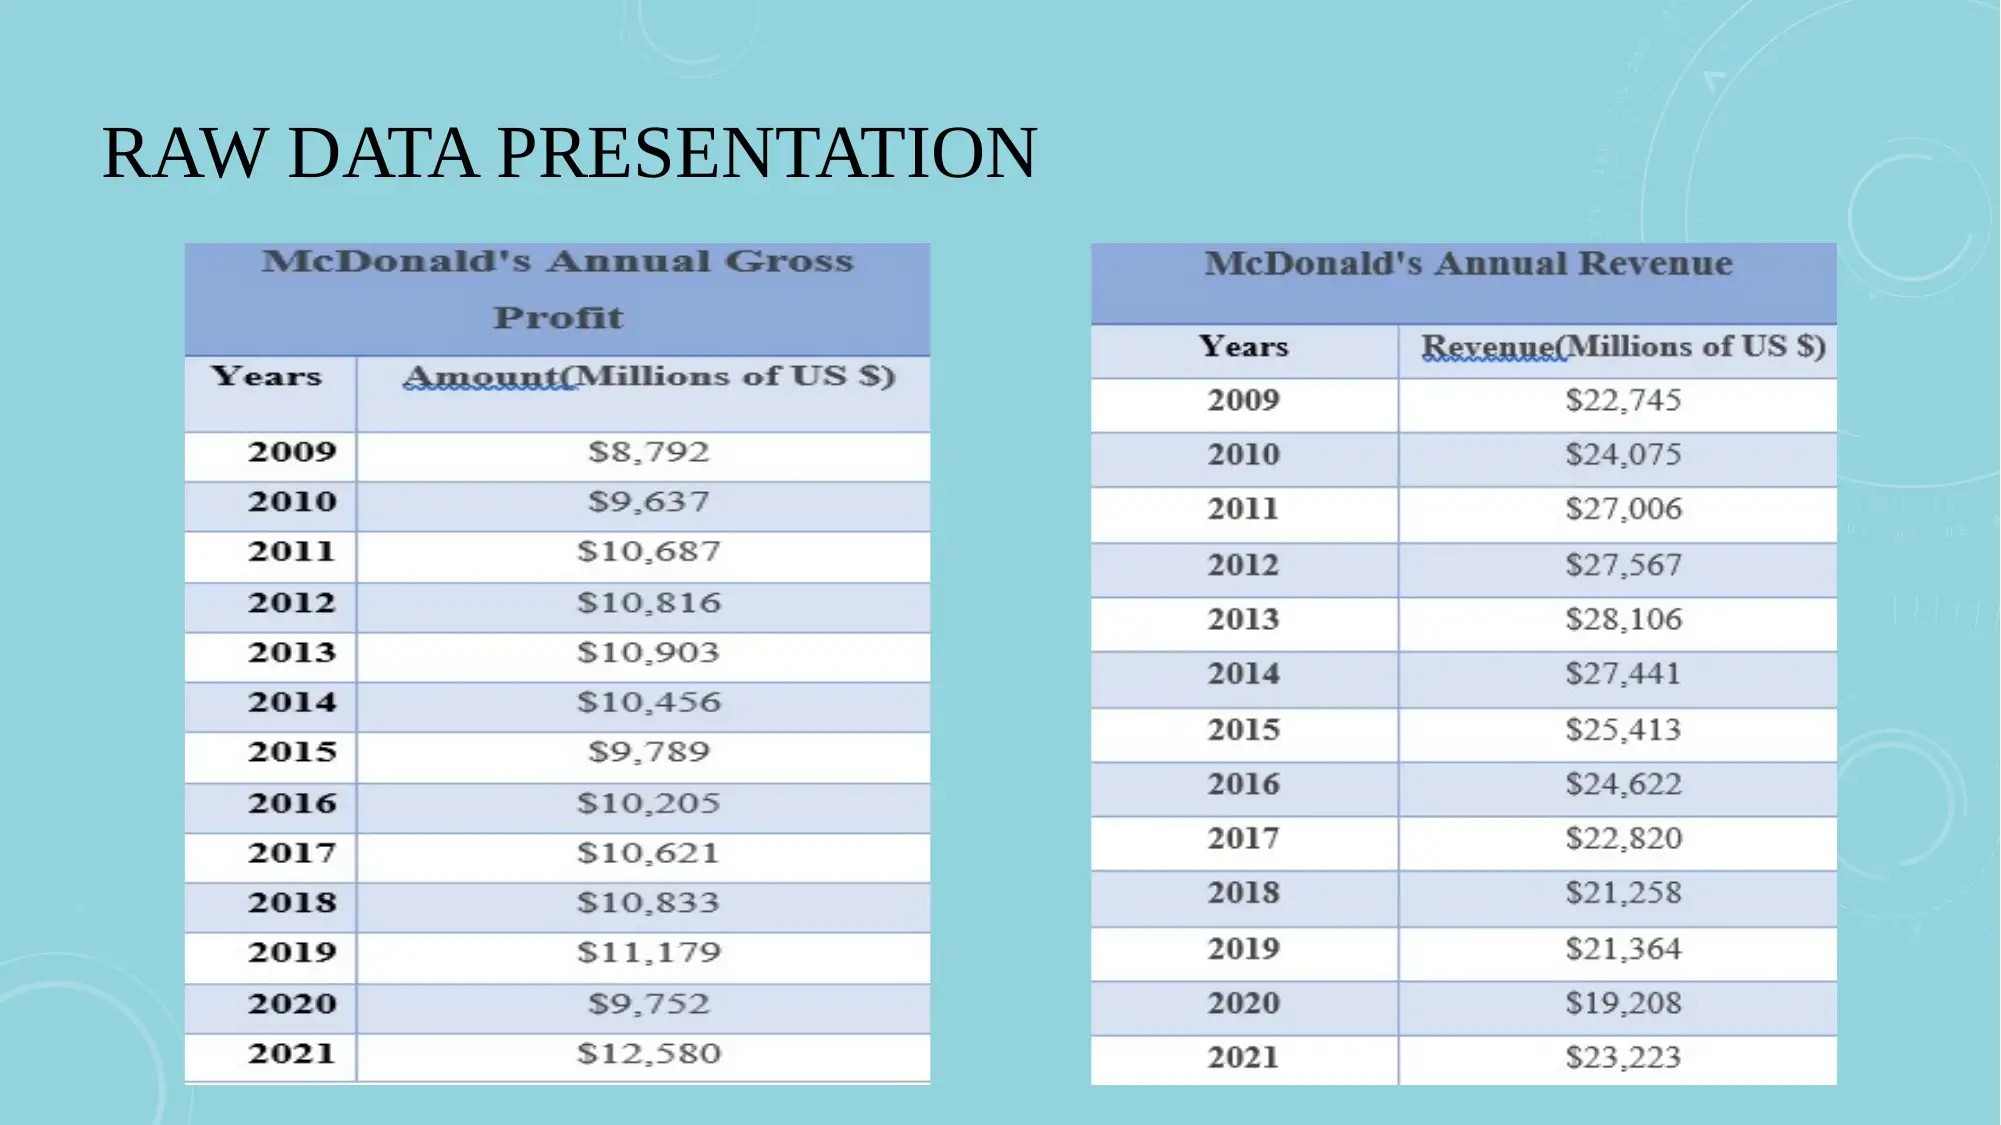
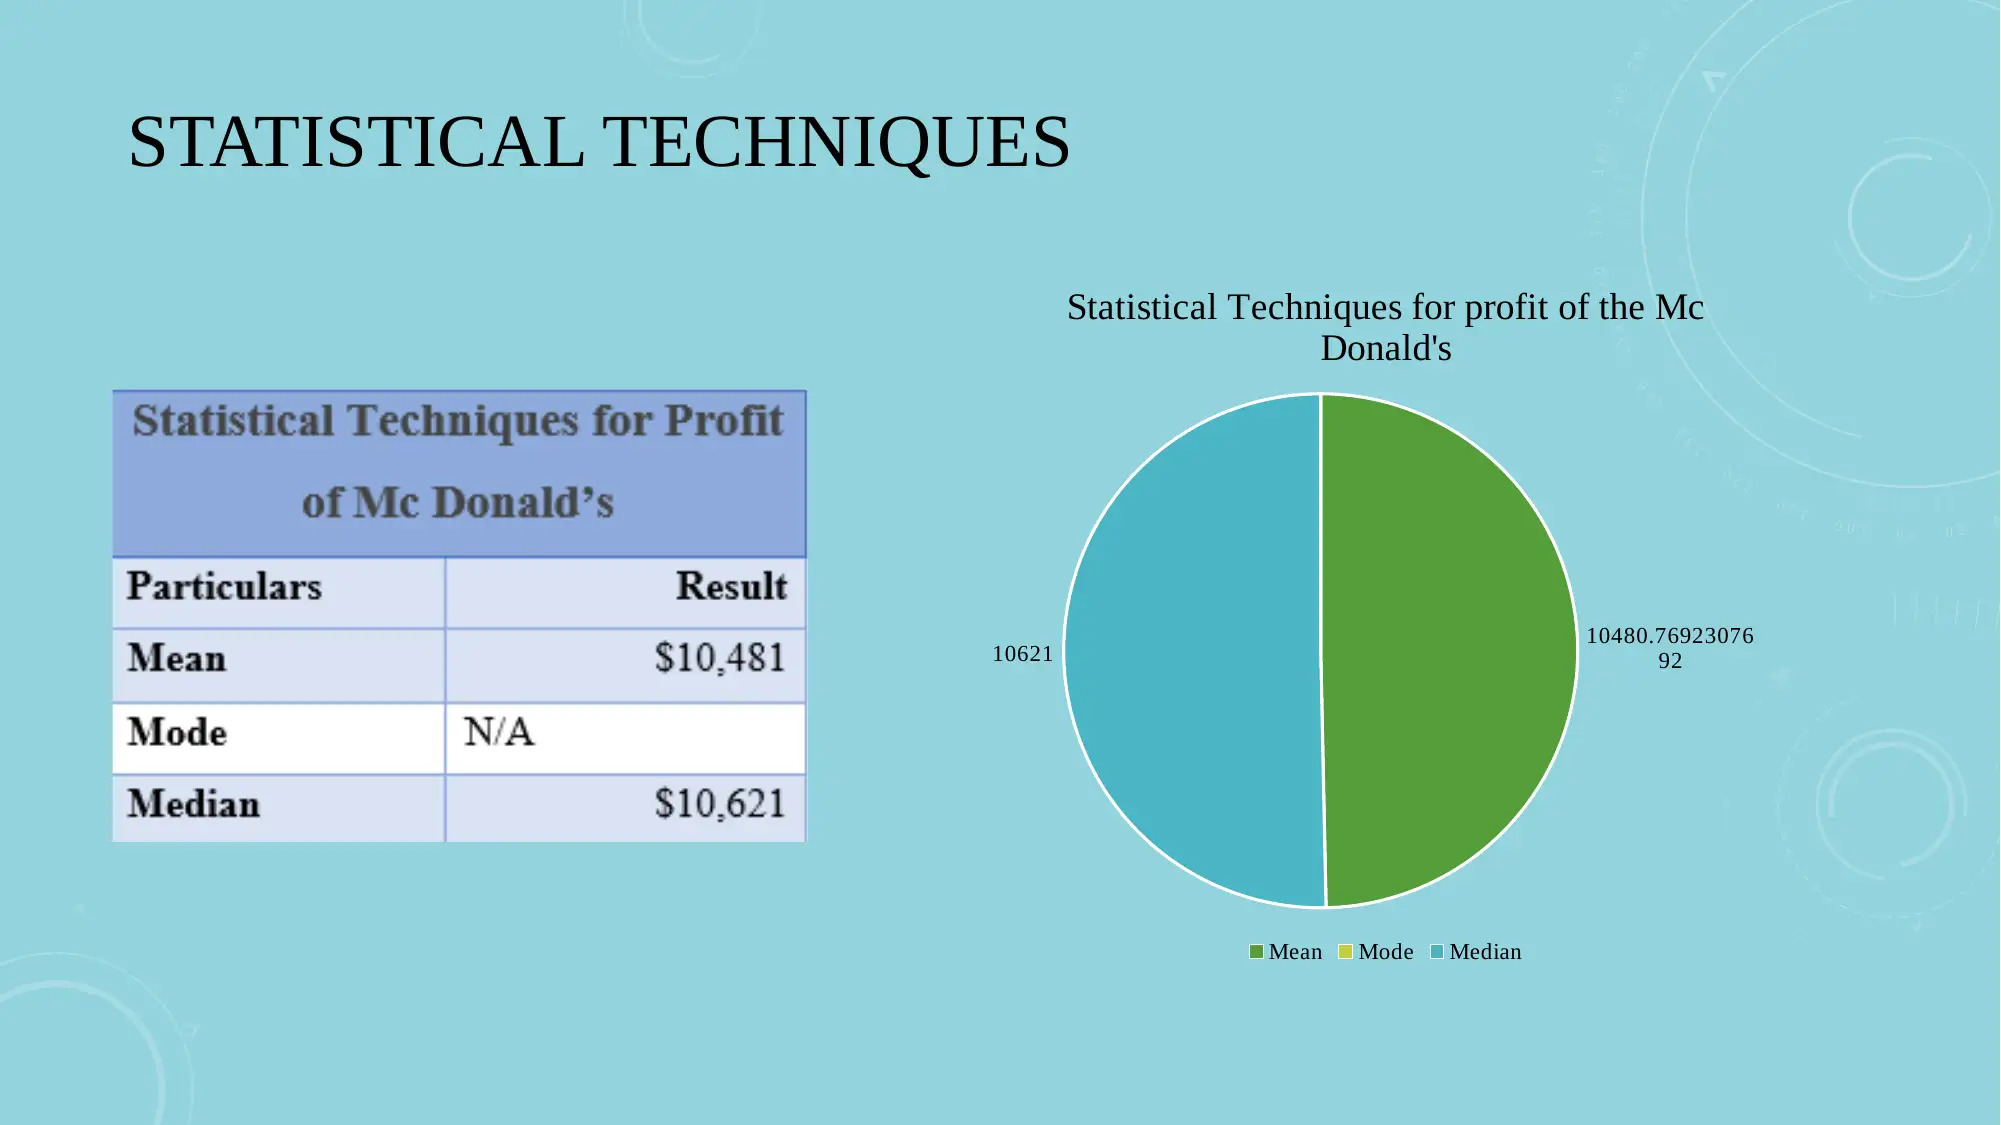
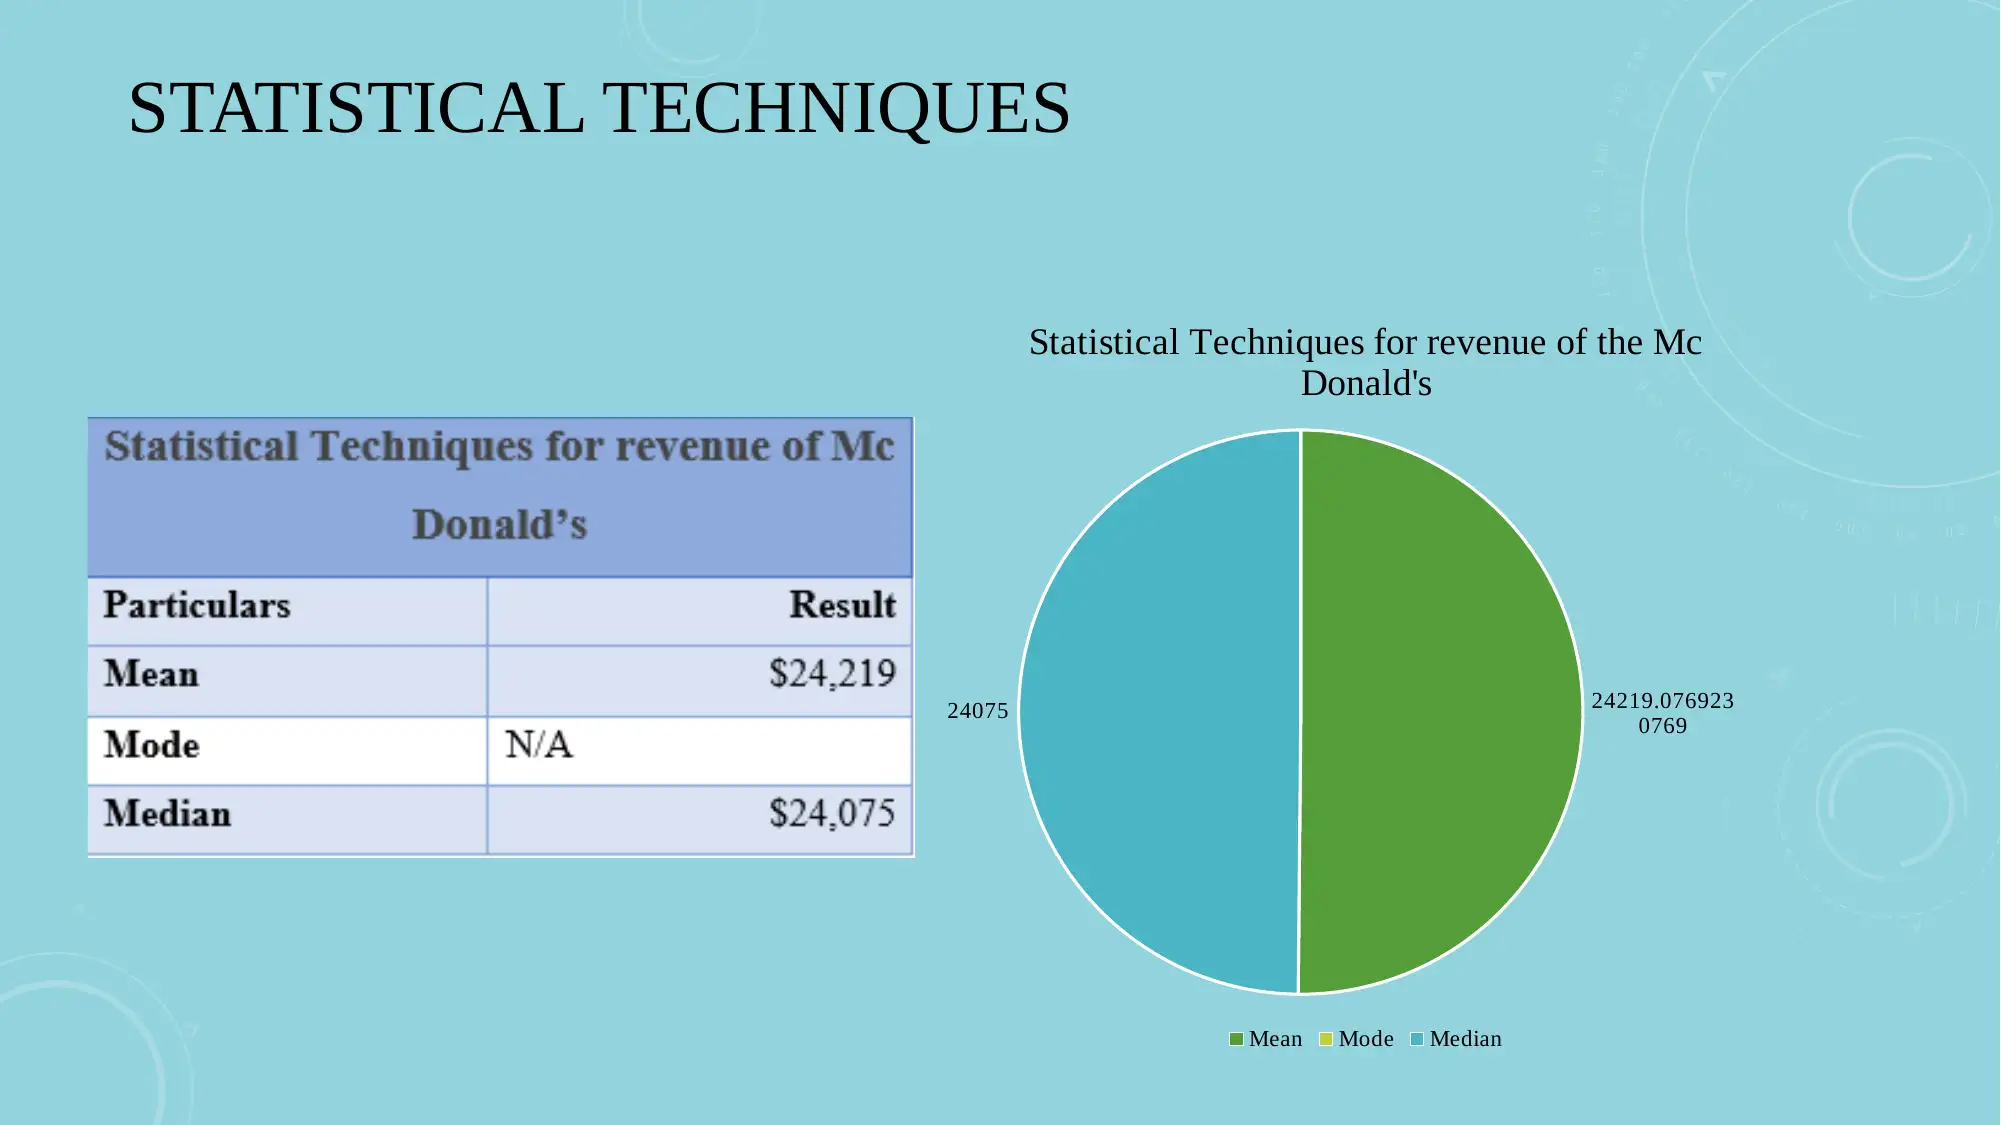
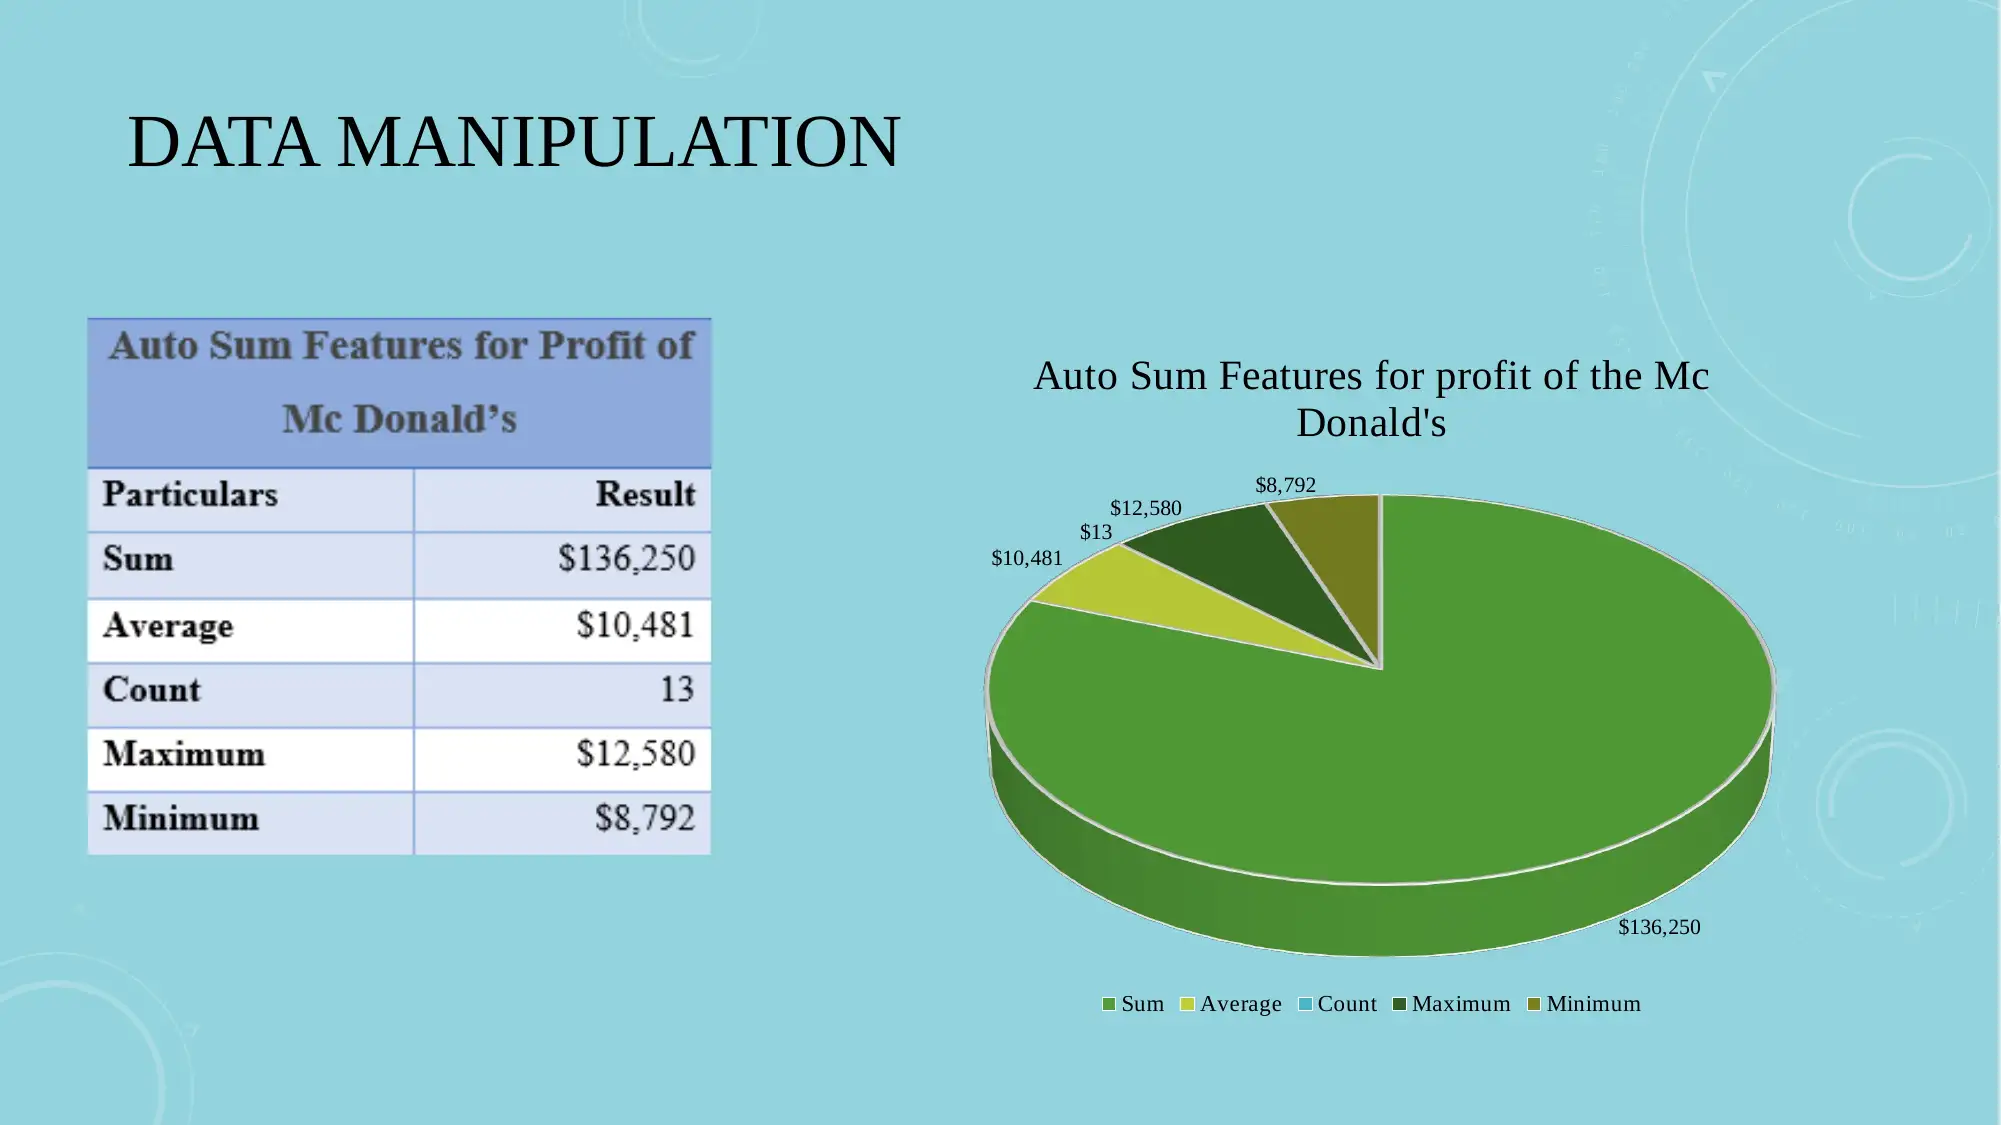
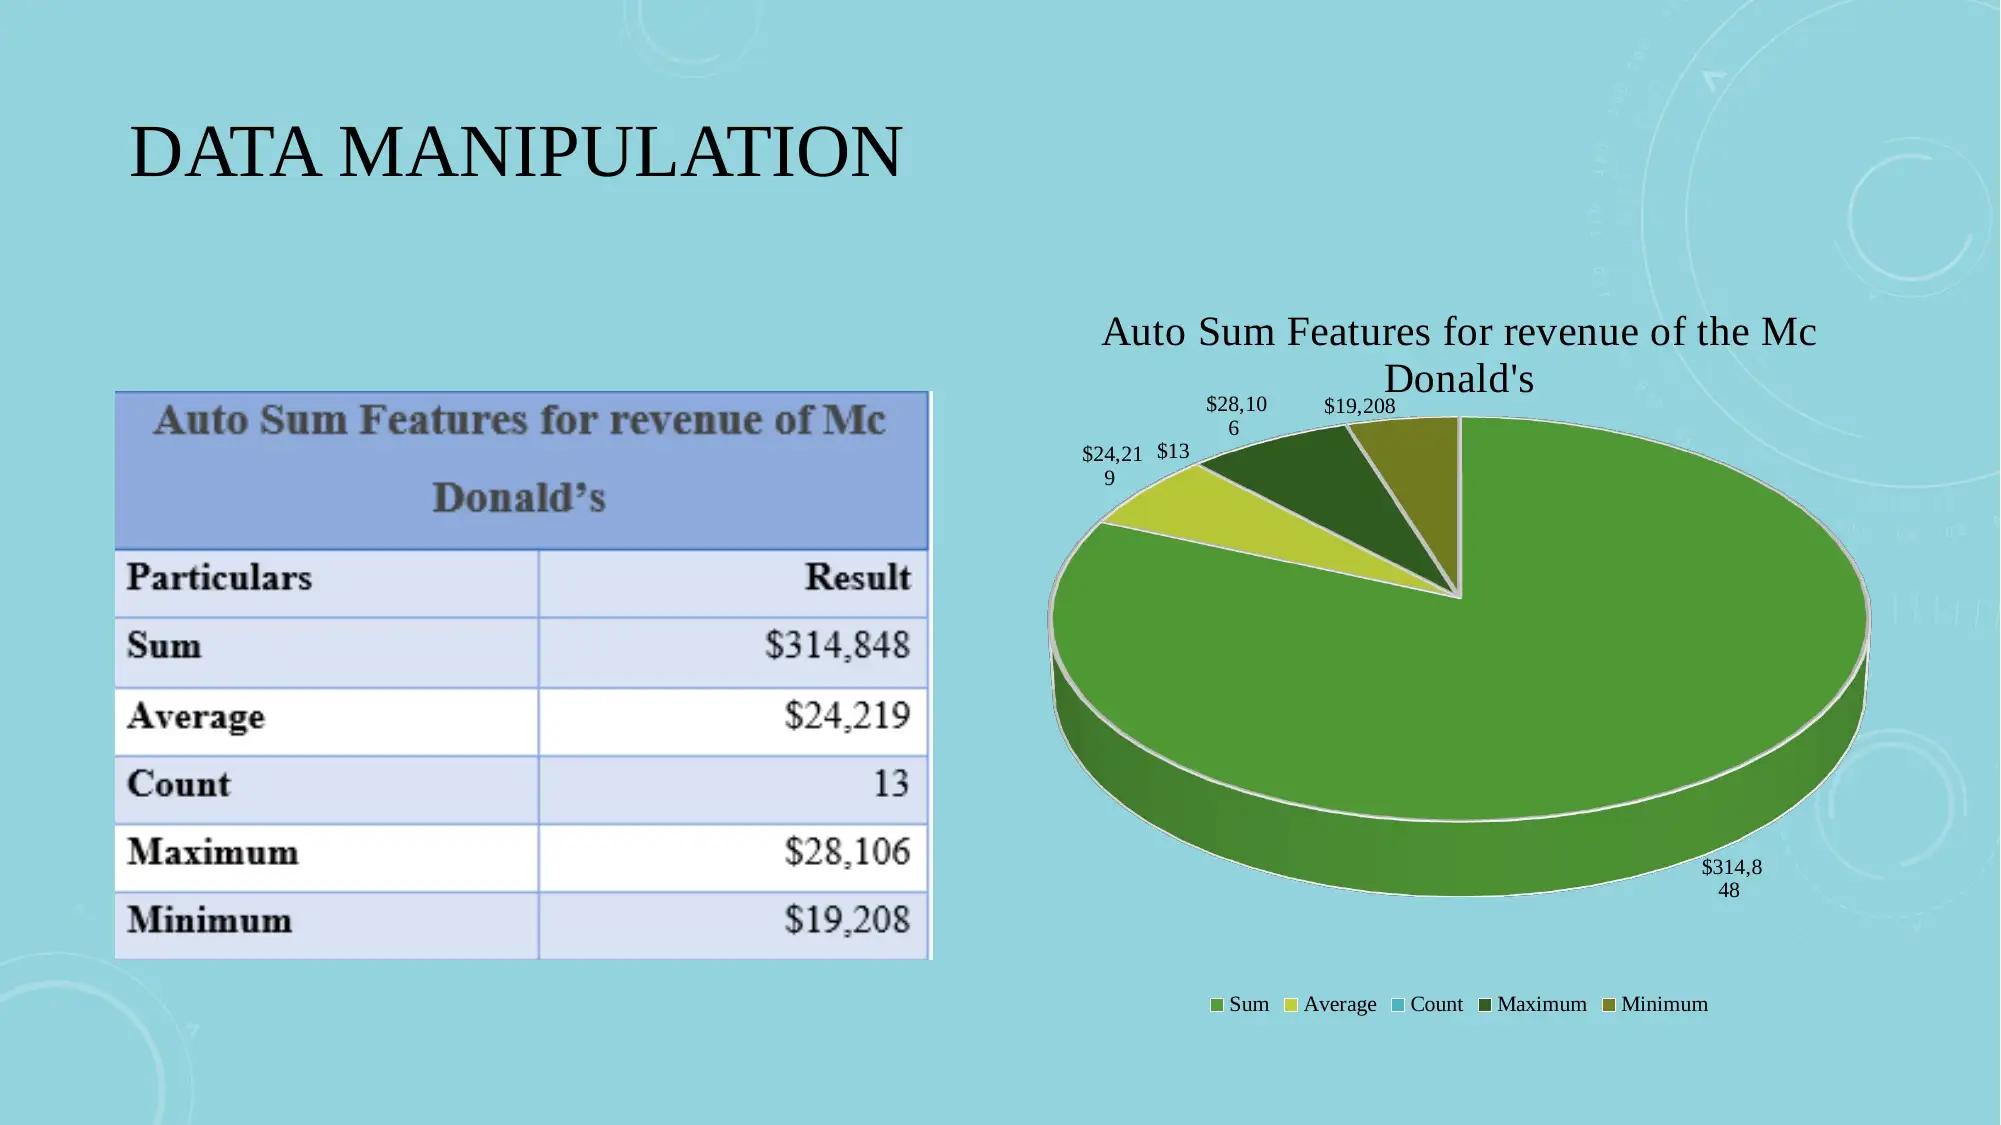
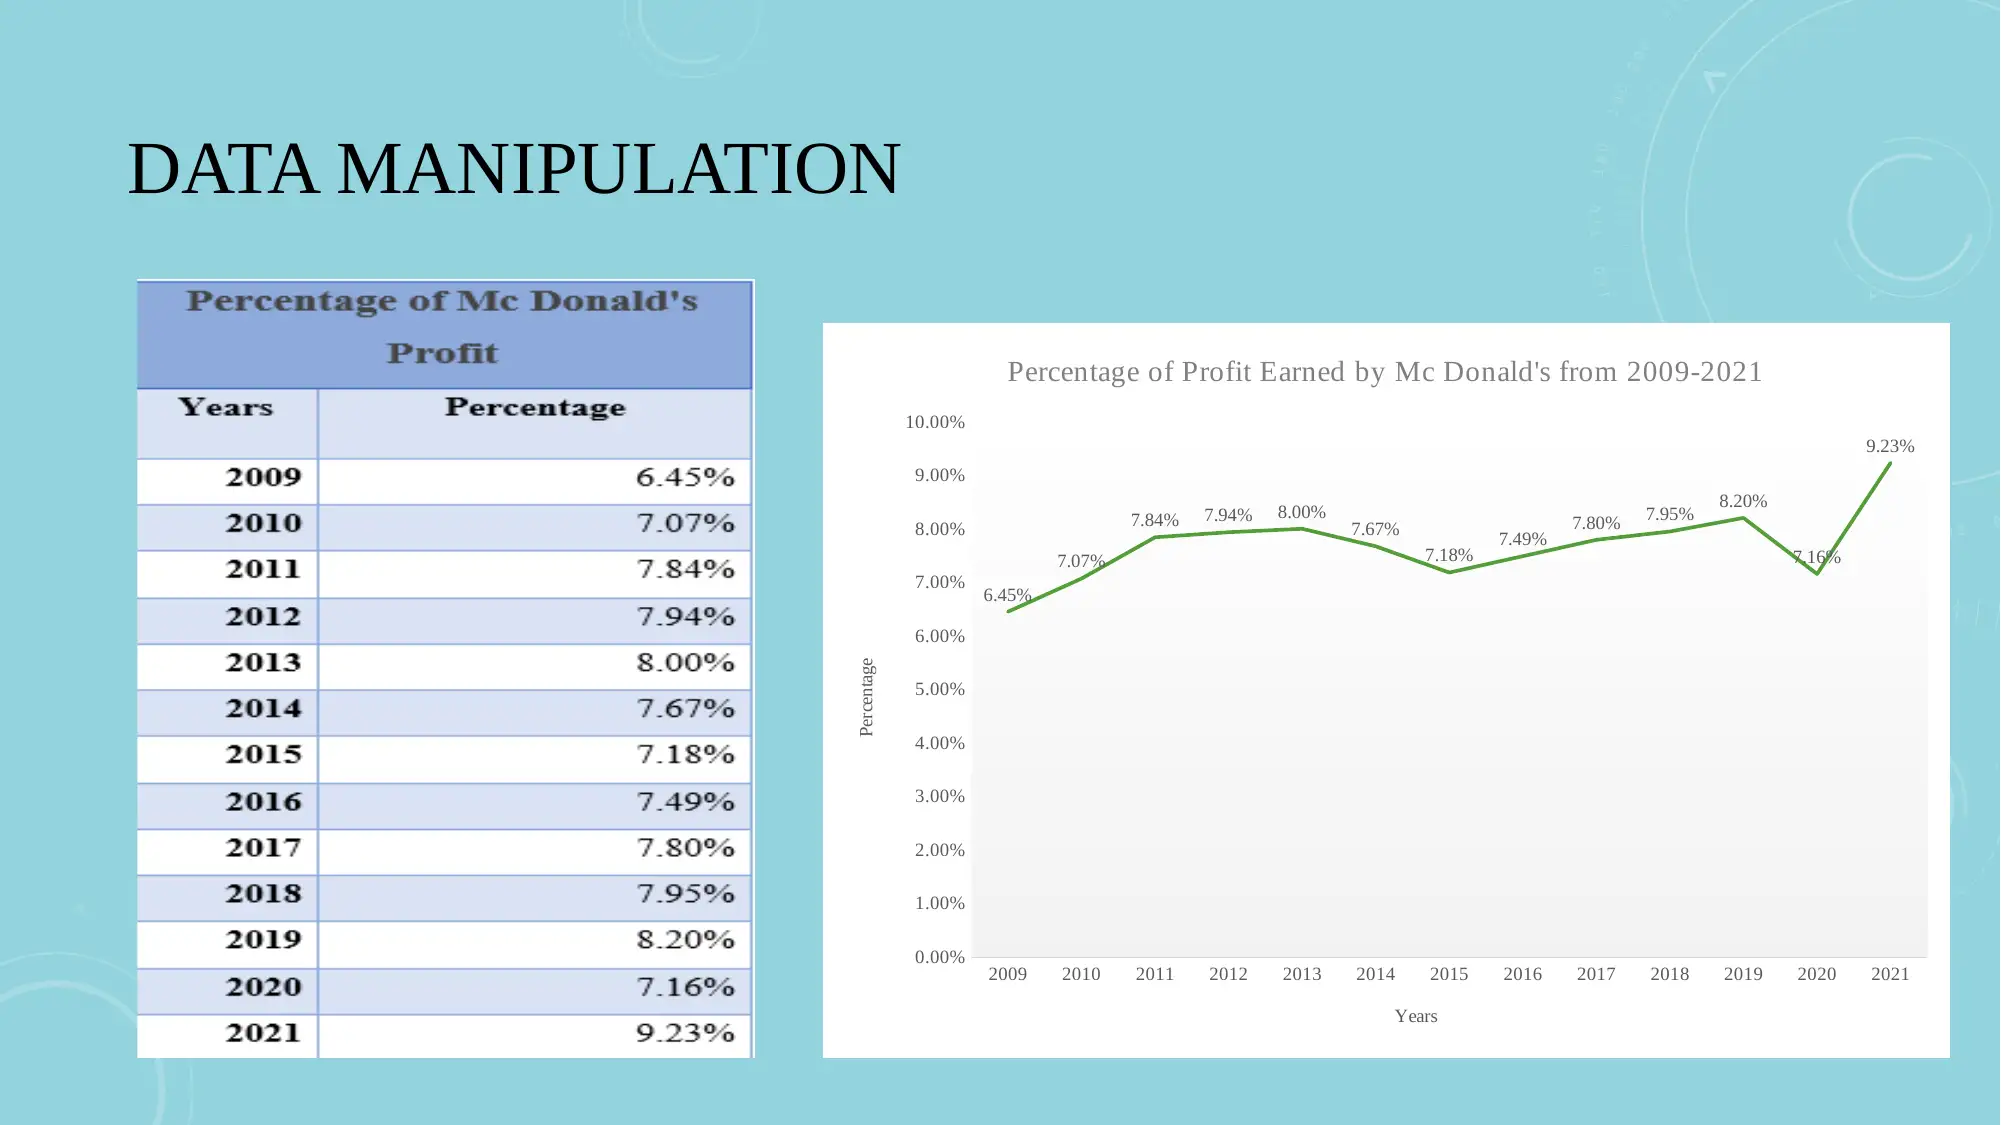
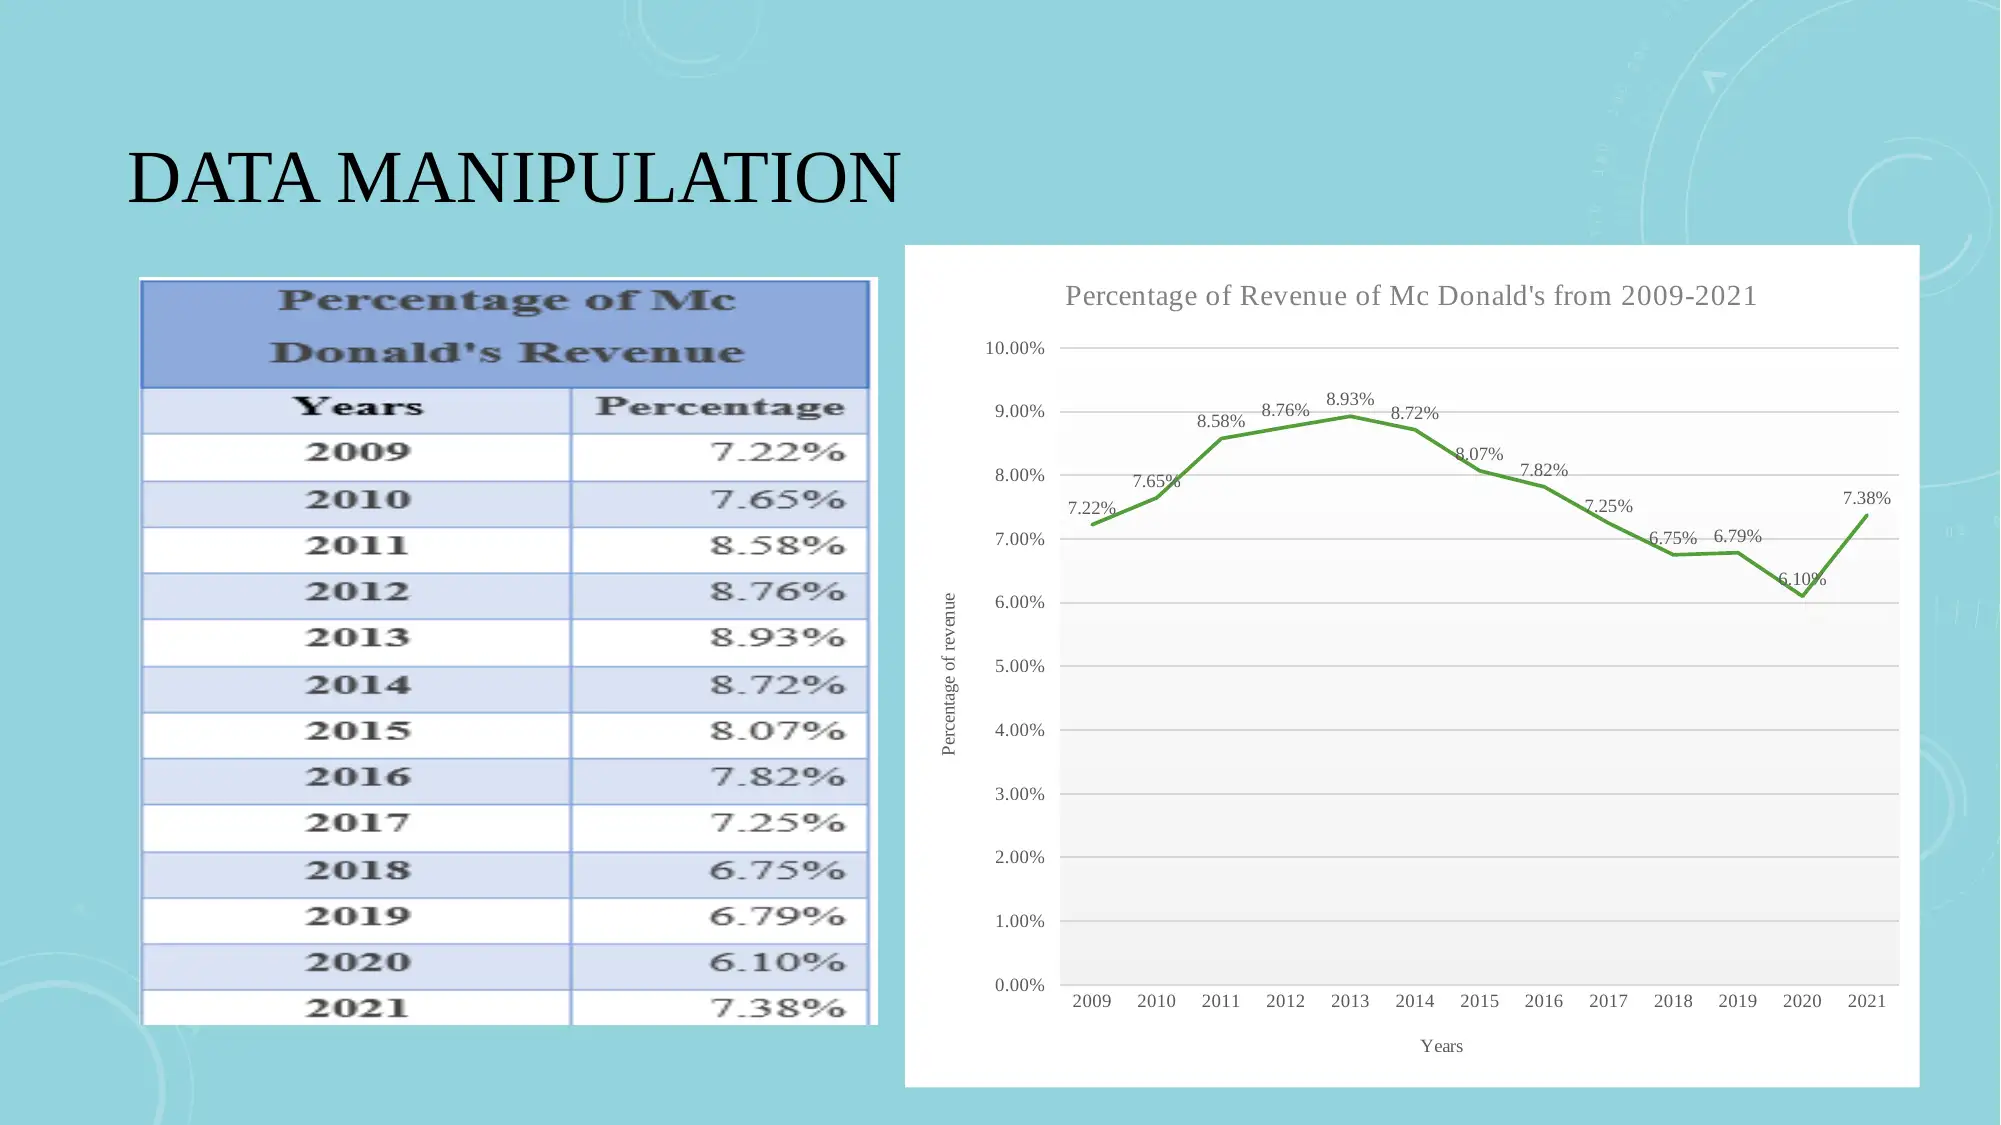
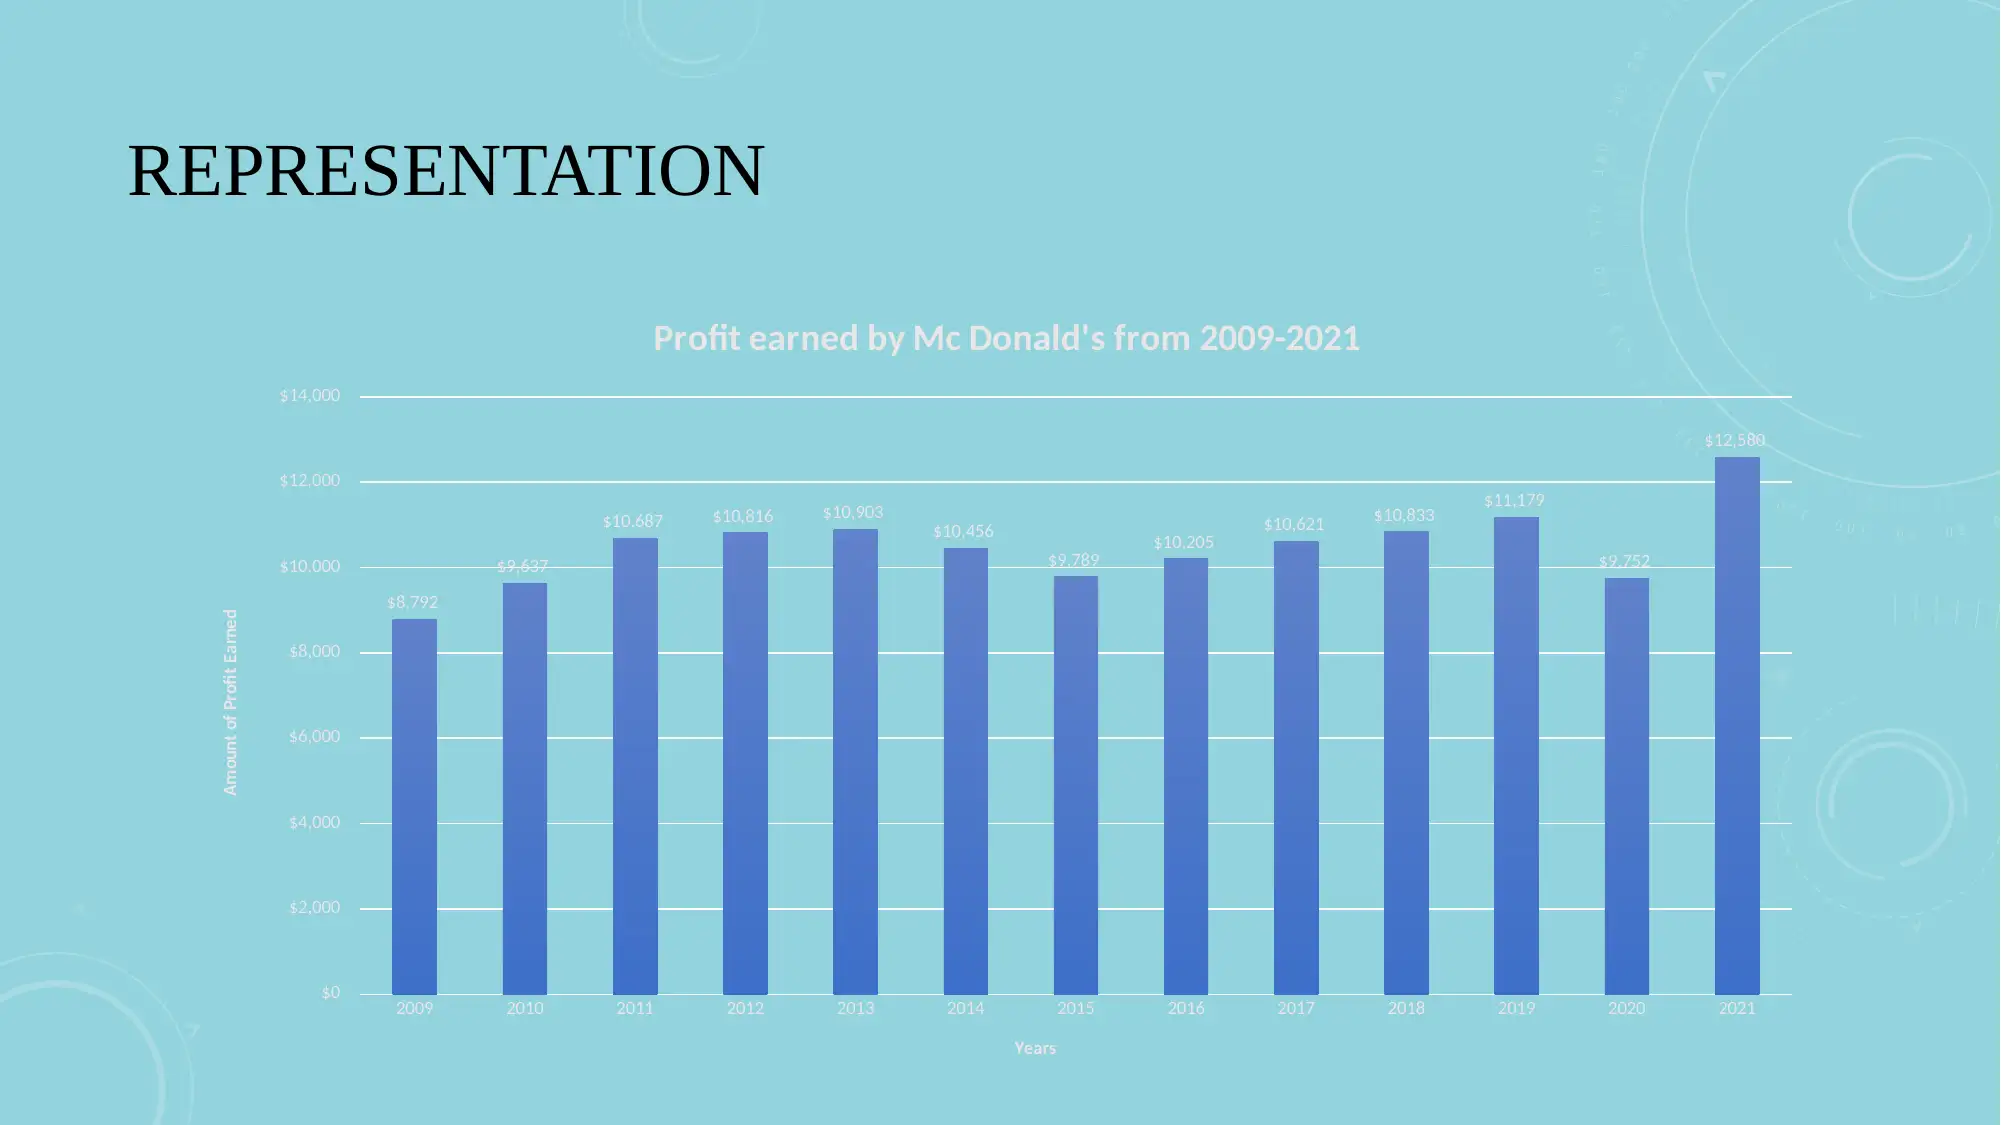
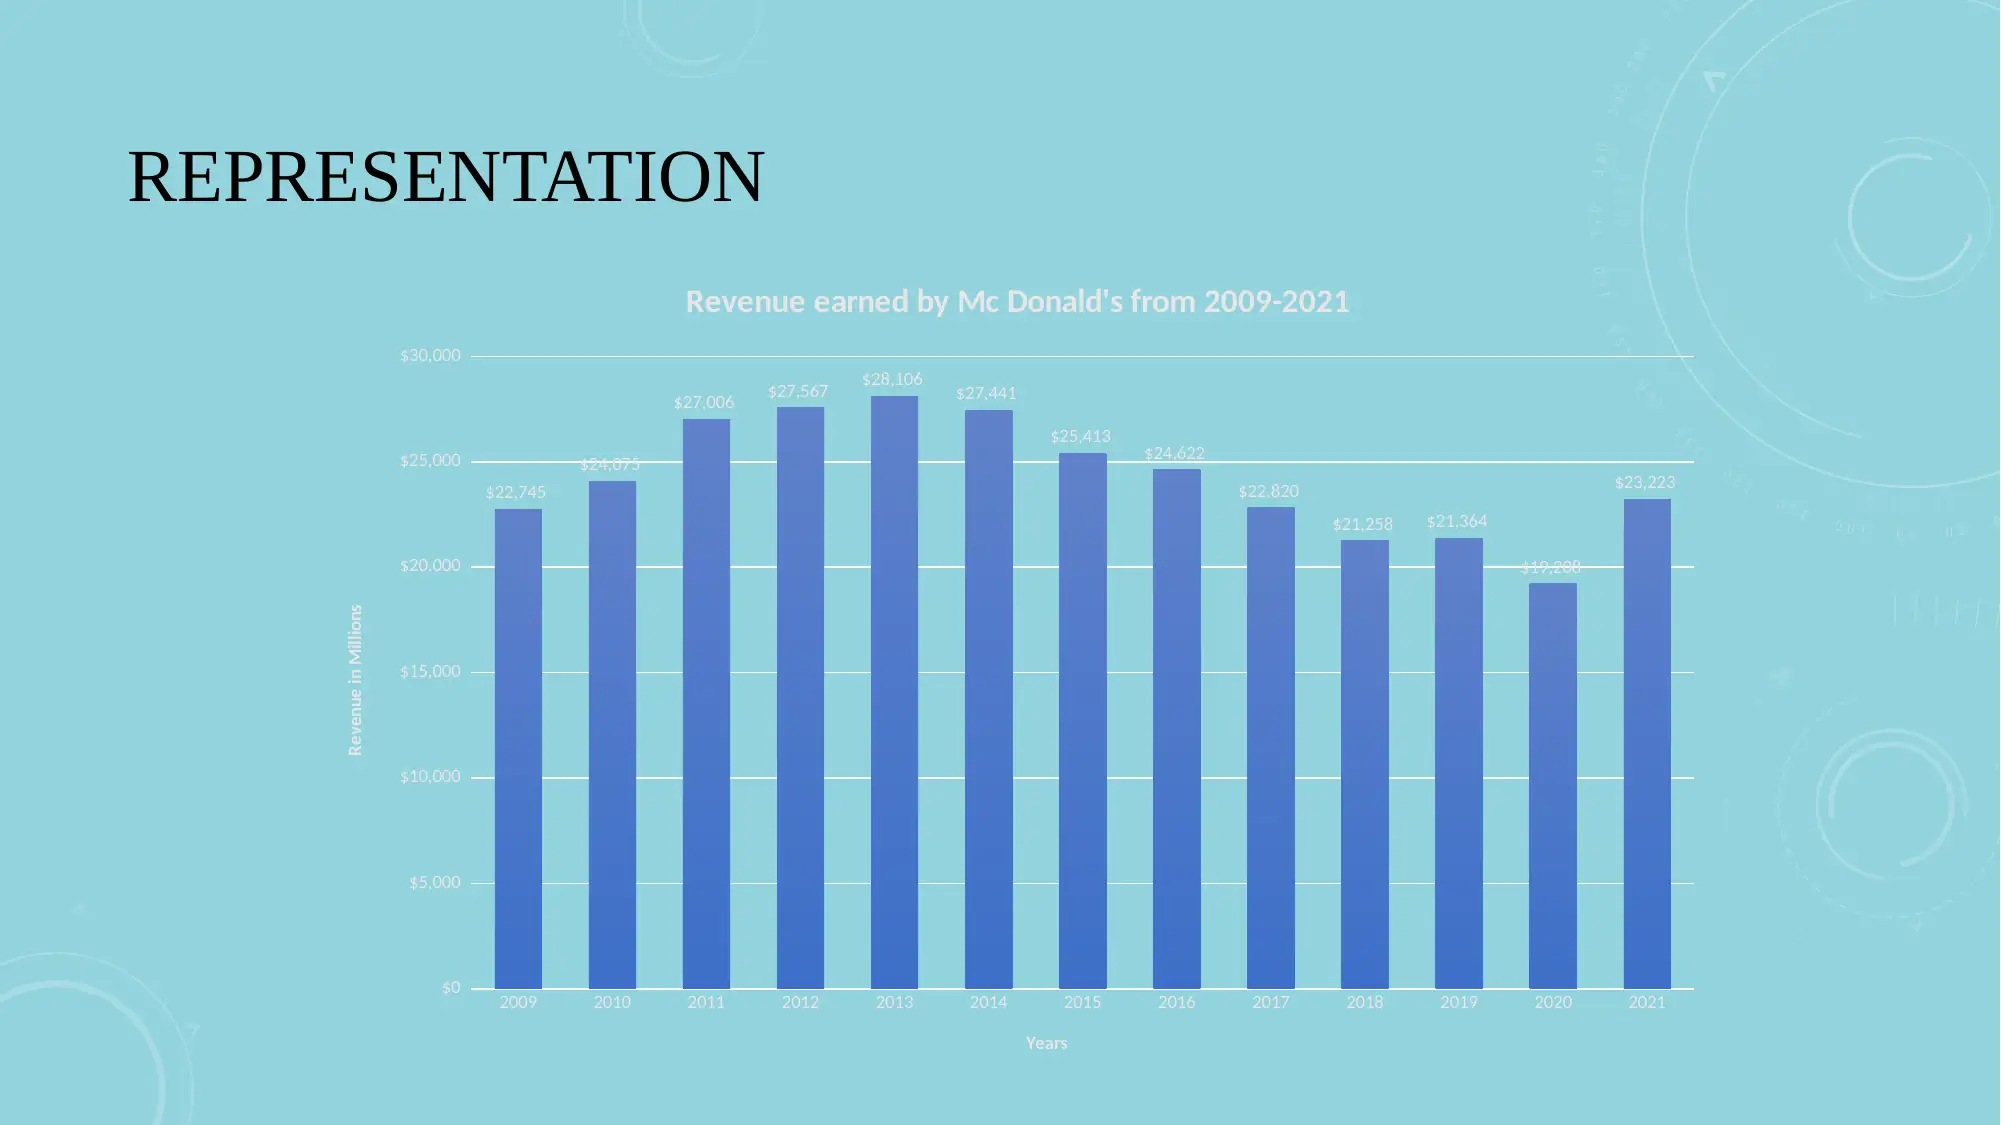
This report analyzes McDonald's financial performance from 2009 to 2021, focusing on profit and revenue trends. The analysis includes data manipulation using statistical techniques and auto-sum features in MS Excel to derive meaningful insights. The report presents raw data, manipulated data, and visualizations such as graphs and charts to illustrate the fluctuations in McDonald's profit and revenue over the 13-year period. Key statistical measures like mean, mode, and median are calculated for both profit and revenue. The report concludes that McDonald's experienced fluctuations in both profit and revenue but showed improvement after 2020. It also references various academic sources for statistical methods and data manipulation techniques. Desklib provides access to this and many other solved assignments for students.
Document Page
A1 MS EXCEL TASK
Mc Donald’s
tabler-icon-diamond-filled.svg

Secure Best Marks with AI Grader

Need help grading? Try our AI Grader for instant feedback on your assignments.
Document Page
TABLE OF CONTENTS
Brief description of the data
Raw Data
Data Manipulation
Representation
Conclusion
References
Document Page
BRIEF DESCRIPTION OF THE DATA
Data analysis is about processing of the raw data as well as transforming it into the information which will
be used for decision making.
This presentation the raw data is regarding the profit and revenue of Mc Donald’s in millions from the year
2009-2021.
This data will show the performance of Mc Donald’s over the period of 13 years.
Further the presentation will show the manipulation of the data which gives it a meaning. For manipulation
various statistical techniques as well as auto sum feature has been used.
After the manipulation of data, the presentation will show the graphs and charts as well as which are based
on the statistical analysis as well as the auto sum feature.
Document Page
RAW DATA PRESENTATION
tabler-icon-diamond-filled.svg

Secure Best Marks with AI Grader

Need help grading? Try our AI Grader for instant feedback on your assignments.
Document Page
STATISTICAL TECHNIQUES
10480.76923076
9210621
Statistical Techniques for profit of the Mc
Donald's
Mean Mode Median
Document Page
STATISTICAL TECHNIQUES
24219.076923
0769
24075
Statistical Techniques for revenue of the Mc
Donald's
Mean Mode Median
Document Page
DATA MANIPULATION
$136,250
$10,481
$13
$12,580
$8,792
Auto Sum Features for profit of the Mc
Donald's
Sum Average Count Maximum Minimum
tabler-icon-diamond-filled.svg

Paraphrase This Document

Need a fresh take? Get an instant paraphrase of this document with our AI Paraphraser
Document Page
DATA MANIPULATION
$314,8
48
$24,21
9
$13
$28,10
6 $19,208
Auto Sum Features for revenue of the Mc
Donald's
Sum Average Count Maximum Minimum
Document Page
DATA MANIPULATION
2009 2010 2011 2012 2013 2014 2015 2016 2017 2018 2019 2020 2021
0.00%
1.00%
2.00%
3.00%
4.00%
5.00%
6.00%
7.00%
8.00%
9.00%
10.00%
6.45%
7.07%
7.84% 7.94% 8.00% 7.67%
7.18% 7.49% 7.80% 7.95% 8.20%
7.16%
9.23%
Percentage of Profit Earned by Mc Donald's from 2009-2021
Years
Percentage
Document Page
DATA MANIPULATION
2009 2010 2011 2012 2013 2014 2015 2016 2017 2018 2019 2020 2021
0.00%
1.00%
2.00%
3.00%
4.00%
5.00%
6.00%
7.00%
8.00%
9.00%
10.00%
7.22%
7.65%
8.58% 8.76% 8.93% 8.72%
8.07% 7.82%
7.25%
6.75% 6.79%
6.10%
7.38%
Percentage of Revenue of Mc Donald's from 2009-2021
Years
Percentage of revenue
tabler-icon-diamond-filled.svg

Secure Best Marks with AI Grader

Need help grading? Try our AI Grader for instant feedback on your assignments.
Document Page
REPRESENTATION
2009 2010 2011 2012 2013 2014 2015 2016 2017 2018 2019 2020 2021
$0
$2,000
$4,000
$6,000
$8,000
$10,000
$12,000
$14,000
$8,792
$9,637
$10,687 $10,816 $10,903
$10,456
$9,789 $10,205 $10,621 $10,833 $11,179
$9,752
$12,580
Profit earned by Mc Donald's from 2009-2021
Years
Amount of Profit Earned
Document Page
REPRESENTATION
2009 2010 2011 2012 2013 2014 2015 2016 2017 2018 2019 2020 2021
$0
$5,000
$10,000
$15,000
$20,000
$25,000
$30,000
$22,745
$24,075
$27,006 $27,567 $28,106 $27,441
$25,413 $24,622
$22,820
$21,258 $21,364
$19,208
$23,223
Revenue earned by Mc Donald's from 2009-2021
Years
Revenue in Millions
Document Page
CONCLUSION
It is concluded from the information and analysis that Mc Donald’s was facing various
fluctuation in their profit as well as revenue. But it improved after year 2020.
The presentation also concluded various statistical measurement tools & auto sum feature.
This presentation has also shown various graphs as well as chart of the data.
It also states the analysis and interpretation of all the tools used for converting the data.
tabler-icon-diamond-filled.svg

Paraphrase This Document

Need a fresh take? Get an instant paraphrase of this document with our AI Paraphraser
Document Page
REFERENCES
Scherbaum, C. and Shockley, K., 2019. Basic components of quantitative data analysis. Analysing
quantitative data for business and management students, pp.19-40.
Fabián, Z., 2021. Mean, mode or median? The score mean. Communications in Statistics-Theory and
Methods. 50(10). pp.2360-2370.
George, D. and Mallery, P., 2018. Descriptive statistics. In IBM SPSS Statistics 25 Step by Step (pp. 126-
134). Routledge.
Mendenhall, W., Beaver, R.J. and Beaver, B.M., 2020. Introduction to Probability and Statistics. Cengage.
Brahmia, Z., Hamrouni, H. and Bouaziz, R., 2020. XML data manipulation in conventional and temporal
XML databases: A survey. Computer Science Review. 36. p.100231.
Document Page
chevron_up_icon
1 out of 15
circle_padding
hide_on_mobile
zoom_out_icon
[object Object]