Analyzing McDonald's Financial Performance: A 2009-2021 Case Study

Verified

Added on  2023/06/11

|9
|1525
|267
Case Study
AI Summary
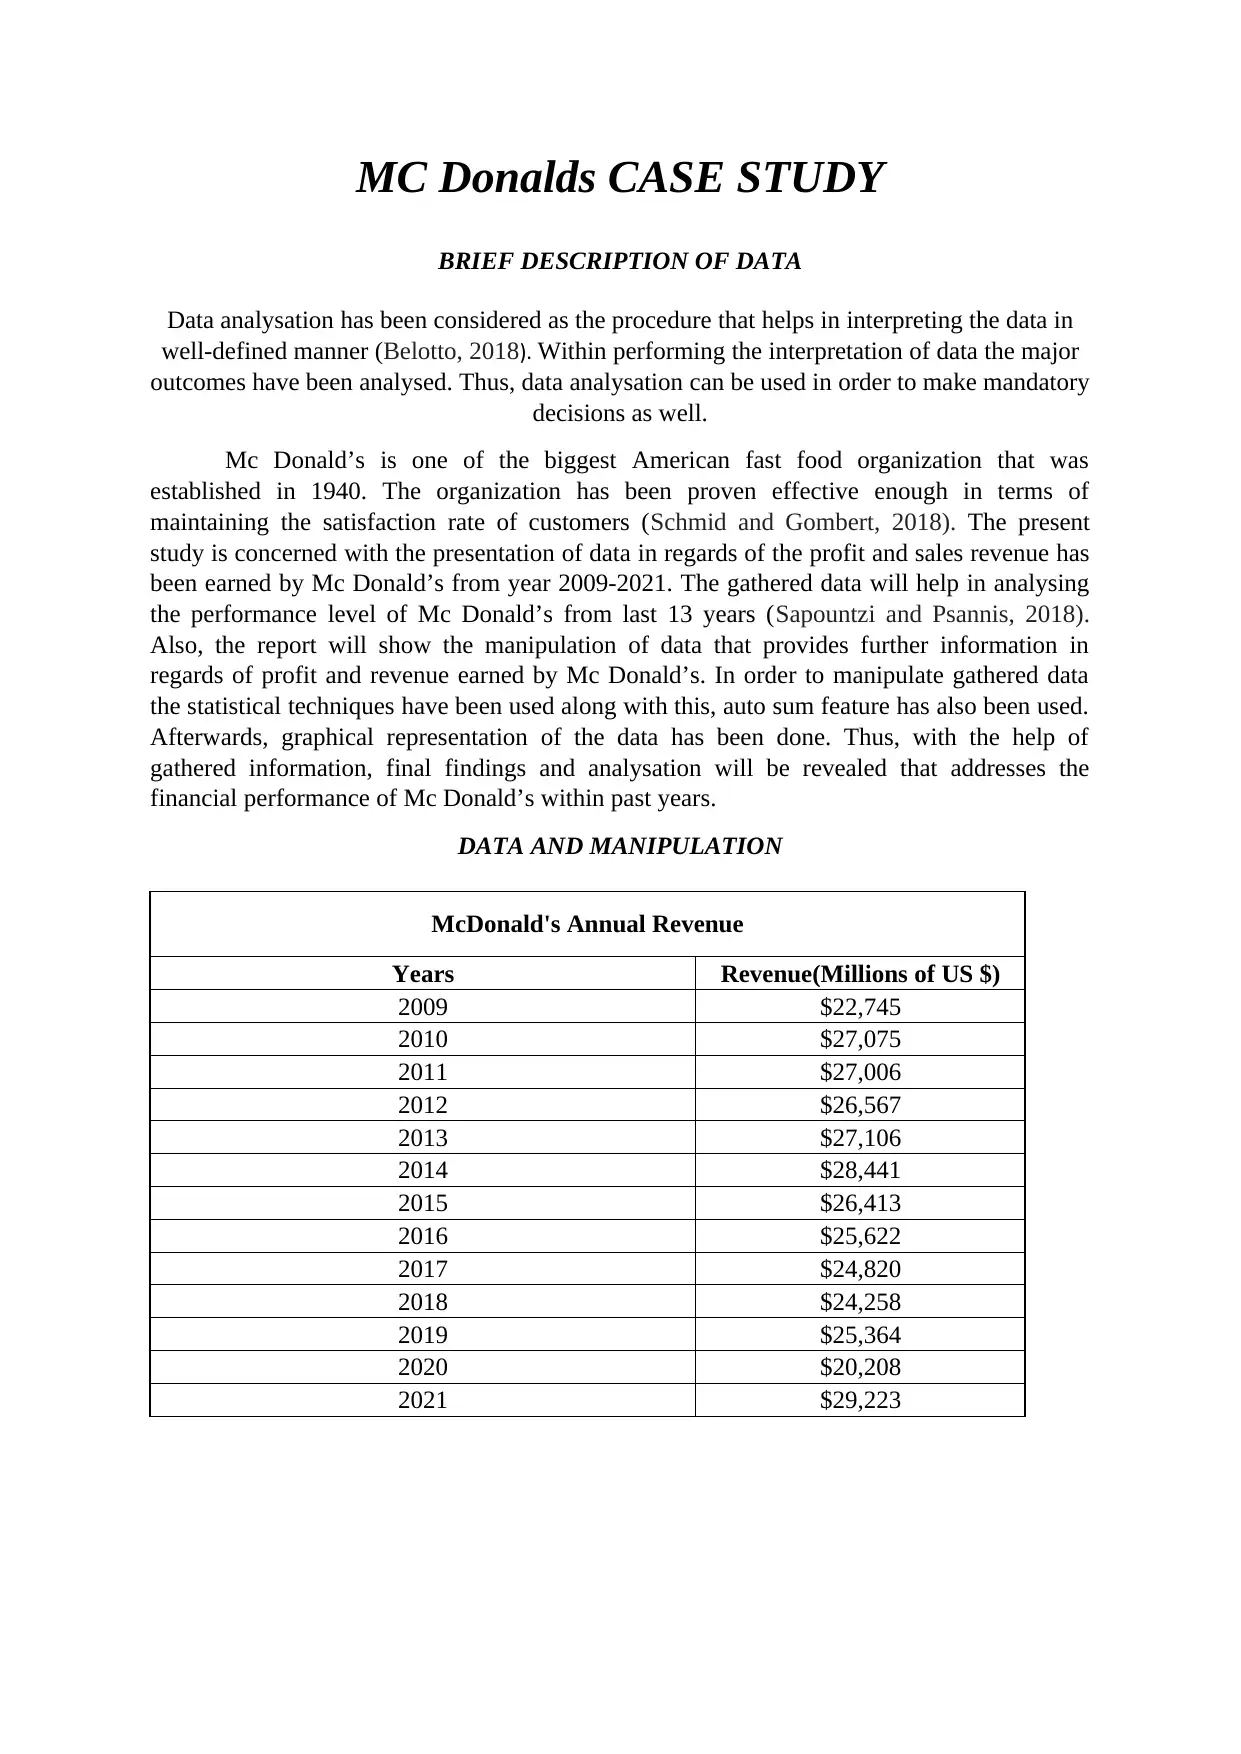
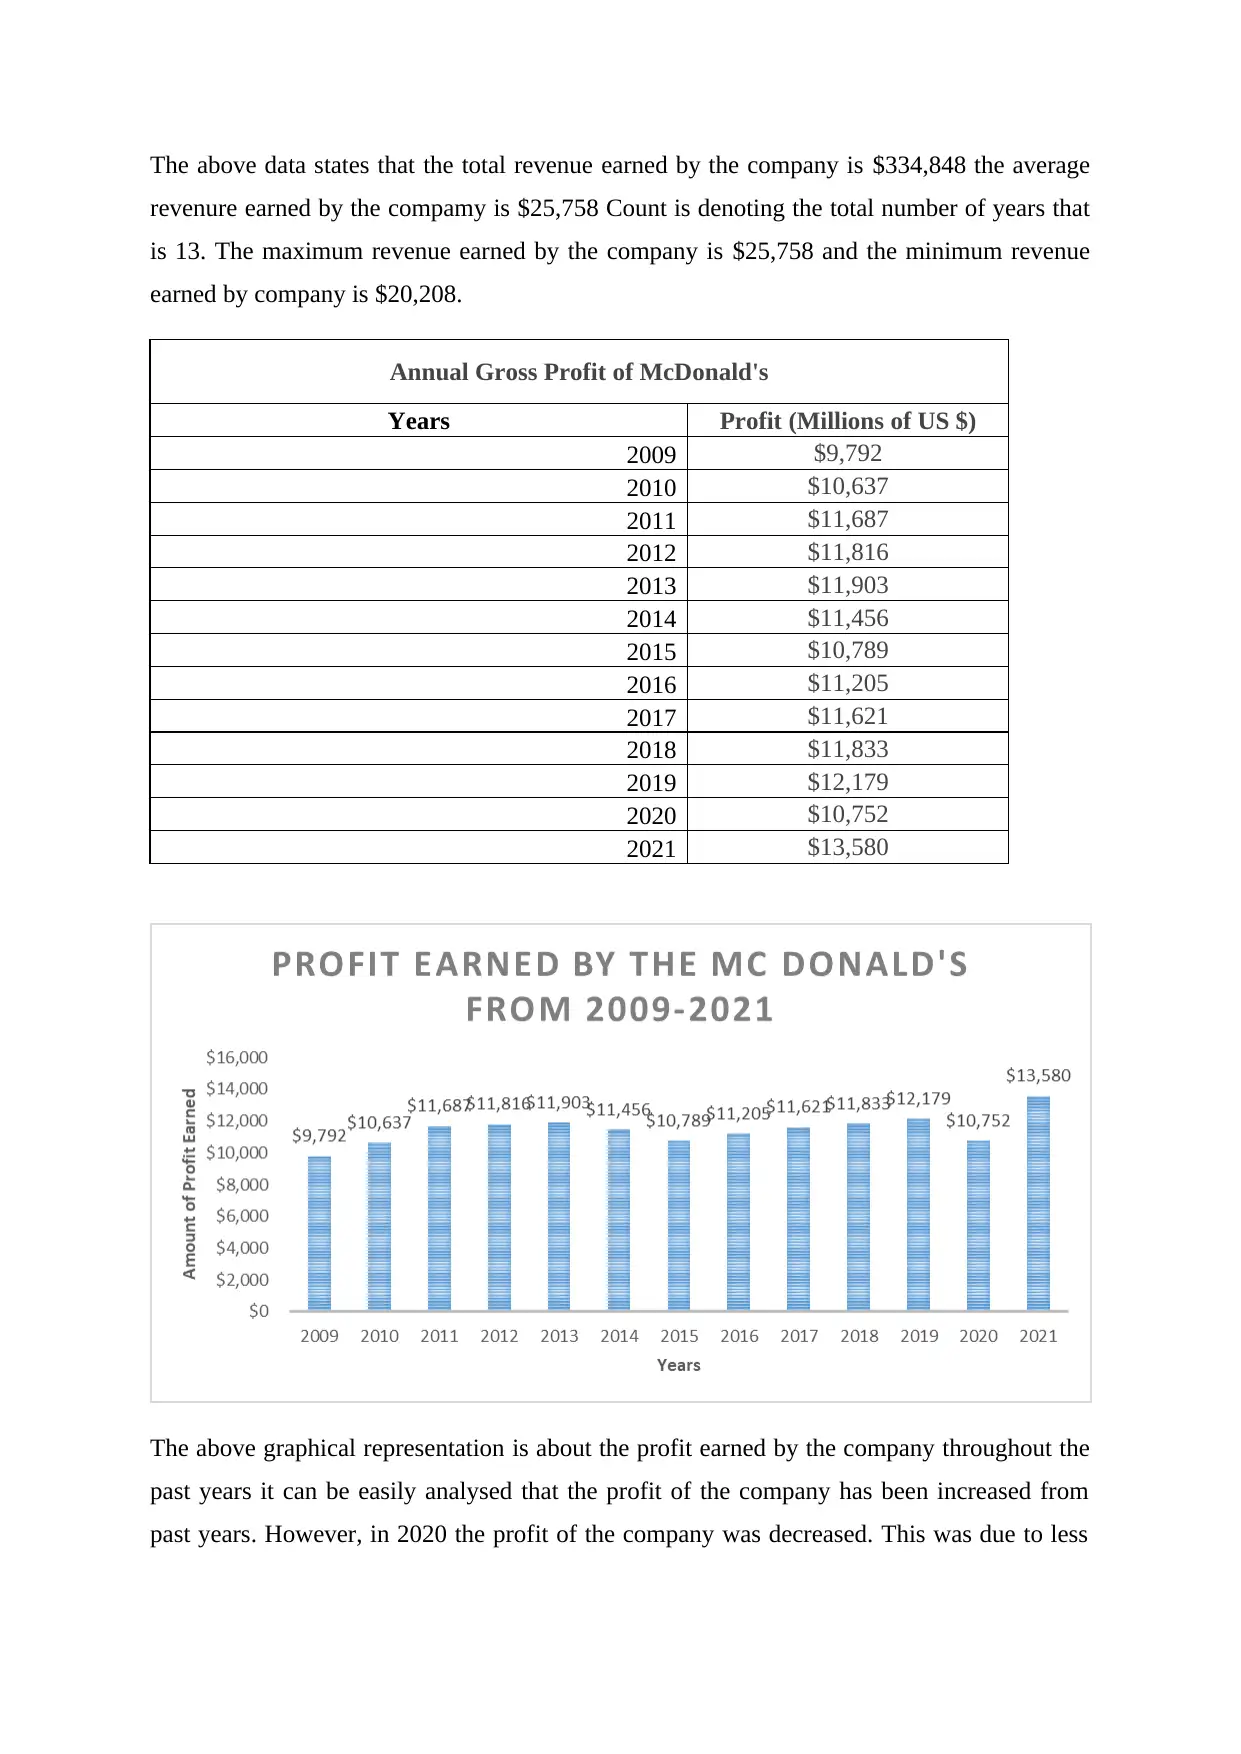
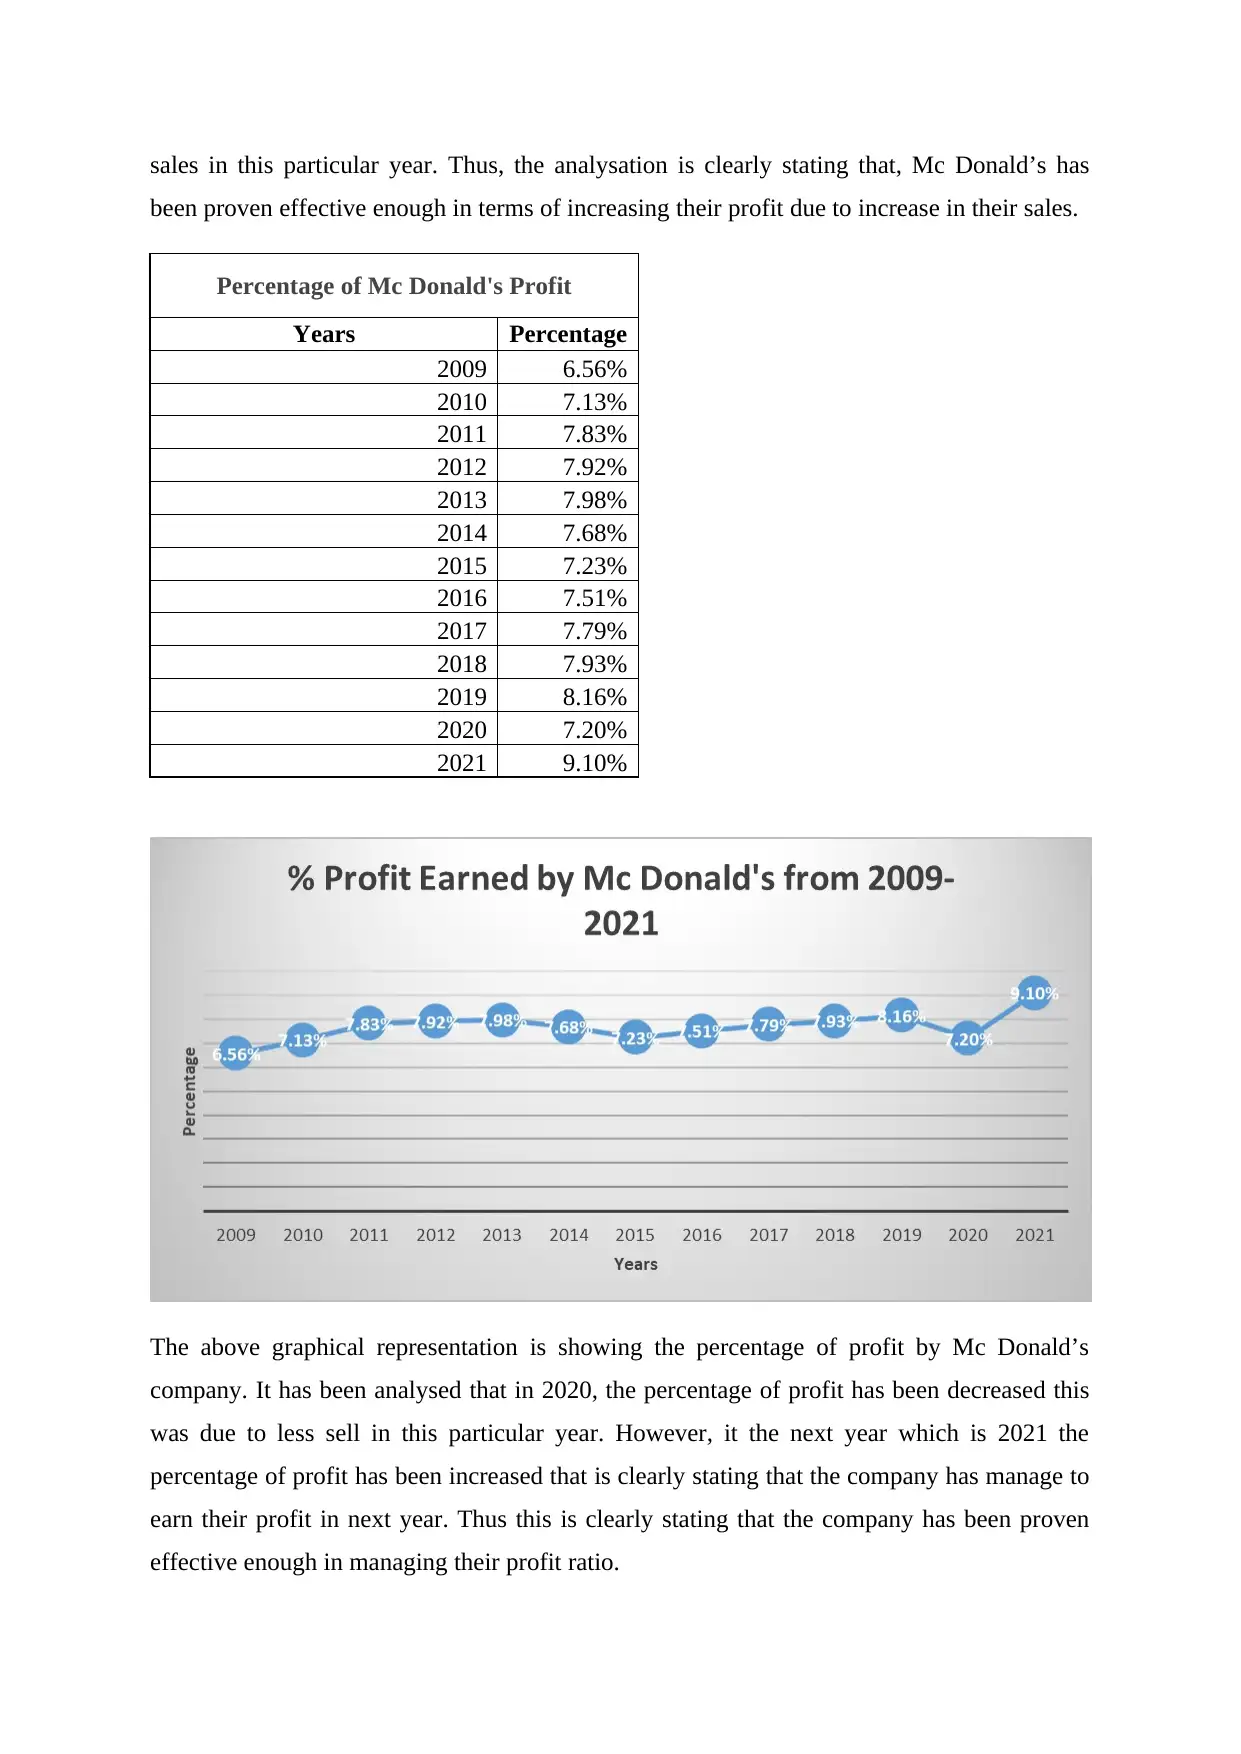
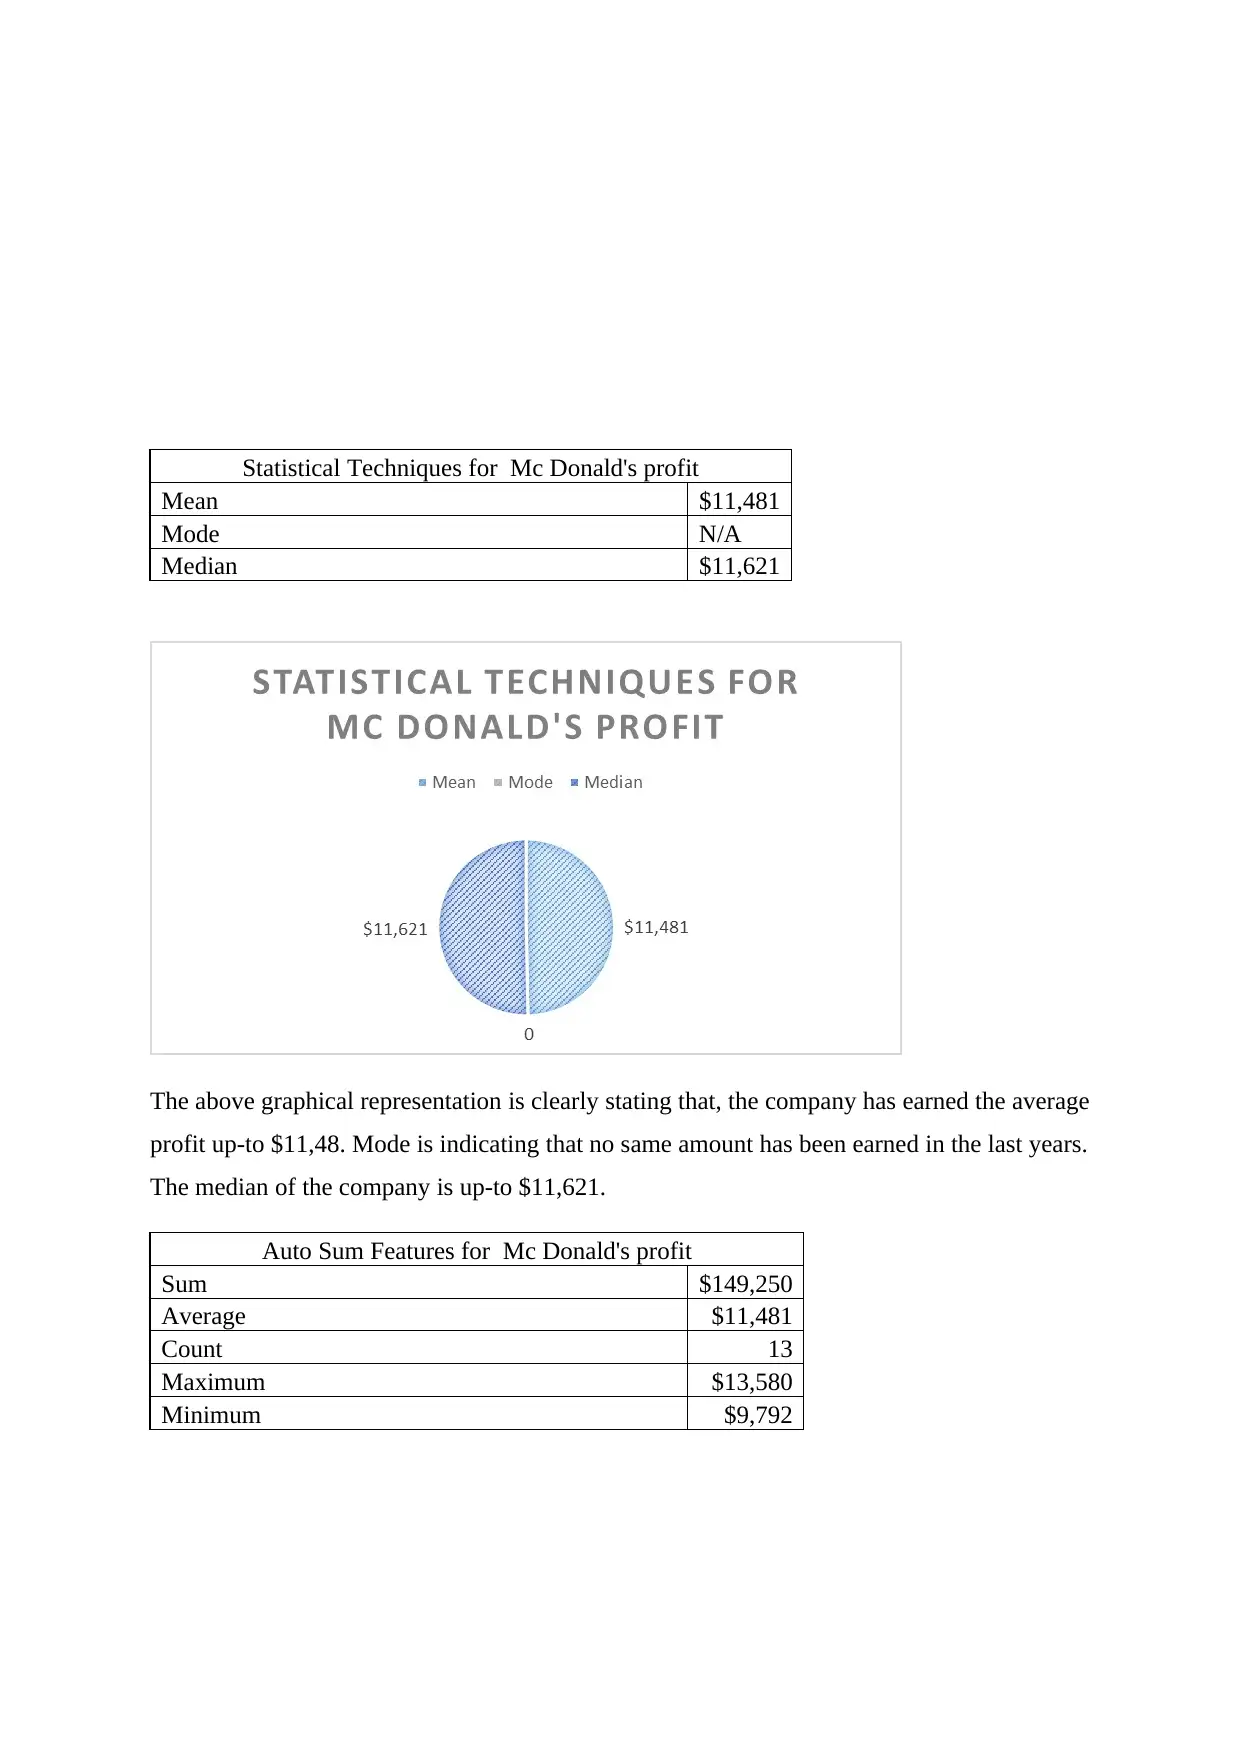
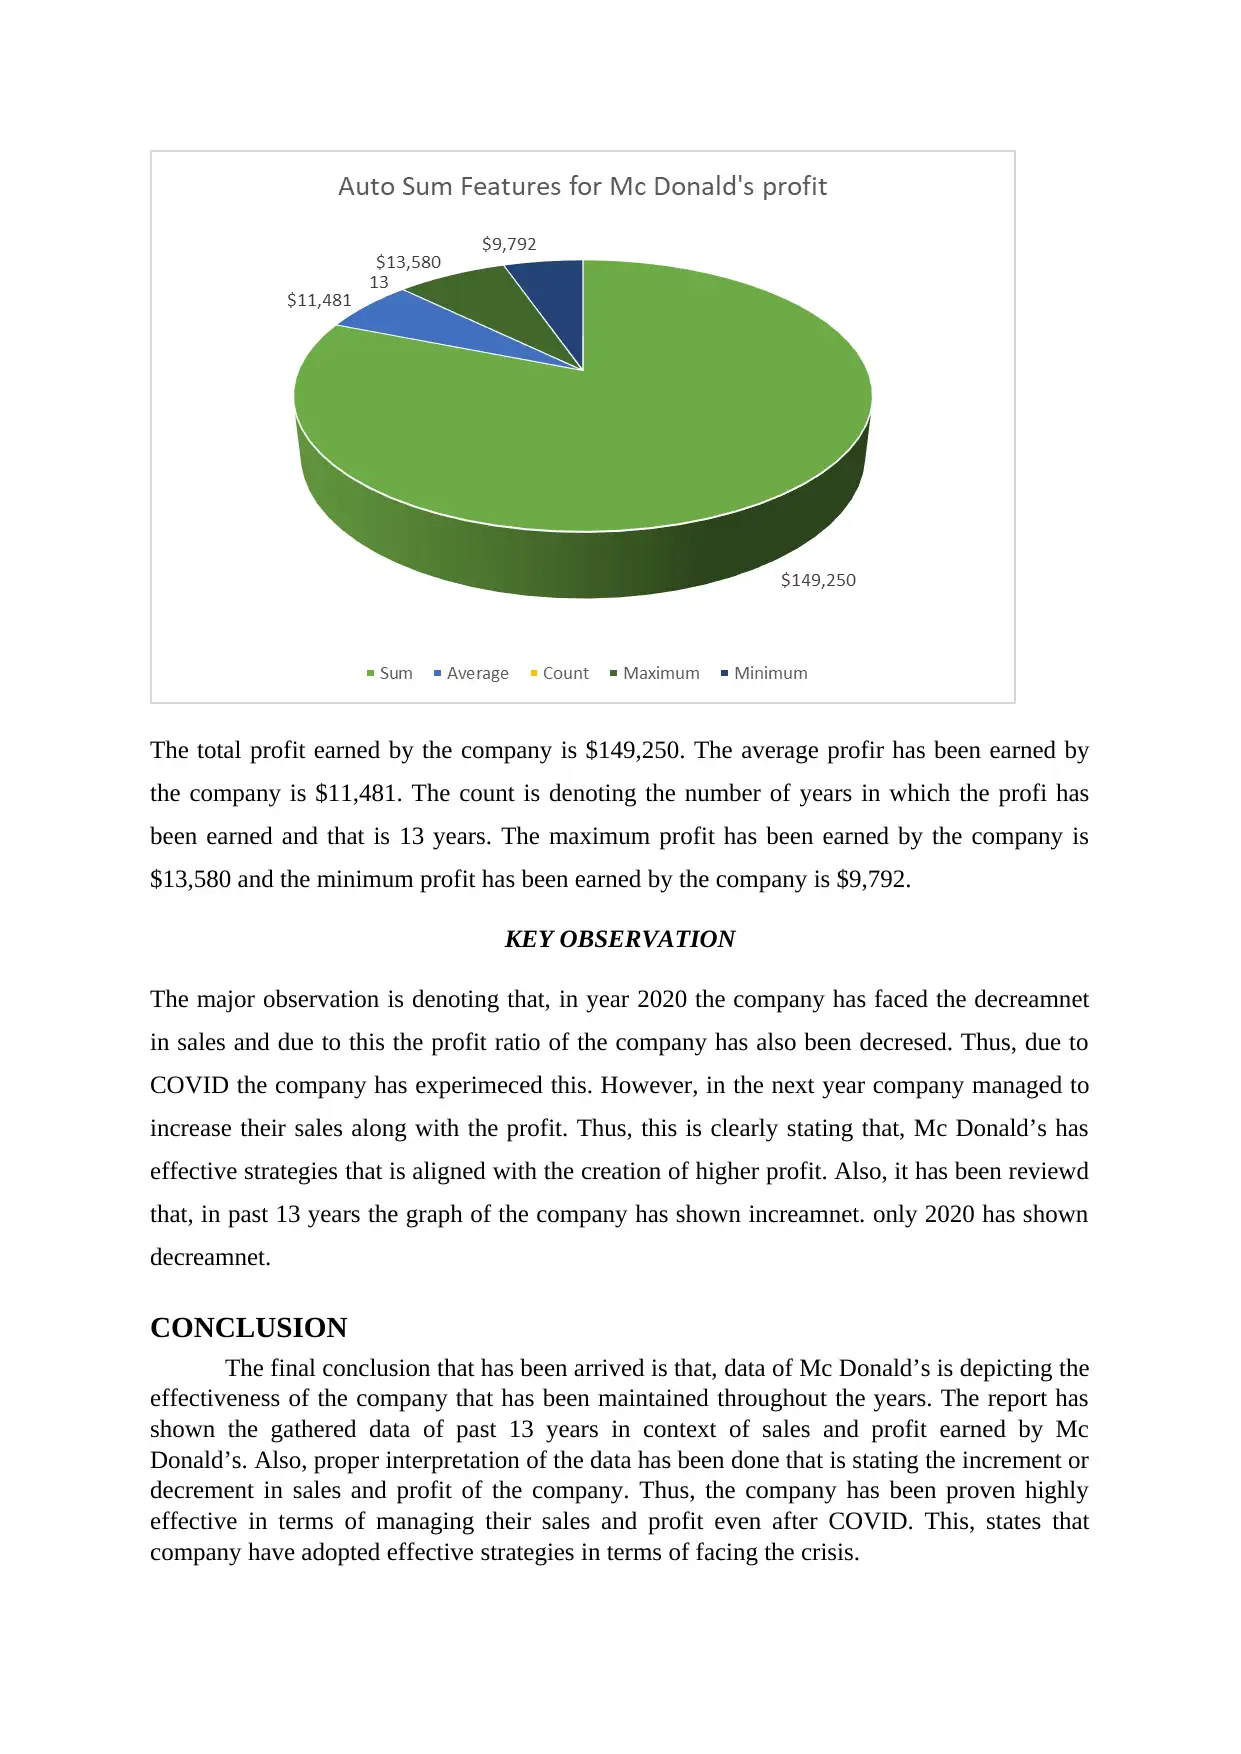
This case study analyzes McDonald's financial performance from 2009 to 2021, examining revenue and profit trends over the 13-year period. It presents data on annual revenue and gross profit, including percentage changes, and uses statistical techniques such as mean, mode, and median to provide insights into the company's financial health. The analysis reveals fluctuations in sales, with a notable decrease in 2020 due to COVID-19, followed by a recovery in 2021. Key observations highlight McDonald's ability to maintain profitability and adapt to challenges, demonstrating effective strategies for managing sales and profit ratios. The study concludes that McDonald's has demonstrated resilience and effectiveness in managing its financial performance, even in the face of economic disruptions, showcasing its robust business strategies.
Document Page
MC Donalds CASE STUDY
BRIEF DESCRIPTION OF DATA
Data analysation has been considered as the procedure that helps in interpreting the data in
well-defined manner (Belotto, 2018). Within performing the interpretation of data the major
outcomes have been analysed. Thus, data analysation can be used in order to make mandatory
decisions as well.
Mc Donald’s is one of the biggest American fast food organization that was
established in 1940. The organization has been proven effective enough in terms of
maintaining the satisfaction rate of customers (Schmid and Gombert, 2018). The present
study is concerned with the presentation of data in regards of the profit and sales revenue has
been earned by Mc Donald’s from year 2009-2021. The gathered data will help in analysing
the performance level of Mc Donald’s from last 13 years (Sapountzi and Psannis, 2018).
Also, the report will show the manipulation of data that provides further information in
regards of profit and revenue earned by Mc Donald’s. In order to manipulate gathered data
the statistical techniques have been used along with this, auto sum feature has also been used.
Afterwards, graphical representation of the data has been done. Thus, with the help of
gathered information, final findings and analysation will be revealed that addresses the
financial performance of Mc Donald’s within past years.
DATA AND MANIPULATION
McDonald's Annual Revenue
Years Revenue(Millions of US $)
2009 $22,745
2010 $27,075
2011 $27,006
2012 $26,567
2013 $27,106
2014 $28,441
2015 $26,413
2016 $25,622
2017 $24,820
2018 $24,258
2019 $25,364
2020 $20,208
2021 $29,223
tabler-icon-diamond-filled.svg

Paraphrase This Document

Need a fresh take? Get an instant paraphrase of this document with our AI Paraphraser
Document Page
The above graphical representation clearly states that, company has faced large number of
fluctuations in making their sales. However, the company has been proven effective enough
in terms of managing their sales from past years. It ca be clearly stated with the available data
that company has managed to increase their sales in effective manner. The rate of sales has
been increased up-to $29, 223 in 2021. Throughout the years, company has experience higher
sales. Thus, this is one of the major reason behind the success rate of MC Donald’s.
% of Mc Donald's Annual Revenue
Years Percentage
2009 6.79%
2010 8.09%
2011 8.07%
2012 7.93%
2013 8.10%
2014 8.49%
2015 7.89%
2016 7.65%
2017 7.41%
2018 7.24%
2019 7.57%
2020 6.03%
2021 8.73%
Document Page
The above graphical representation is clearly stating that, in year 2020 the sales of the
company has become down and it was due to COVID. However, in 2021, the company has
managed to increase the sales. Therefore, the increase in sales has been witnessed. Thus, the
company has managed their sales rate in effective manner. Due to COVID the sales got
affected. But, in 2021 again the company has managed to increase their sales. This
determines that the company has adopted effective sales strategy that is enabling firm to cop-
up with loses and often supporting in increasing their sales. Thus, the sales ratio of company
is effectively managed.
Statistical Techniques
Mean $25,758
Mode N/A
Median $26,413
Document Page
The above presentation states that average revenue that is earned by the company is up-to
$25,758. The mean elucidates the average rate. Thus, with the help of this the average sales
of the firm can be identified. The company has did not earned same rate in context of sales
from the past years this has been denoted by mode. The result of the median is stating that
company has earned $ 26,413 in context of sales revenue.
Auto Sum Features for Mc Donald's revenue
Sum $334,848
Average $25,758
Count 13
Maximum $29,223
Minimum $20,208
tabler-icon-diamond-filled.svg

Paraphrase This Document

Need a fresh take? Get an instant paraphrase of this document with our AI Paraphraser
Document Page
The above data states that the total revenue earned by the company is $334,848 the average
revenure earned by the compamy is $25,758 Count is denoting the total number of years that
is 13. The maximum revenue earned by the company is $25,758 and the minimum revenue
earned by company is $20,208.
Annual Gross Profit of McDonald's
Years Profit (Millions of US $)
2009 $9,792
2010 $10,637
2011 $11,687
2012 $11,816
2013 $11,903
2014 $11,456
2015 $10,789
2016 $11,205
2017 $11,621
2018 $11,833
2019 $12,179
2020 $10,752
2021 $13,580
The above graphical representation is about the profit earned by the company throughout the
past years it can be easily analysed that the profit of the company has been increased from
past years. However, in 2020 the profit of the company was decreased. This was due to less
Document Page
sales in this particular year. Thus, the analysation is clearly stating that, Mc Donald’s has
been proven effective enough in terms of increasing their profit due to increase in their sales.
Percentage of Mc Donald's Profit
Years Percentage
2009 6.56%
2010 7.13%
2011 7.83%
2012 7.92%
2013 7.98%
2014 7.68%
2015 7.23%
2016 7.51%
2017 7.79%
2018 7.93%
2019 8.16%
2020 7.20%
2021 9.10%
The above graphical representation is showing the percentage of profit by Mc Donald’s
company. It has been analysed that in 2020, the percentage of profit has been decreased this
was due to less sell in this particular year. However, it the next year which is 2021 the
percentage of profit has been increased that is clearly stating that the company has manage to
earn their profit in next year. Thus this is clearly stating that the company has been proven
effective enough in managing their profit ratio.
Document Page
Statistical Techniques for Mc Donald's profit
Mean $11,481
Mode N/A
Median $11,621
The above graphical representation is clearly stating that, the company has earned the average
profit up-to $11,48. Mode is indicating that no same amount has been earned in the last years.
The median of the company is up-to $11,621.
Auto Sum Features for Mc Donald's profit
Sum $149,250
Average $11,481
Count 13
Maximum $13,580
Minimum $9,792
tabler-icon-diamond-filled.svg

Paraphrase This Document

Need a fresh take? Get an instant paraphrase of this document with our AI Paraphraser
Document Page
The total profit earned by the company is $149,250. The average profir has been earned by
the company is $11,481. The count is denoting the number of years in which the profi has
been earned and that is 13 years. The maximum profit has been earned by the company is
$13,580 and the minimum profit has been earned by the company is $9,792.
KEY OBSERVATION
The major observation is denoting that, in year 2020 the company has faced the decreamnet
in sales and due to this the profit ratio of the company has also been decresed. Thus, due to
COVID the company has experimeced this. However, in the next year company managed to
increase their sales along with the profit. Thus, this is clearly stating that, Mc Donald’s has
effective strategies that is aligned with the creation of higher profit. Also, it has been reviewd
that, in past 13 years the graph of the company has shown increamnet. only 2020 has shown
decreamnet.
CONCLUSION
The final conclusion that has been arrived is that, data of Mc Donald’s is depicting the
effectiveness of the company that has been maintained throughout the years. The report has
shown the gathered data of past 13 years in context of sales and profit earned by Mc
Donald’s. Also, proper interpretation of the data has been done that is stating the increment or
decrement in sales and profit of the company. Thus, the company has been proven highly
effective in terms of managing their sales and profit even after COVID. This, states that
company have adopted effective strategies in terms of facing the crisis.
Document Page
REFERENCES
Belotto, M.J., 2018. Data analysis methods for qualitative research: Managing the challenges
of coding, interrater reliability, and thematic analysis. Qualitative Report, 23(11).
Sapountzi, A. and Psannis, K.E., 2018. Social networking data analysis tools & challenges.
Future Generation Computer Systems, 86, pp.893-913.
Schmid, S. and Gombert, A., 2018. McDonald’s: Is the fast food icon reaching the limits of
growth?. In Internationalization of Business (pp. 155-171). Springer, Cham.
chevron_up_icon
1 out of 9
circle_padding
hide_on_mobile
zoom_out_icon
[object Object]