McDonald's Business Performance: An Analysis of Technology Impact
VerifiedAdded on 2023/06/12
|14
|2286
|390
Report
AI Summary
This report investigates the impact of technology on McDonald's business performance and productivity from 2011 to 2021. It uses statistical techniques and Excel AutoSum features to analyze data related to market capitalization, revenue, expenses, and gross profit. The analysis includes calculating percentages, determining sum, mean, median, minimum, and maximum values, and presenting the data in various charts and tables. Key findings indicate that technology has played a vital role in enhancing McDonald's productivity, market capitalization, and overall business performance. The report concludes that adopting technology is crucial for businesses to gain a competitive edge and improve their financial metrics by optimizing resource utilization and decision-making.
DHICT Assessment
Paraphrase This Document
Need a fresh take? Get an instant paraphrase of this document with our AI Paraphraser
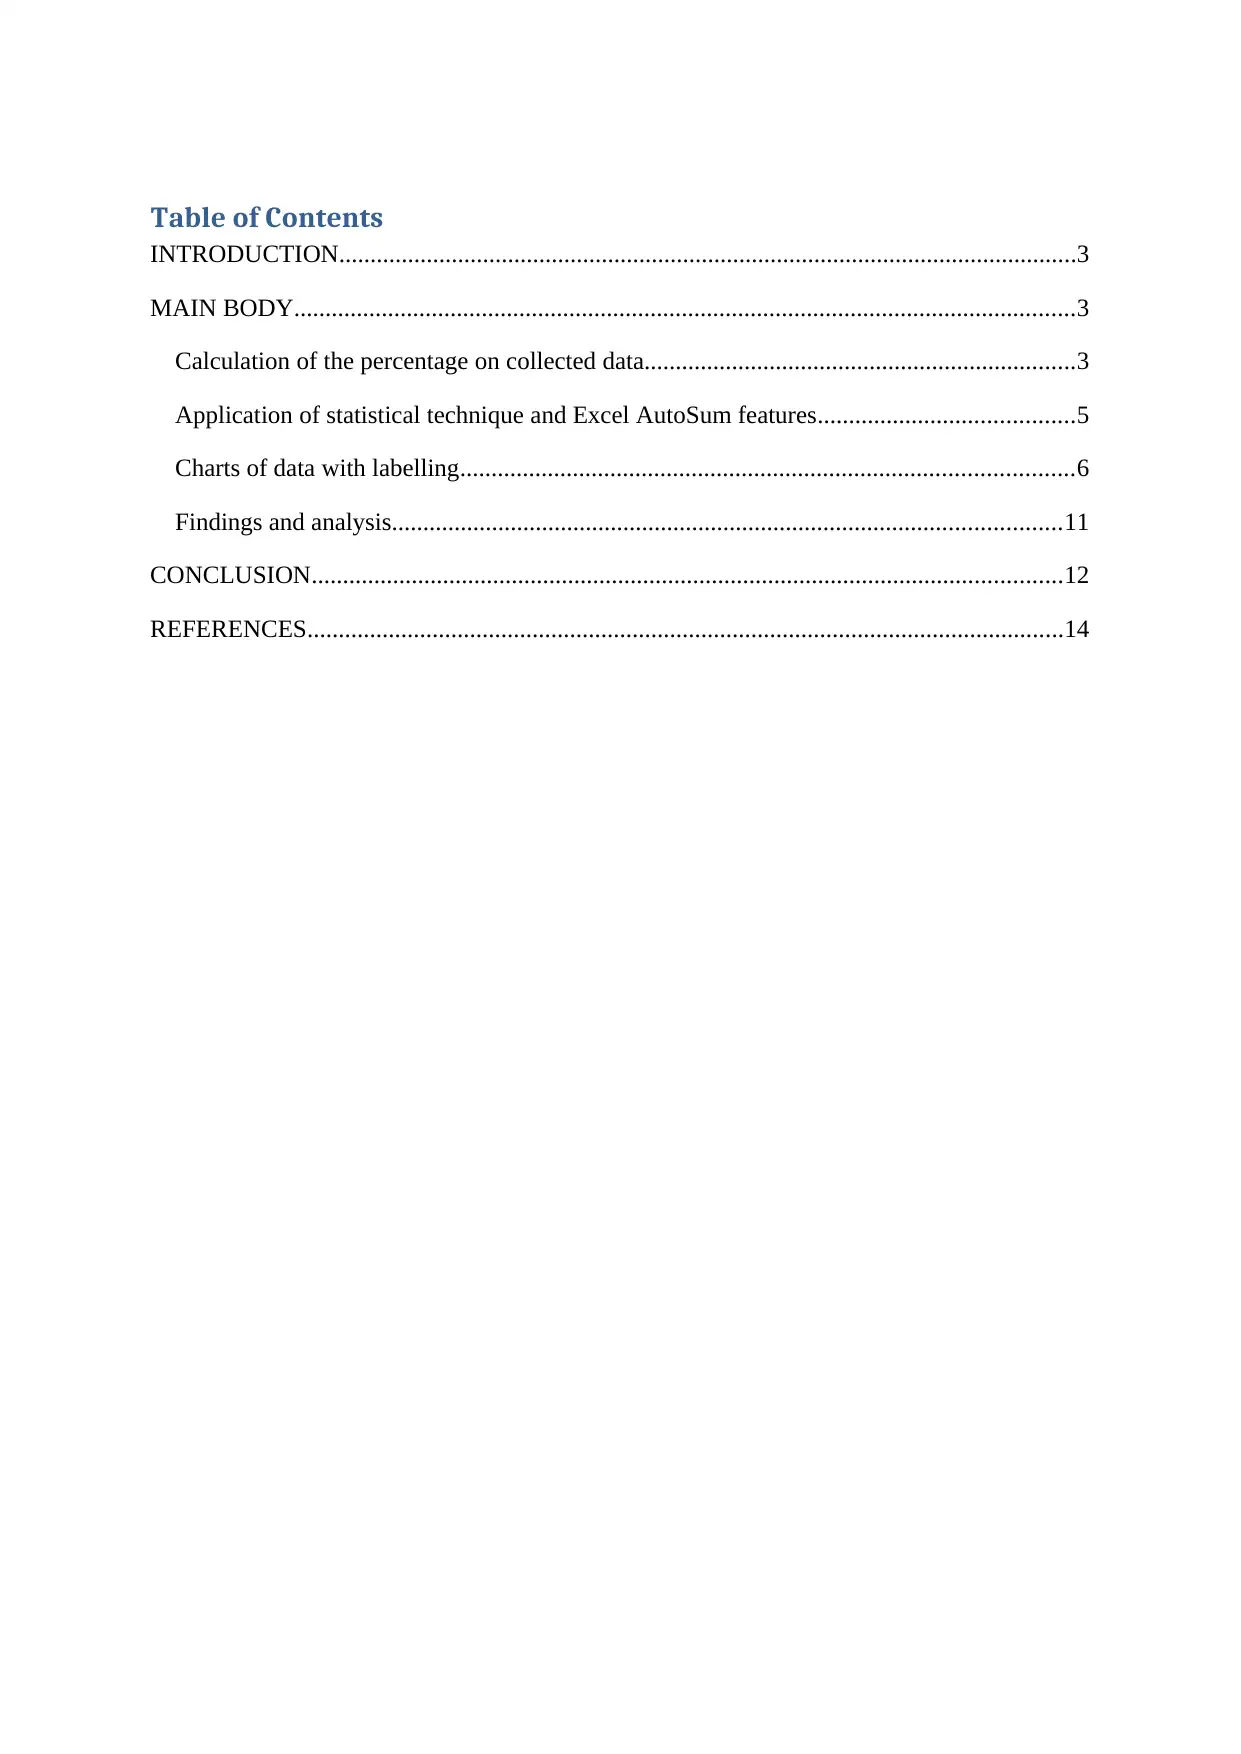
Table of Contents
INTRODUCTION......................................................................................................................3
MAIN BODY.............................................................................................................................3
Calculation of the percentage on collected data.....................................................................3
Application of statistical technique and Excel AutoSum features.........................................5
Charts of data with labelling..................................................................................................6
Findings and analysis...........................................................................................................11
CONCLUSION........................................................................................................................12
REFERENCES.........................................................................................................................14
INTRODUCTION
In recent time competition in the market is so high that to gain competitive advantage
it is very important for the companies to adopt technology in order to improve their business
performance and productivity. Technology has changed the life of every business with the
adoption of advance technology in organisational functioning business are conduct in smooth
manner. Technology has become integral part of the businesses without which business
cannot be run in smooth manner in current time. In organisation context technology plays an
important role and the concept cannot be understated (Yunis, Tarhini and Kassar, 2018).
Many huge as well as medium companies are rely on the digital technology to improve their
businesses performance. Technology not only helps in improving performance but also assist
in accumulating various task, work and workers all together. Today no business can work
without internet, project management, digital software and many more. There are various
advantage that can be get to the business with the help of technology some of them are proper
communication system, proper security, efficiency in works, employee engagement and
many more (Chuang and Huang, 2018). It also helps in saving time and money of the
organisation by taking right decision and right time. For knowing the importance of
technology on organisational performance and productivity the chosen company is
McDonalds.
This report will gather data gathering statistical data so that central tendency can be
calculated as well as other function will also be applied. Data is collected from the officially
website of McDonalds in order to obtained information about market capitalisation, revenue,
expense and gross profit of McDonalds the data will be gathered from the year 2011 to 2021.
MAIN BODY
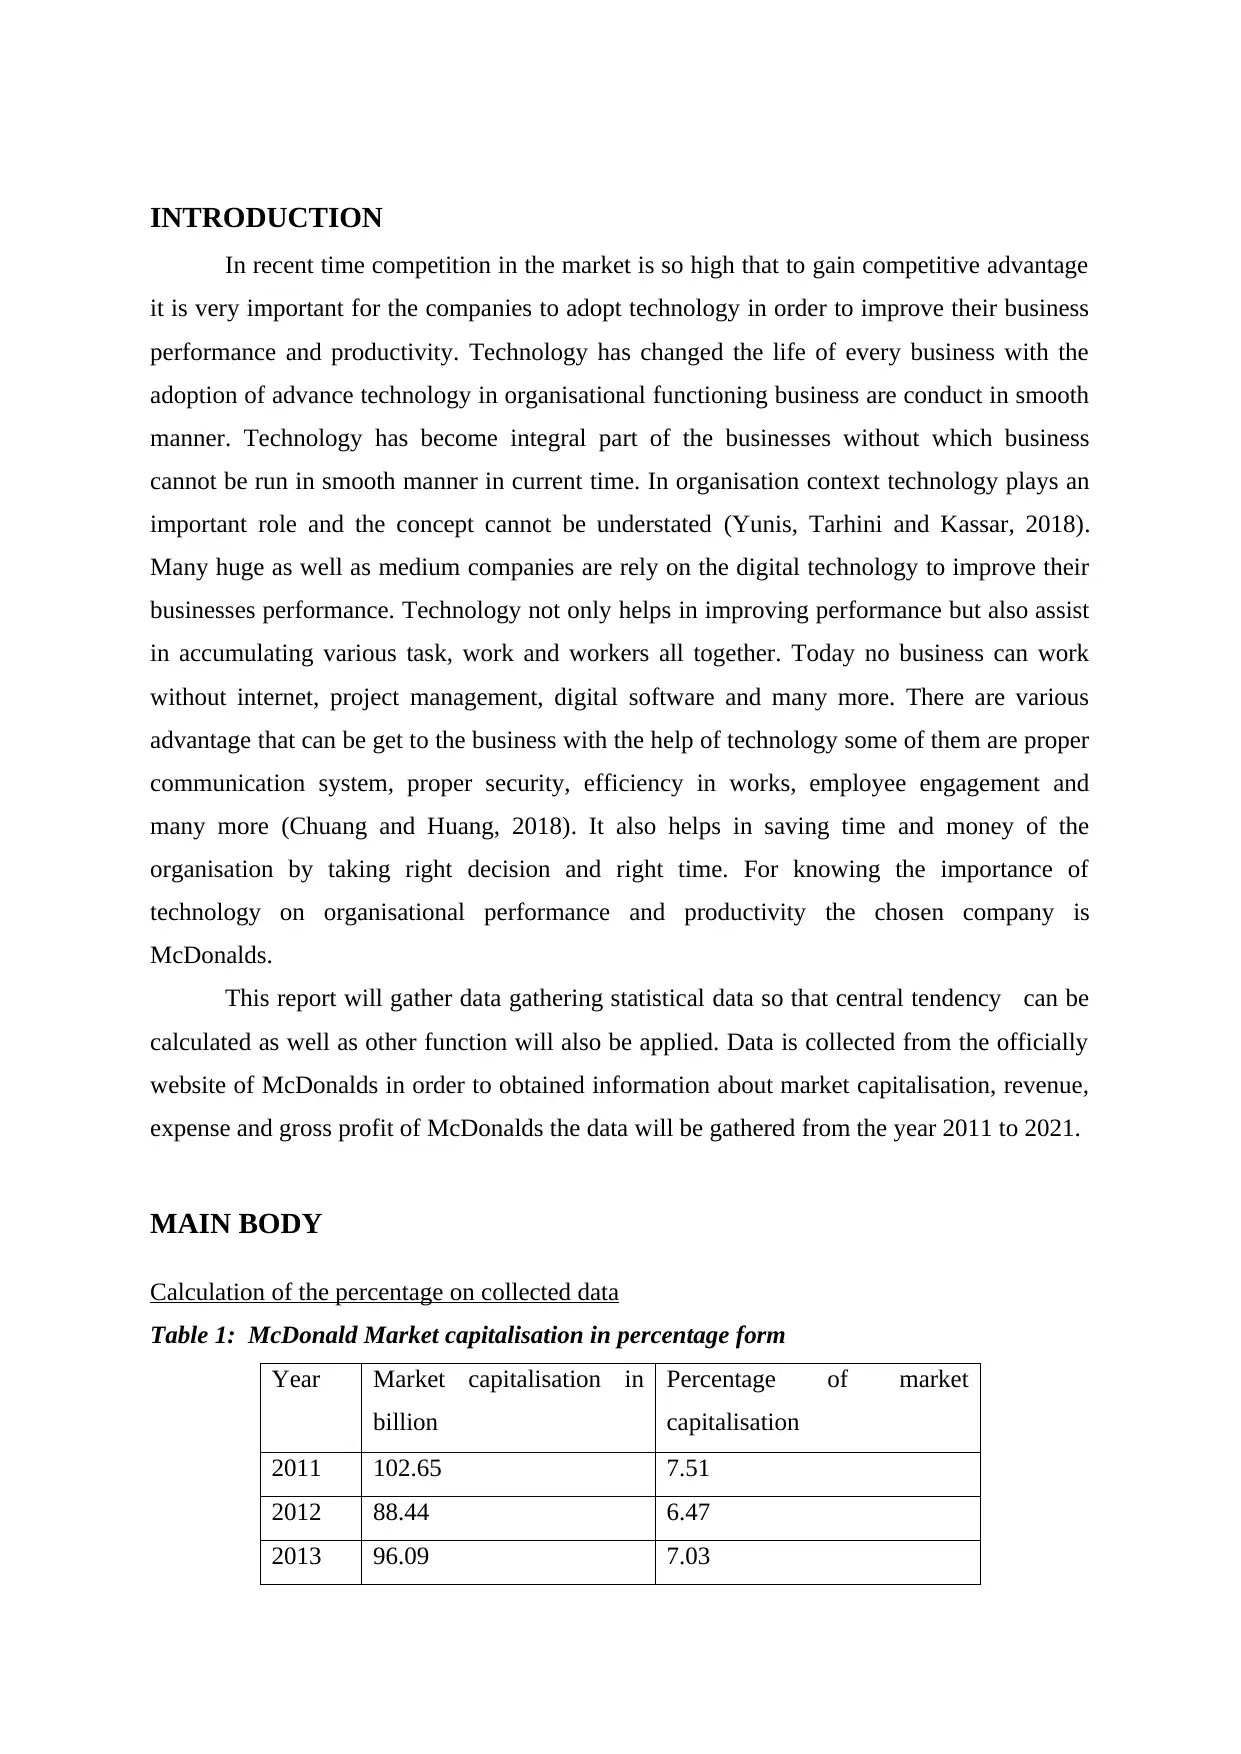
Calculation of the percentage on collected data
Table 1: McDonald Market capitalisation in percentage form
Year Market capitalisation in
billion
Percentage of market
capitalisation
2011 102.65 7.51
2012 88.44 6.47
2013 96.09 7.03
In recent time competition in the market is so high that to gain competitive advantage
it is very important for the companies to adopt technology in order to improve their business
performance and productivity. Technology has changed the life of every business with the
adoption of advance technology in organisational functioning business are conduct in smooth
manner. Technology has become integral part of the businesses without which business
cannot be run in smooth manner in current time. In organisation context technology plays an
important role and the concept cannot be understated (Yunis, Tarhini and Kassar, 2018).
Many huge as well as medium companies are rely on the digital technology to improve their
businesses performance. Technology not only helps in improving performance but also assist
in accumulating various task, work and workers all together. Today no business can work
without internet, project management, digital software and many more. There are various
advantage that can be get to the business with the help of technology some of them are proper
communication system, proper security, efficiency in works, employee engagement and
many more (Chuang and Huang, 2018). It also helps in saving time and money of the
organisation by taking right decision and right time. For knowing the importance of
technology on organisational performance and productivity the chosen company is
McDonalds.
This report will gather data gathering statistical data so that central tendency can be
calculated as well as other function will also be applied. Data is collected from the officially
website of McDonalds in order to obtained information about market capitalisation, revenue,
expense and gross profit of McDonalds the data will be gathered from the year 2011 to 2021.
MAIN BODY
Calculation of the percentage on collected data
Table 1: McDonald Market capitalisation in percentage form
Year Market capitalisation in
billion
Percentage of market
capitalisation
2011 102.65 7.51
2012 88.44 6.47
2013 96.09 7.03
⊘ This is a preview!⊘
Do you want full access?
Subscribe today to unlock all pages.
Trusted by 1+ million students worldwide
2014 90.22 6.60
2015 107.12 7.84
2016 101.08 7.40
2017 137.21 10.04
2018 136.21 9.97
2019 147.47 10.79
2020 159.88 11.70
2021 200.31 14.66
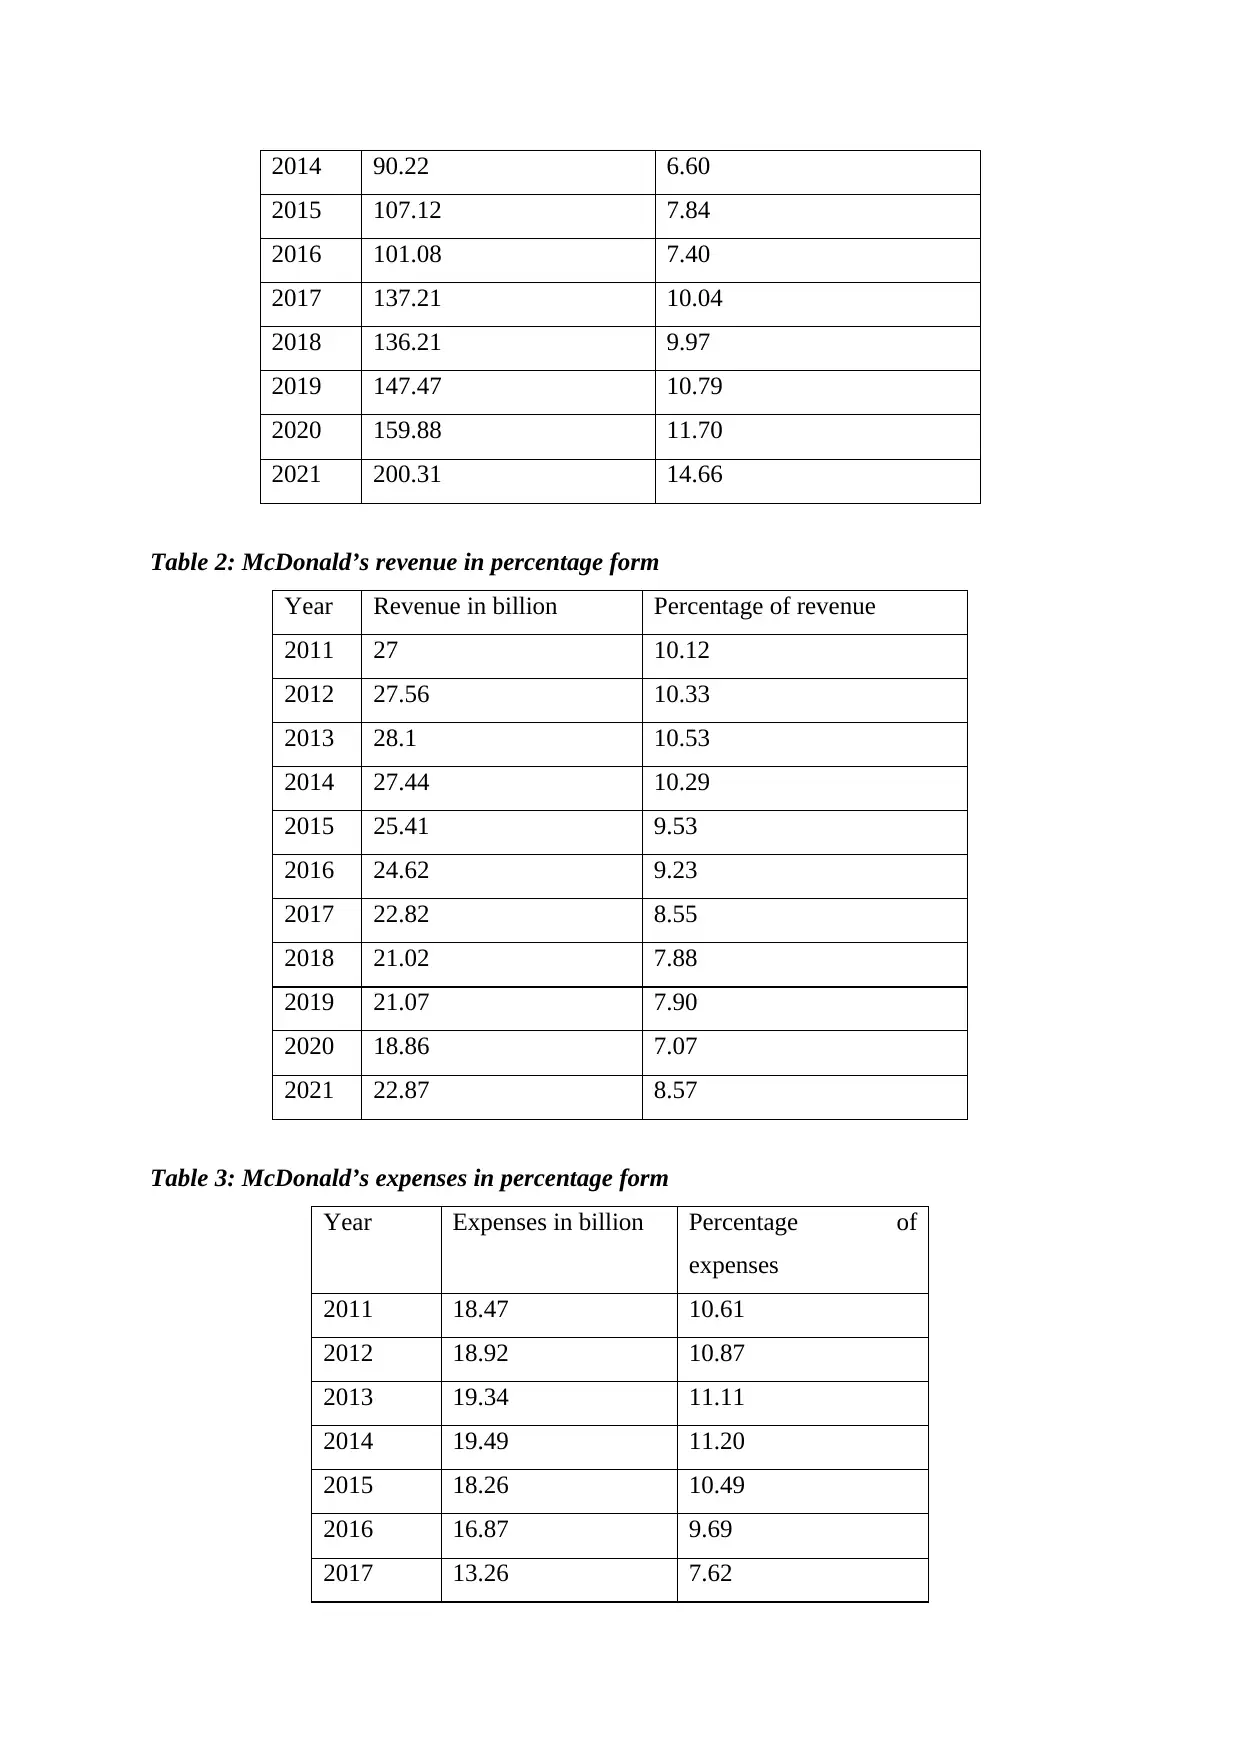
Table 2: McDonald’s revenue in percentage form
Year Revenue in billion Percentage of revenue
2011 27 10.12
2012 27.56 10.33
2013 28.1 10.53
2014 27.44 10.29
2015 25.41 9.53
2016 24.62 9.23
2017 22.82 8.55
2018 21.02 7.88
2019 21.07 7.90
2020 18.86 7.07
2021 22.87 8.57
Table 3: McDonald’s expenses in percentage form
Year Expenses in billion Percentage of
expenses
2011 18.47 10.61
2012 18.92 10.87
2013 19.34 11.11
2014 19.49 11.20
2015 18.26 10.49
2016 16.87 9.69
2017 13.26 7.62
2015 107.12 7.84
2016 101.08 7.40
2017 137.21 10.04
2018 136.21 9.97
2019 147.47 10.79
2020 159.88 11.70
2021 200.31 14.66
Table 2: McDonald’s revenue in percentage form
Year Revenue in billion Percentage of revenue
2011 27 10.12
2012 27.56 10.33
2013 28.1 10.53
2014 27.44 10.29
2015 25.41 9.53
2016 24.62 9.23
2017 22.82 8.55
2018 21.02 7.88
2019 21.07 7.90
2020 18.86 7.07
2021 22.87 8.57
Table 3: McDonald’s expenses in percentage form
Year Expenses in billion Percentage of
expenses
2011 18.47 10.61
2012 18.92 10.87
2013 19.34 11.11
2014 19.49 11.20
2015 18.26 10.49
2016 16.87 9.69
2017 13.26 7.62
Paraphrase This Document
Need a fresh take? Get an instant paraphrase of this document with our AI Paraphraser
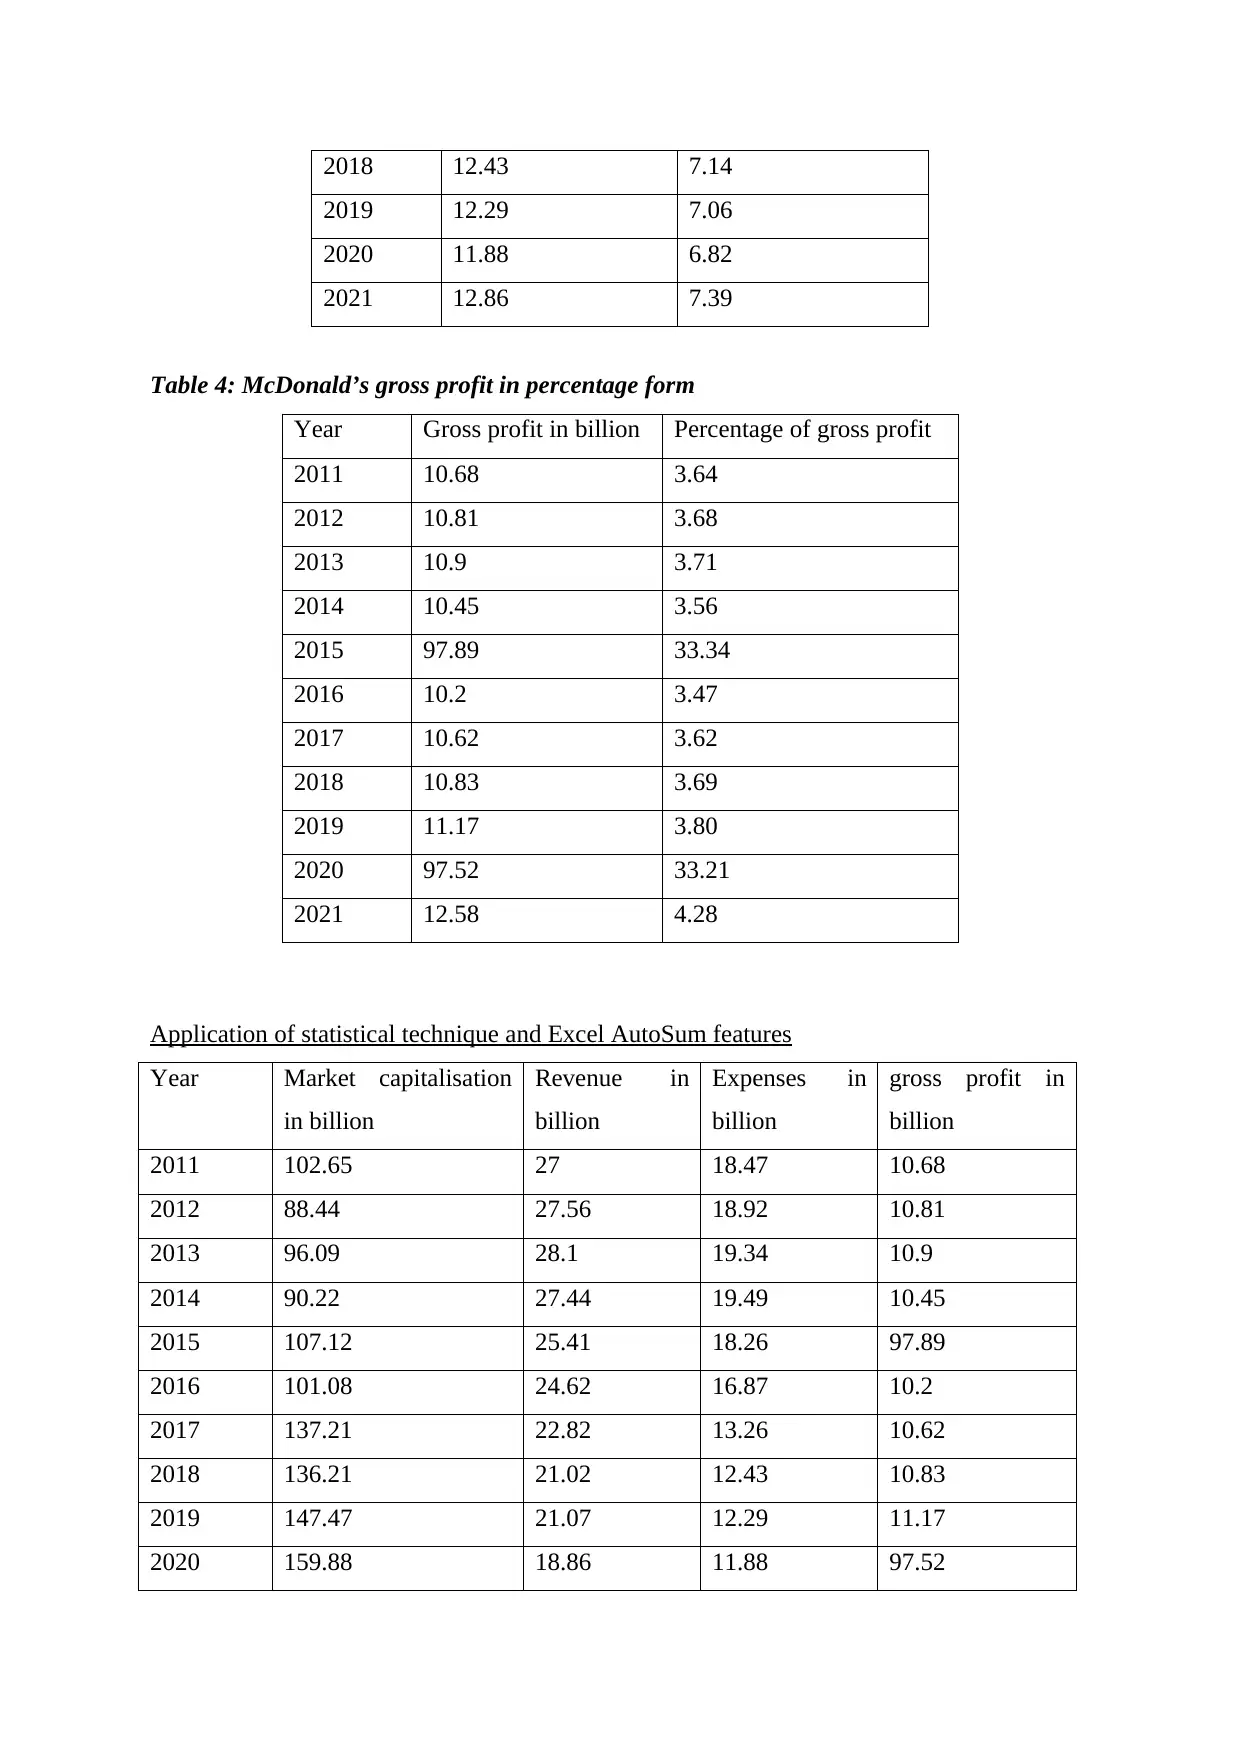
2018 12.43 7.14
2019 12.29 7.06
2020 11.88 6.82
2021 12.86 7.39
Table 4: McDonald’s gross profit in percentage form
Year Gross profit in billion Percentage of gross profit
2011 10.68 3.64
2012 10.81 3.68
2013 10.9 3.71
2014 10.45 3.56
2015 97.89 33.34
2016 10.2 3.47
2017 10.62 3.62
2018 10.83 3.69
2019 11.17 3.80
2020 97.52 33.21
2021 12.58 4.28
Application of statistical technique and Excel AutoSum features
Year Market capitalisation
in billion
Revenue in
billion
Expenses in
billion
gross profit in
billion
2011 102.65 27 18.47 10.68
2012 88.44 27.56 18.92 10.81
2013 96.09 28.1 19.34 10.9
2014 90.22 27.44 19.49 10.45
2015 107.12 25.41 18.26 97.89
2016 101.08 24.62 16.87 10.2
2017 137.21 22.82 13.26 10.62
2018 136.21 21.02 12.43 10.83
2019 147.47 21.07 12.29 11.17
2020 159.88 18.86 11.88 97.52
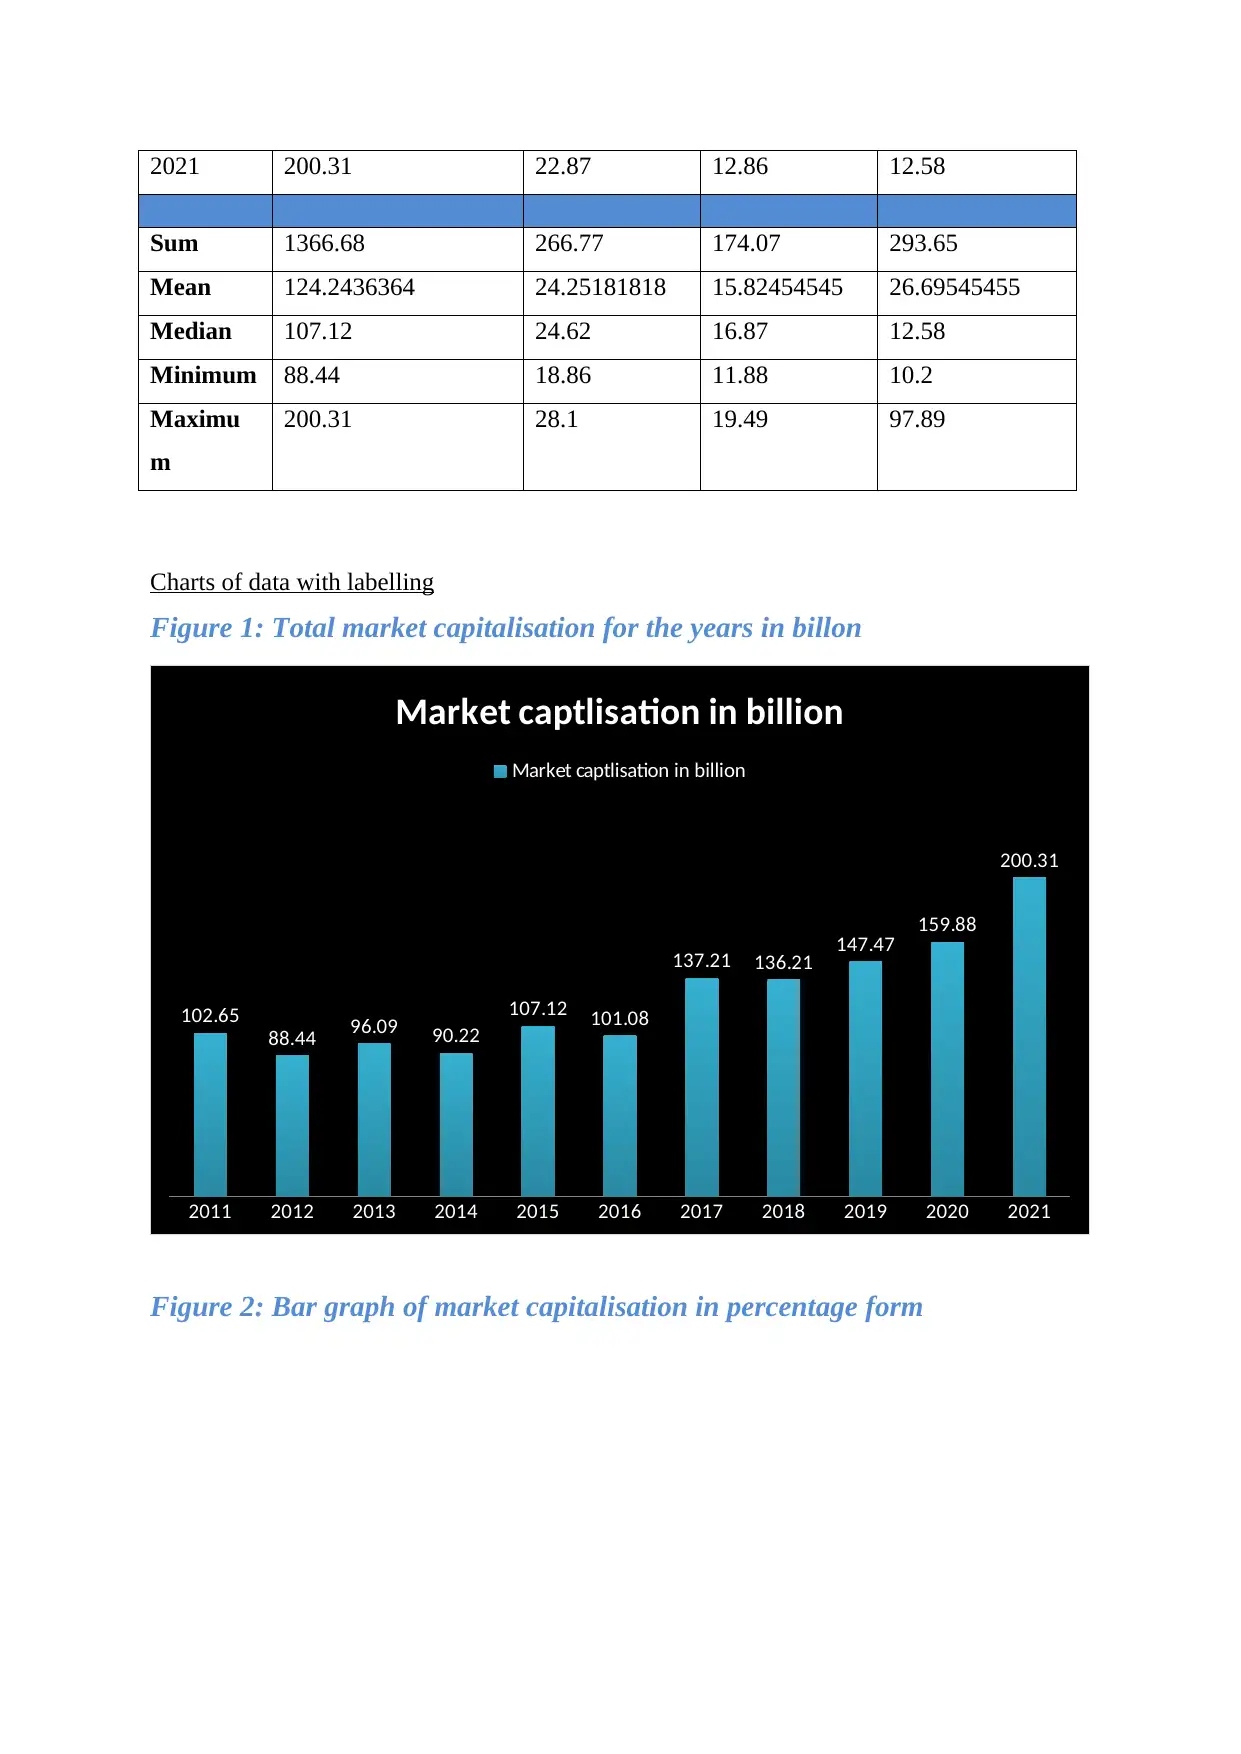
2021 200.31 22.87 12.86 12.58
Sum 1366.68 266.77 174.07 293.65
Mean 124.2436364 24.25181818 15.82454545 26.69545455
Median 107.12 24.62 16.87 12.58
Minimum 88.44 18.86 11.88 10.2
Maximu
m
200.31 28.1 19.49 97.89
Charts of data with labelling
Figure 1: Total market capitalisation for the years in billon
2011 2012 2013 2014 2015 2016 2017 2018 2019 2020 2021
102.65
88.44 96.09 90.22
107.12 101.08
137.21 136.21 147.47 159.88
200.31
Market captlisation in billion
Market captlisation in billion
Figure 2: Bar graph of market capitalisation in percentage form
⊘ This is a preview!⊘
Do you want full access?
Subscribe today to unlock all pages.
Trusted by 1+ million students worldwide
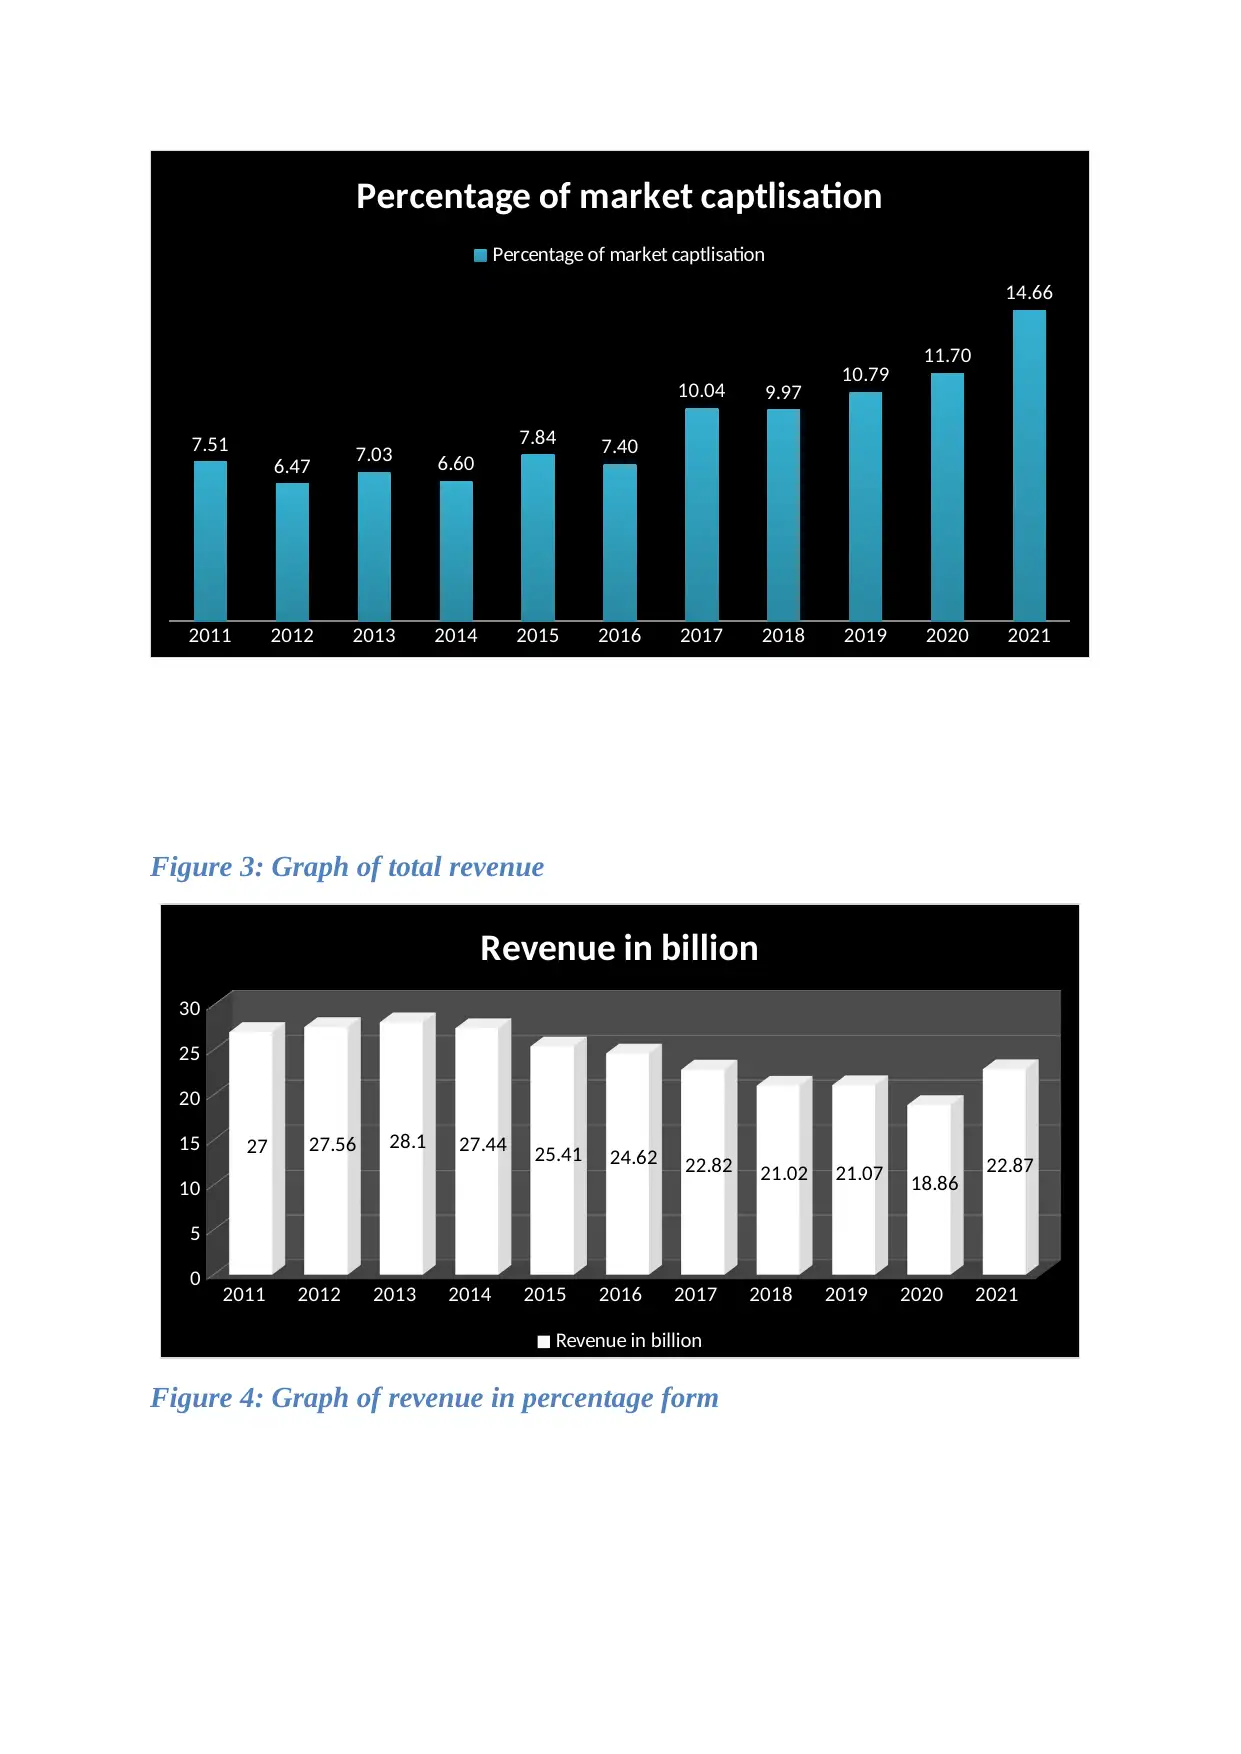
2011 2012 2013 2014 2015 2016 2017 2018 2019 2020 2021
7.51
6.47 7.03 6.60
7.84 7.40
10.04 9.97 10.79 11.70
14.66
Percentage of market captlisation
Percentage of market captlisation
Figure 3: Graph of total revenue
2011 2012 2013 2014 2015 2016 2017 2018 2019 2020 2021
0
5
10
15
20
25
30
27 27.56 28.1 27.44 25.41 24.62 22.82 21.02 21.07 18.86 22.87
Revenue in billion
Revenue in billion
Figure 4: Graph of revenue in percentage form
Paraphrase This Document
Need a fresh take? Get an instant paraphrase of this document with our AI Paraphraser

2011 2012 2013 2014 2015 2016 2017 2018 2019 2020 2021
10.12 10.33 10.53 10.29 9.53 9.23 8.55 7.88 7.90 7.07 8.57
percentage of revenue
percentage of revenue
10.12 10.33 10.53 10.29 9.53 9.23 8.55 7.88 7.90 7.07 8.57
percentage of revenue
percentage of revenue
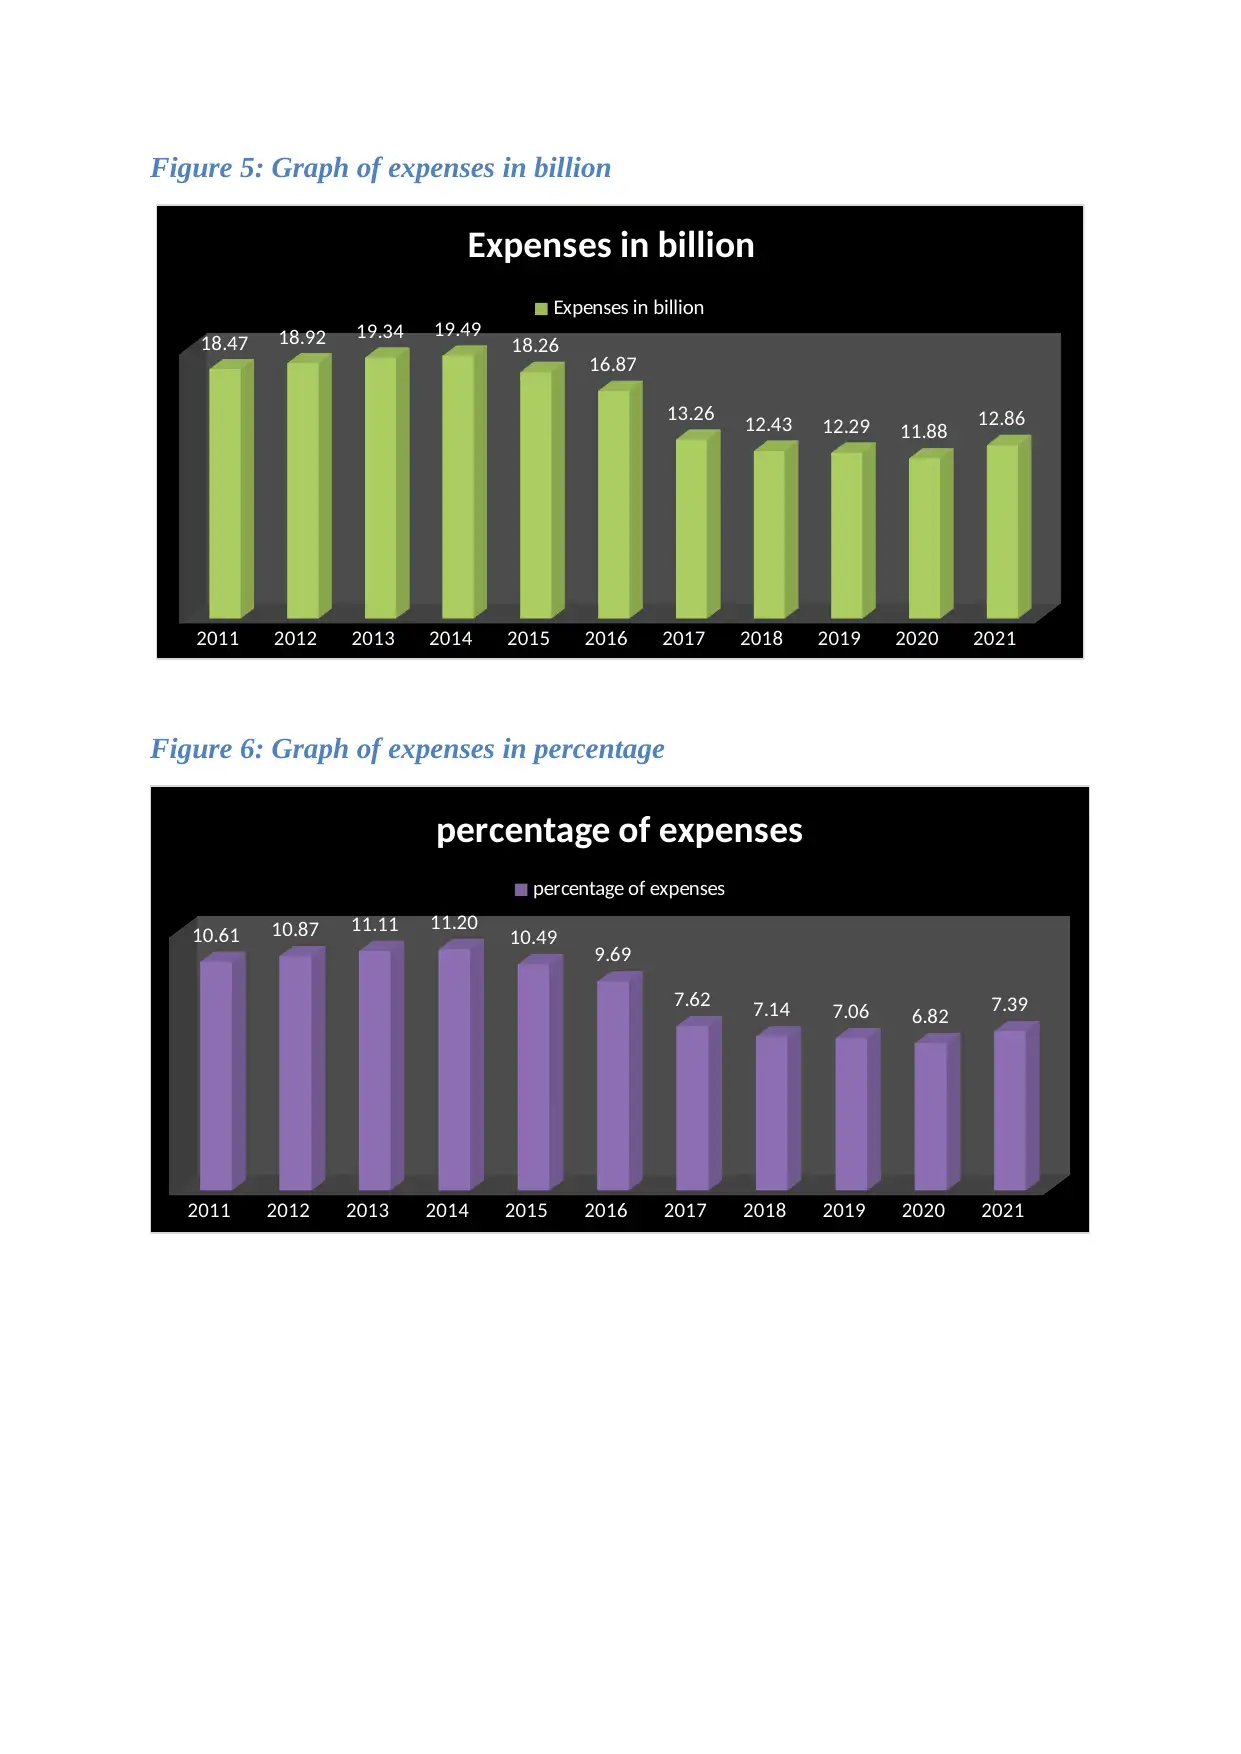
Figure 5: Graph of expenses in billion
2011 2012 2013 2014 2015 2016 2017 2018 2019 2020 2021
18.47 18.92 19.34 19.49 18.26 16.87
13.26 12.43 12.29 11.88 12.86
Expenses in billion
Expenses in billion
Figure 6: Graph of expenses in percentage
2011 2012 2013 2014 2015 2016 2017 2018 2019 2020 2021
10.61 10.87 11.11 11.20 10.49 9.69
7.62 7.14 7.06 6.82 7.39
percentage of expenses
percentage of expenses
2011 2012 2013 2014 2015 2016 2017 2018 2019 2020 2021
18.47 18.92 19.34 19.49 18.26 16.87
13.26 12.43 12.29 11.88 12.86
Expenses in billion
Expenses in billion
Figure 6: Graph of expenses in percentage
2011 2012 2013 2014 2015 2016 2017 2018 2019 2020 2021
10.61 10.87 11.11 11.20 10.49 9.69
7.62 7.14 7.06 6.82 7.39
percentage of expenses
percentage of expenses
⊘ This is a preview!⊘
Do you want full access?
Subscribe today to unlock all pages.
Trusted by 1+ million students worldwide
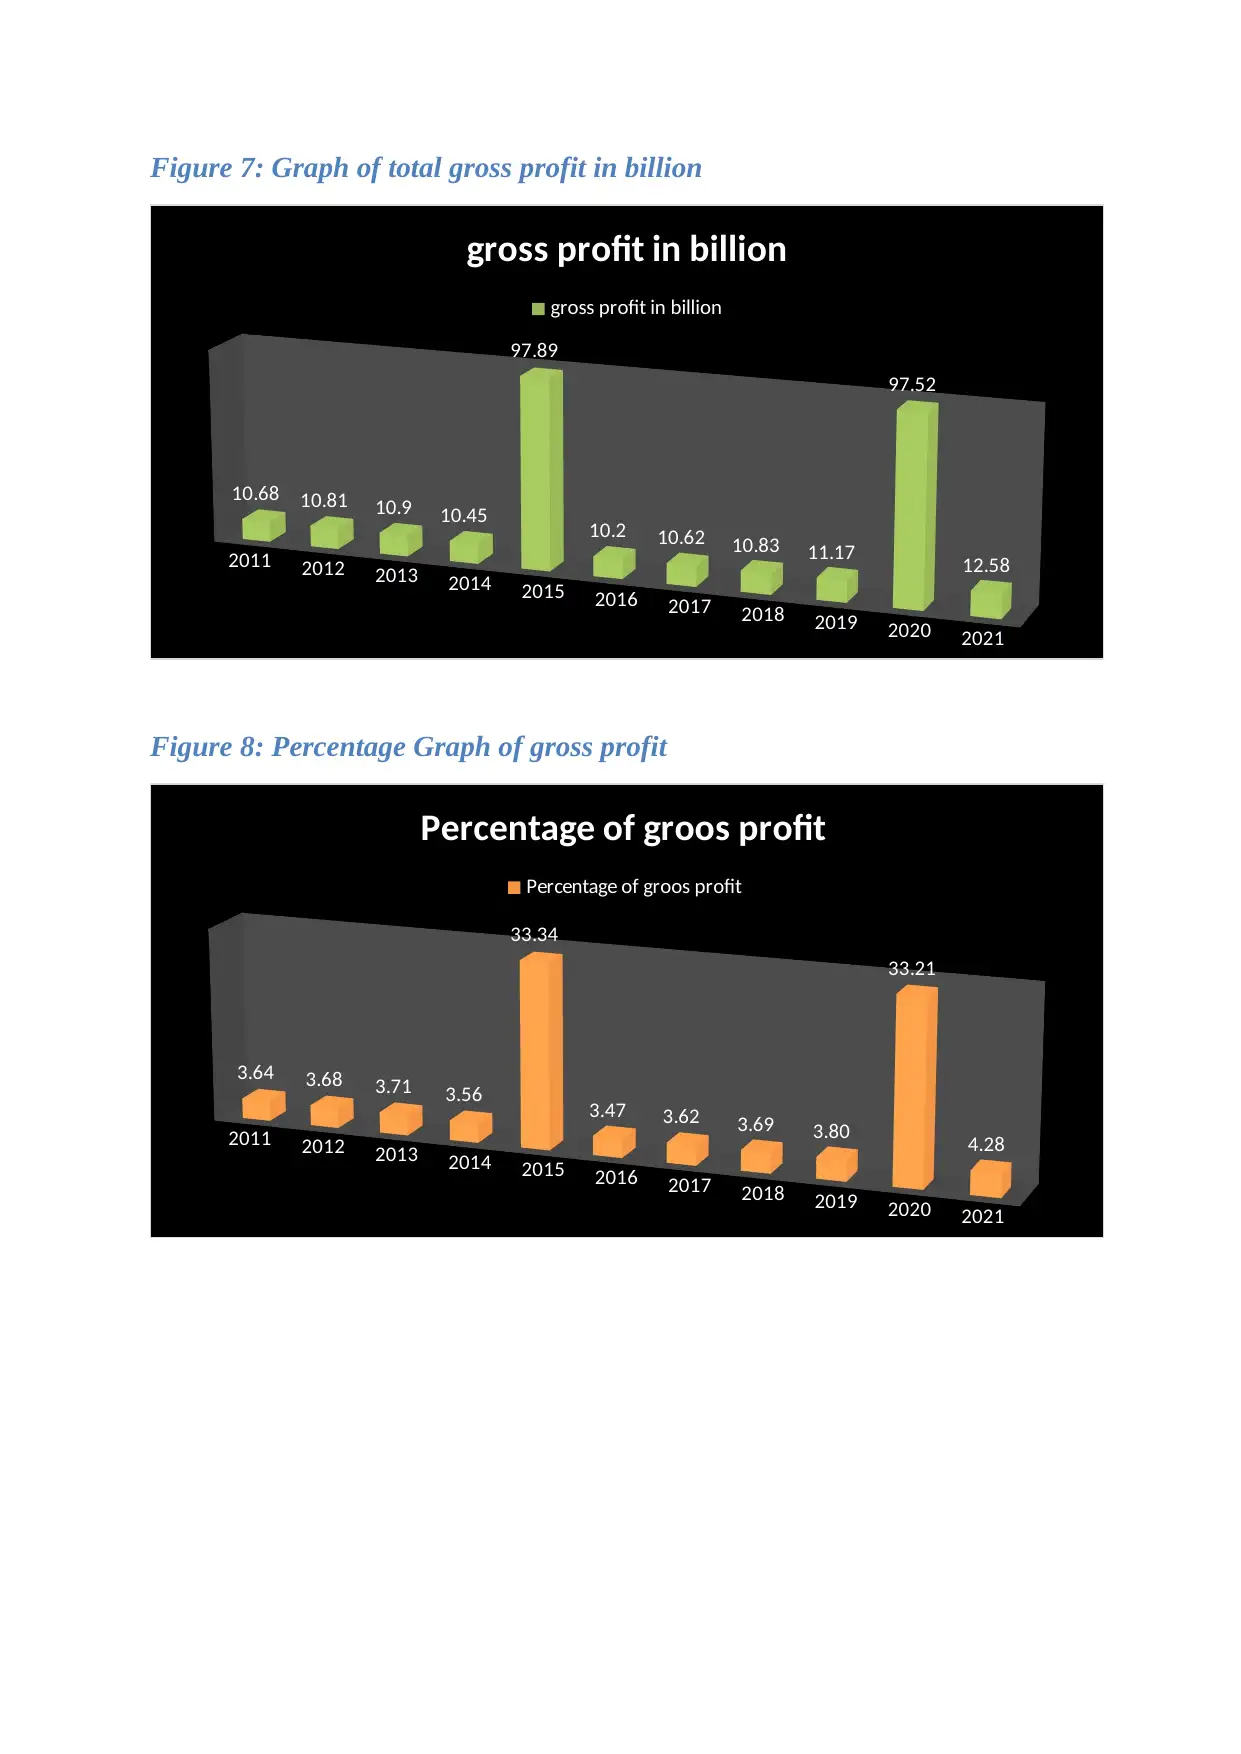
Figure 7: Graph of total gross profit in billion
2011 2012 2013 2014 2015 2016 2017 2018 2019 2020 2021
10.68 10.81 10.9 10.45
97.89
10.2 10.62 10.83 11.17
97.52
12.58
gross profit in billion
gross profit in billion
Figure 8: Percentage Graph of gross profit
2011 2012 2013 2014 2015 2016 2017 2018 2019 2020 2021
3.64 3.68 3.71 3.56
33.34
3.47 3.62 3.69 3.80
33.21
4.28
Percentage of groos profit
Percentage of groos profit
2011 2012 2013 2014 2015 2016 2017 2018 2019 2020 2021
10.68 10.81 10.9 10.45
97.89
10.2 10.62 10.83 11.17
97.52
12.58
gross profit in billion
gross profit in billion
Figure 8: Percentage Graph of gross profit
2011 2012 2013 2014 2015 2016 2017 2018 2019 2020 2021
3.64 3.68 3.71 3.56
33.34
3.47 3.62 3.69 3.80
33.21
4.28
Percentage of groos profit
Percentage of groos profit
Paraphrase This Document
Need a fresh take? Get an instant paraphrase of this document with our AI Paraphraser
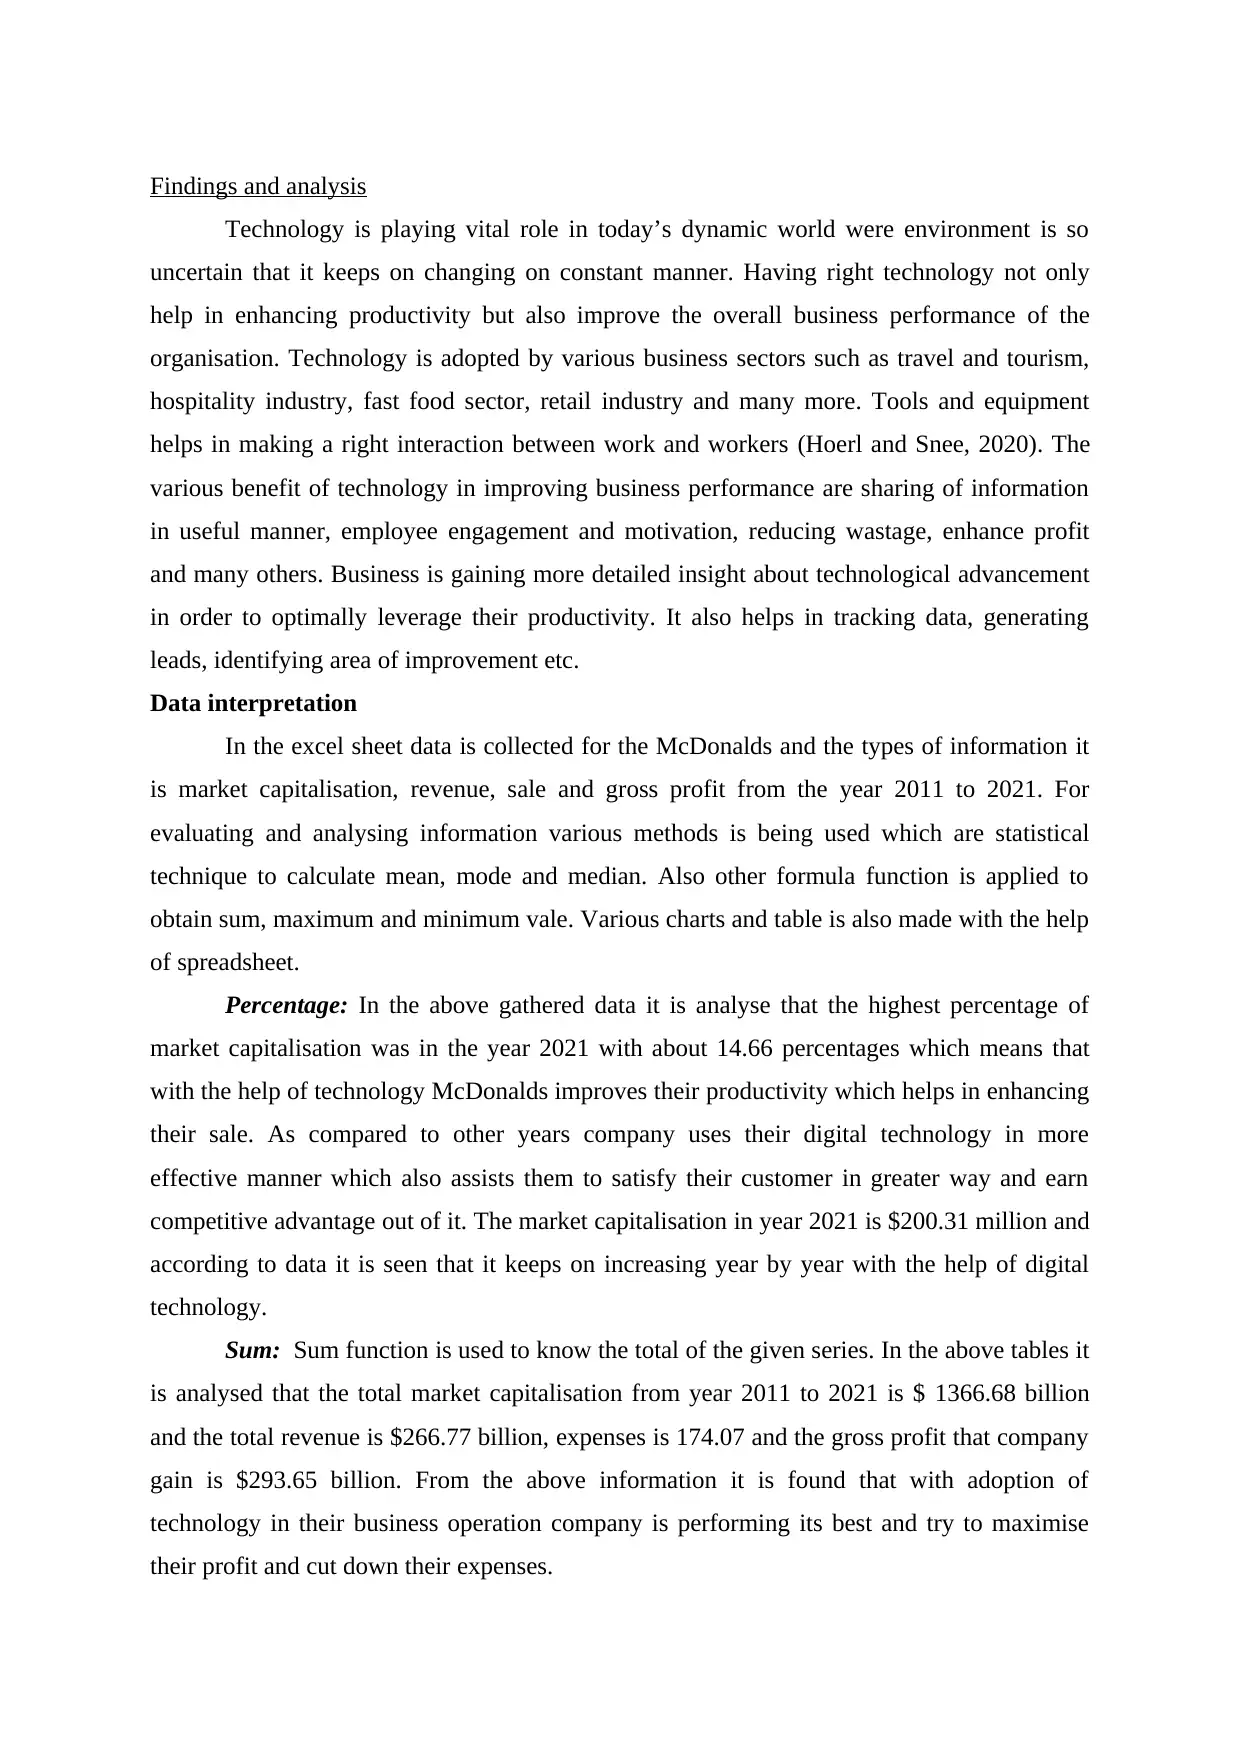
Findings and analysis
Technology is playing vital role in today’s dynamic world were environment is so
uncertain that it keeps on changing on constant manner. Having right technology not only
help in enhancing productivity but also improve the overall business performance of the
organisation. Technology is adopted by various business sectors such as travel and tourism,
hospitality industry, fast food sector, retail industry and many more. Tools and equipment
helps in making a right interaction between work and workers (Hoerl and Snee, 2020). The
various benefit of technology in improving business performance are sharing of information
in useful manner, employee engagement and motivation, reducing wastage, enhance profit
and many others. Business is gaining more detailed insight about technological advancement
in order to optimally leverage their productivity. It also helps in tracking data, generating
leads, identifying area of improvement etc.
Data interpretation
In the excel sheet data is collected for the McDonalds and the types of information it
is market capitalisation, revenue, sale and gross profit from the year 2011 to 2021. For
evaluating and analysing information various methods is being used which are statistical
technique to calculate mean, mode and median. Also other formula function is applied to
obtain sum, maximum and minimum vale. Various charts and table is also made with the help
of spreadsheet.
Percentage: In the above gathered data it is analyse that the highest percentage of
market capitalisation was in the year 2021 with about 14.66 percentages which means that
with the help of technology McDonalds improves their productivity which helps in enhancing
their sale. As compared to other years company uses their digital technology in more
effective manner which also assists them to satisfy their customer in greater way and earn
competitive advantage out of it. The market capitalisation in year 2021 is $200.31 million and
according to data it is seen that it keeps on increasing year by year with the help of digital
technology.
Sum: Sum function is used to know the total of the given series. In the above tables it
is analysed that the total market capitalisation from year 2011 to 2021 is $ 1366.68 billion
and the total revenue is $266.77 billion, expenses is 174.07 and the gross profit that company
gain is $293.65 billion. From the above information it is found that with adoption of
technology in their business operation company is performing its best and try to maximise
their profit and cut down their expenses.
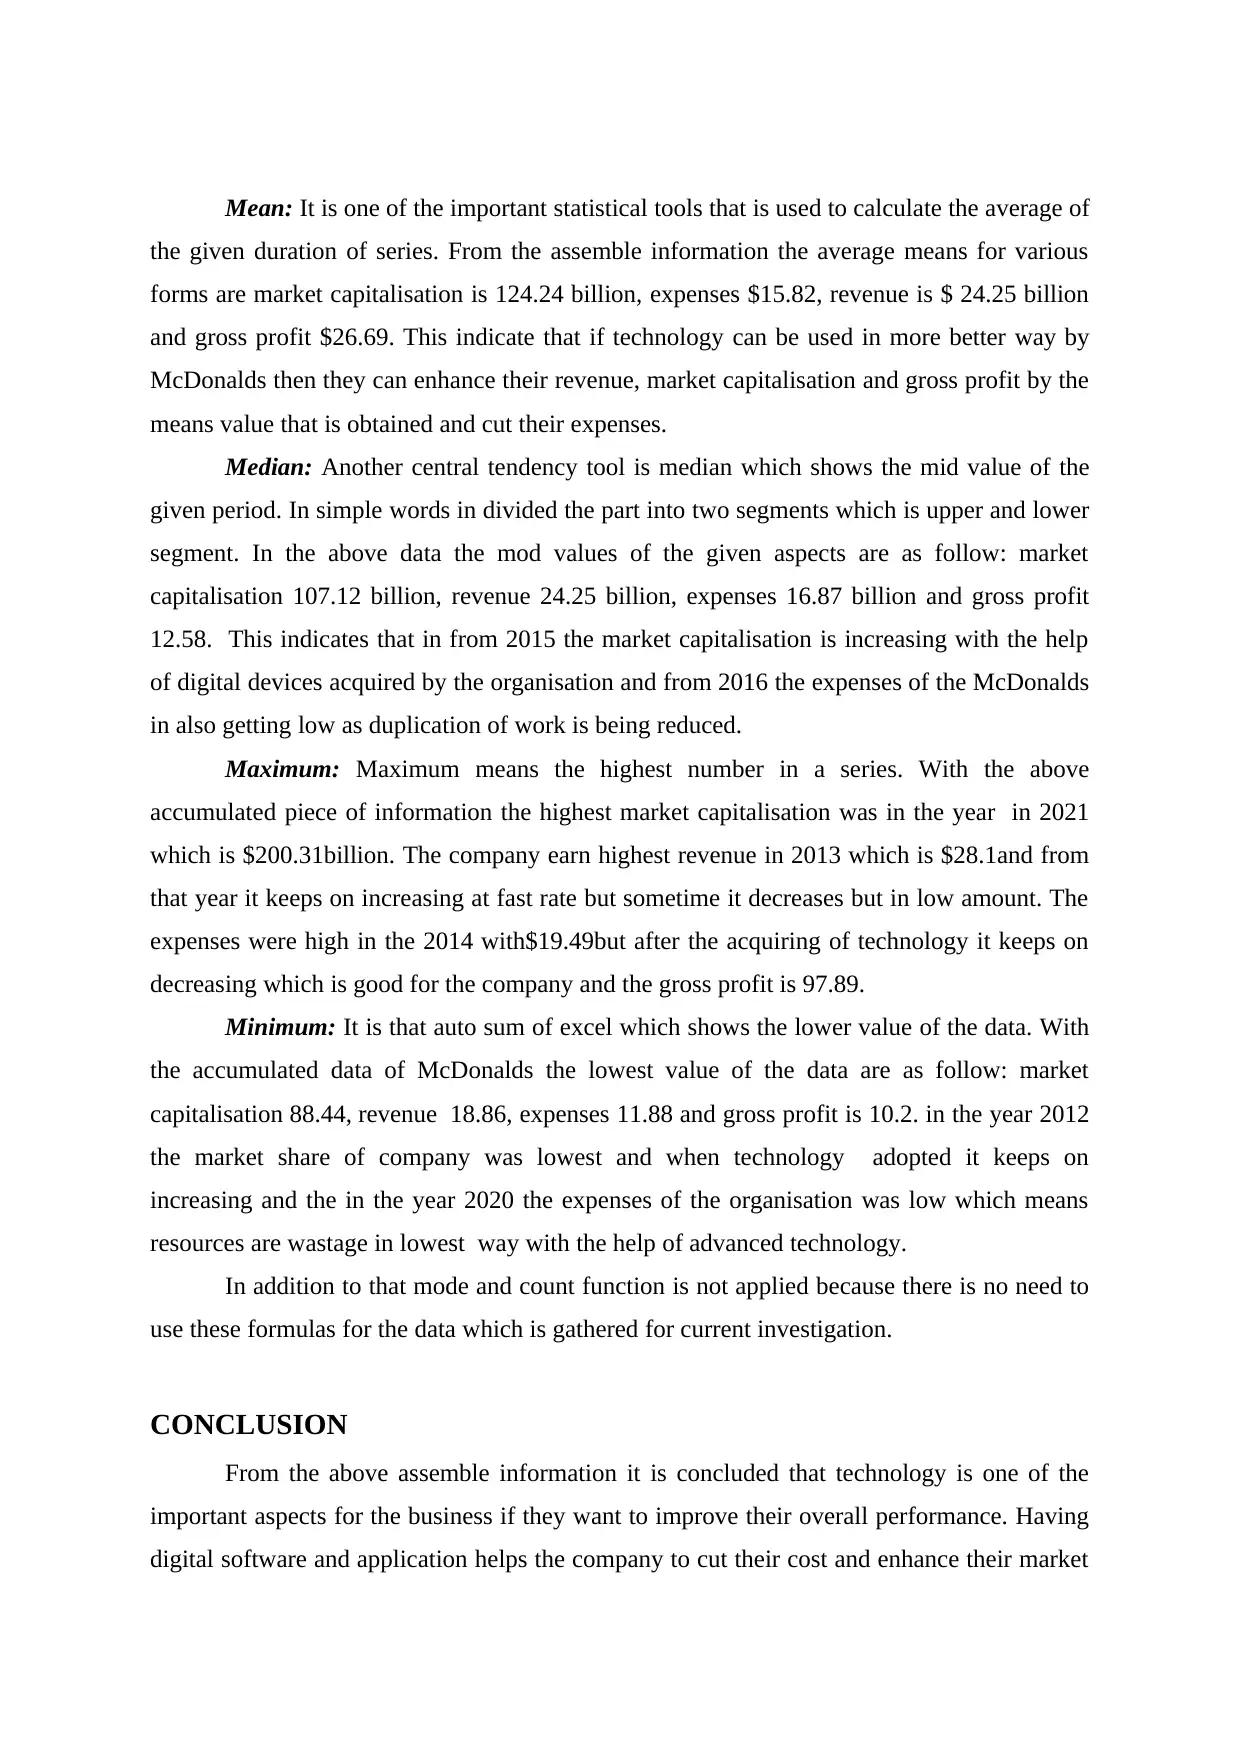
Mean: It is one of the important statistical tools that is used to calculate the average of
the given duration of series. From the assemble information the average means for various
forms are market capitalisation is 124.24 billion, expenses $15.82, revenue is $ 24.25 billion
and gross profit $26.69. This indicate that if technology can be used in more better way by
McDonalds then they can enhance their revenue, market capitalisation and gross profit by the
means value that is obtained and cut their expenses.
Median: Another central tendency tool is median which shows the mid value of the
given period. In simple words in divided the part into two segments which is upper and lower
segment. In the above data the mod values of the given aspects are as follow: market
capitalisation 107.12 billion, revenue 24.25 billion, expenses 16.87 billion and gross profit
12.58. This indicates that in from 2015 the market capitalisation is increasing with the help
of digital devices acquired by the organisation and from 2016 the expenses of the McDonalds
in also getting low as duplication of work is being reduced.
Maximum: Maximum means the highest number in a series. With the above
accumulated piece of information the highest market capitalisation was in the year in 2021
which is $200.31billion. The company earn highest revenue in 2013 which is $28.1and from
that year it keeps on increasing at fast rate but sometime it decreases but in low amount. The
expenses were high in the 2014 with$19.49but after the acquiring of technology it keeps on
decreasing which is good for the company and the gross profit is 97.89.
Minimum: It is that auto sum of excel which shows the lower value of the data. With
the accumulated data of McDonalds the lowest value of the data are as follow: market
capitalisation 88.44, revenue 18.86, expenses 11.88 and gross profit is 10.2. in the year 2012
the market share of company was lowest and when technology adopted it keeps on
increasing and the in the year 2020 the expenses of the organisation was low which means
resources are wastage in lowest way with the help of advanced technology.
In addition to that mode and count function is not applied because there is no need to
use these formulas for the data which is gathered for current investigation.
CONCLUSION
From the above assemble information it is concluded that technology is one of the
important aspects for the business if they want to improve their overall performance. Having
digital software and application helps the company to cut their cost and enhance their market
⊘ This is a preview!⊘
Do you want full access?
Subscribe today to unlock all pages.
Trusted by 1+ million students worldwide
1 out of 14
Related Documents


Your All-in-One AI-Powered Toolkit for Academic Success.
+13062052269
info@desklib.com
Available 24*7 on WhatsApp / Email
![[object Object]](/_next/static/media/star-bottom.7253800d.svg)
Unlock your academic potential
Copyright © 2020–2026 A2Z Services. All Rights Reserved. Developed and managed by ZUCOL.