Financial Analysis of McPherson's Ltd (MCP) Valuation Report
VerifiedAdded on 2023/04/25
|26
|5000
|112
Report
AI Summary
This report undertakes three valuations of McPherson's Limited (MCP), a company involved in marketing and distributing health and beauty, consumer durables, and household consumables in Australasia. The analysis begins with a base case valuation based on MCP's current strategies, assessing its potential over or undervaluation relative to its current share price. It then defines and analyzes a specific key risk scenario, evaluating its impact on MCP's performance drivers, financial outcomes, and value. Finally, the report proposes potential restructuring strategies to strengthen MCP's position post-shock, improve its cash flow, and enhance its overall value. The analysis employs financial modeling and considers various factors like revenue growth, operating costs, and free cash flow valuation to provide a comprehensive financial assessment. The report is aimed at providing a clear understanding of the financial position of the company.

Running head: FINANCIAL ANALYSIS
Finance
Name of the Student:
Name of the University:
Author’s Note:
Finance
Name of the Student:
Name of the University:
Author’s Note:
Paraphrase This Document
Need a fresh take? Get an instant paraphrase of this document with our AI Paraphraser
1FINANCE
Table of Contents
Introduction......................................................................................................................................2
Base Case Valuation........................................................................................................................2
Business Strategies......................................................................................................................2
Sales Revenue and Product Analysis...........................................................................................3
Key Risks Identified....................................................................................................................5
Financial Analysis.......................................................................................................................6
Key Factors..................................................................................................................................7
Free Cash Flow Valuation...........................................................................................................9
Comparison of Share Price........................................................................................................11
Assumption and Analysis..........................................................................................................12
Specific Scenario Valuation..........................................................................................................13
Technological Change...............................................................................................................13
Liquidity Position......................................................................................................................13
Third Scenario Valuation...............................................................................................................14
Conclusion.....................................................................................................................................15
References......................................................................................................................................16
Appendix........................................................................................................................................19
1) Forecasted Growth Factors of the McPherson’s Ltd..........................................................19
2) Forecasted Balance Sheet of McPherson’s Ltd Company..................................................19
2FINANCE
3) Forecasted Income Statement of the McPherson Ltd.........................................................20
4) Free Cash Flow for McPherson Ltd....................................................................................20
5) Valuation Factors for FCFE Models...................................................................................21
6) Additional and Key Inputs of FCFE Model.......................................................................21
7) Competitor Review for McPherson’s Ltd Company..........................................................22
8) Multix Growth and History (Grocery Division of McPhersons Ltd).................................22
9) Export Channel Model of McPherson Ltd Company.........................................................23
10) Liquidity and Profitability Position of McPherson Ltd..................................................23
⊘ This is a preview!⊘
Do you want full access?
Subscribe today to unlock all pages.
Trusted by 1+ million students worldwide
3FINANCE
Introduction
McPherson Ltd Company is a dynamic consumer product company that is primarily
involved in the marketing and distributing of various health and beauty products throughout the
Asia Pacific, UK/Europe and North America (2018 Full Year Result, 2018). The expertise of the
company lies in managing various complex and wide range of products and services that the
consumers use in everyday lives. The company has a wide range of products in the overall
portfolio of the company that it caters. Products including kitchen households, large appliances
and several accessories are some of the key product portfolios of the company. The company is
listed in the Australian Stock Exchange with the ticker symbol “MCP” with a market cap of
around 117.76 million and its current share price to be around $1.13. The operations of the
company is distributed globally in Australia, New Zealand, South East Asia and United
Kingdom. The key competitors of the company include Pental Ltd (ASX: PTL) and Asaleo Care
Ltd (ASX: AHY). The financial analysis of the company was done with the view and approach
of the current operating scenario of the company where several business factors and macro-
economic conditions of the company were taken into account for the purpose of analysis of the
company. The report will be considering the valuation of the McPherson limited company as the
base for the assessing and evaluating the growth strategies that are deployed by the management
of the company.
Base Case Valuation
Business Strategies
McPherson Company has always had a wide range and variety of products and services
in the product portfolio of the company that has helped them garner better market share in
Paraphrase This Document
Need a fresh take? Get an instant paraphrase of this document with our AI Paraphraser
4FINANCE
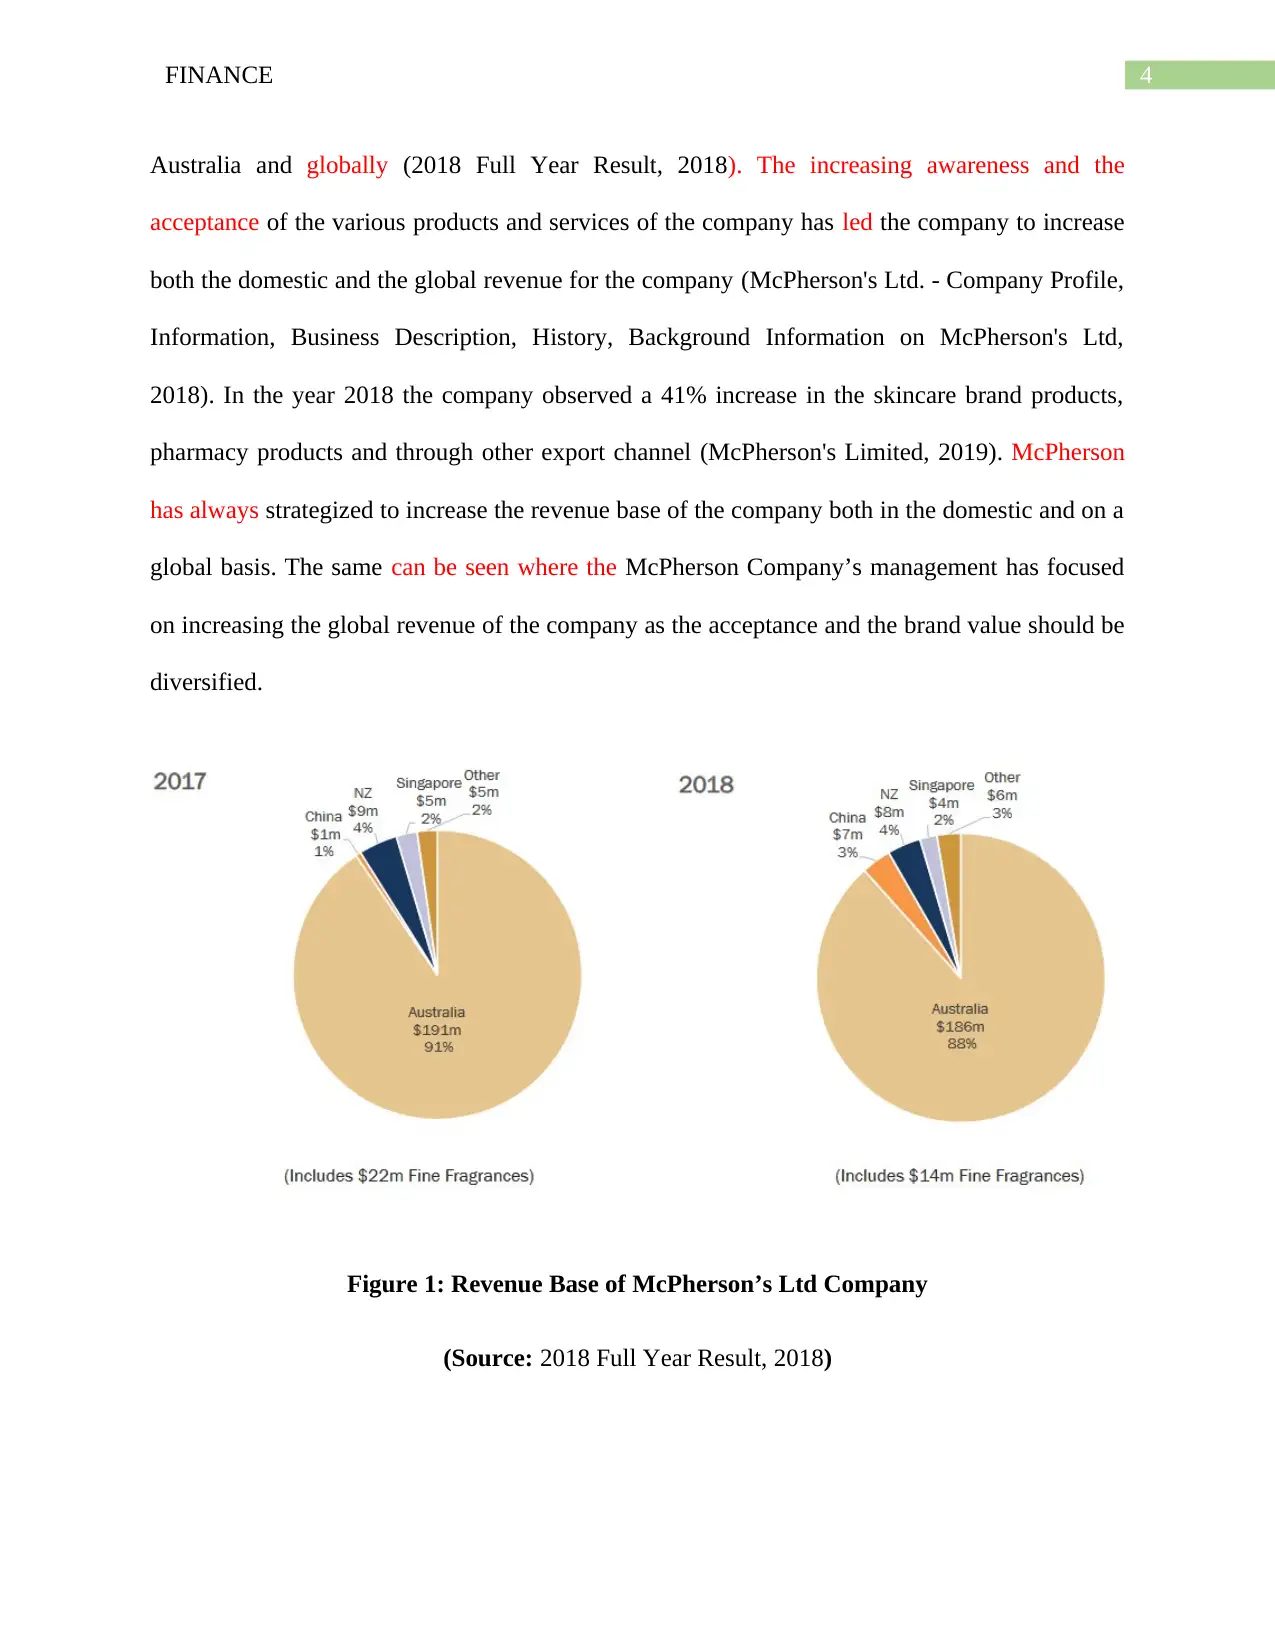
Australia and globally (2018 Full Year Result, 2018). The increasing awareness and the
acceptance of the various products and services of the company has led the company to increase
both the domestic and the global revenue for the company (McPherson's Ltd. - Company Profile,
Information, Business Description, History, Background Information on McPherson's Ltd,
2018). In the year 2018 the company observed a 41% increase in the skincare brand products,
pharmacy products and through other export channel (McPherson's Limited, 2019). McPherson
has always strategized to increase the revenue base of the company both in the domestic and on a
global basis. The same can be seen where the McPherson Company’s management has focused
on increasing the global revenue of the company as the acceptance and the brand value should be
diversified.
Figure 1: Revenue Base of McPherson’s Ltd Company
(Source: 2018 Full Year Result, 2018)
5FINANCE
Sales Revenue and Product Analysis
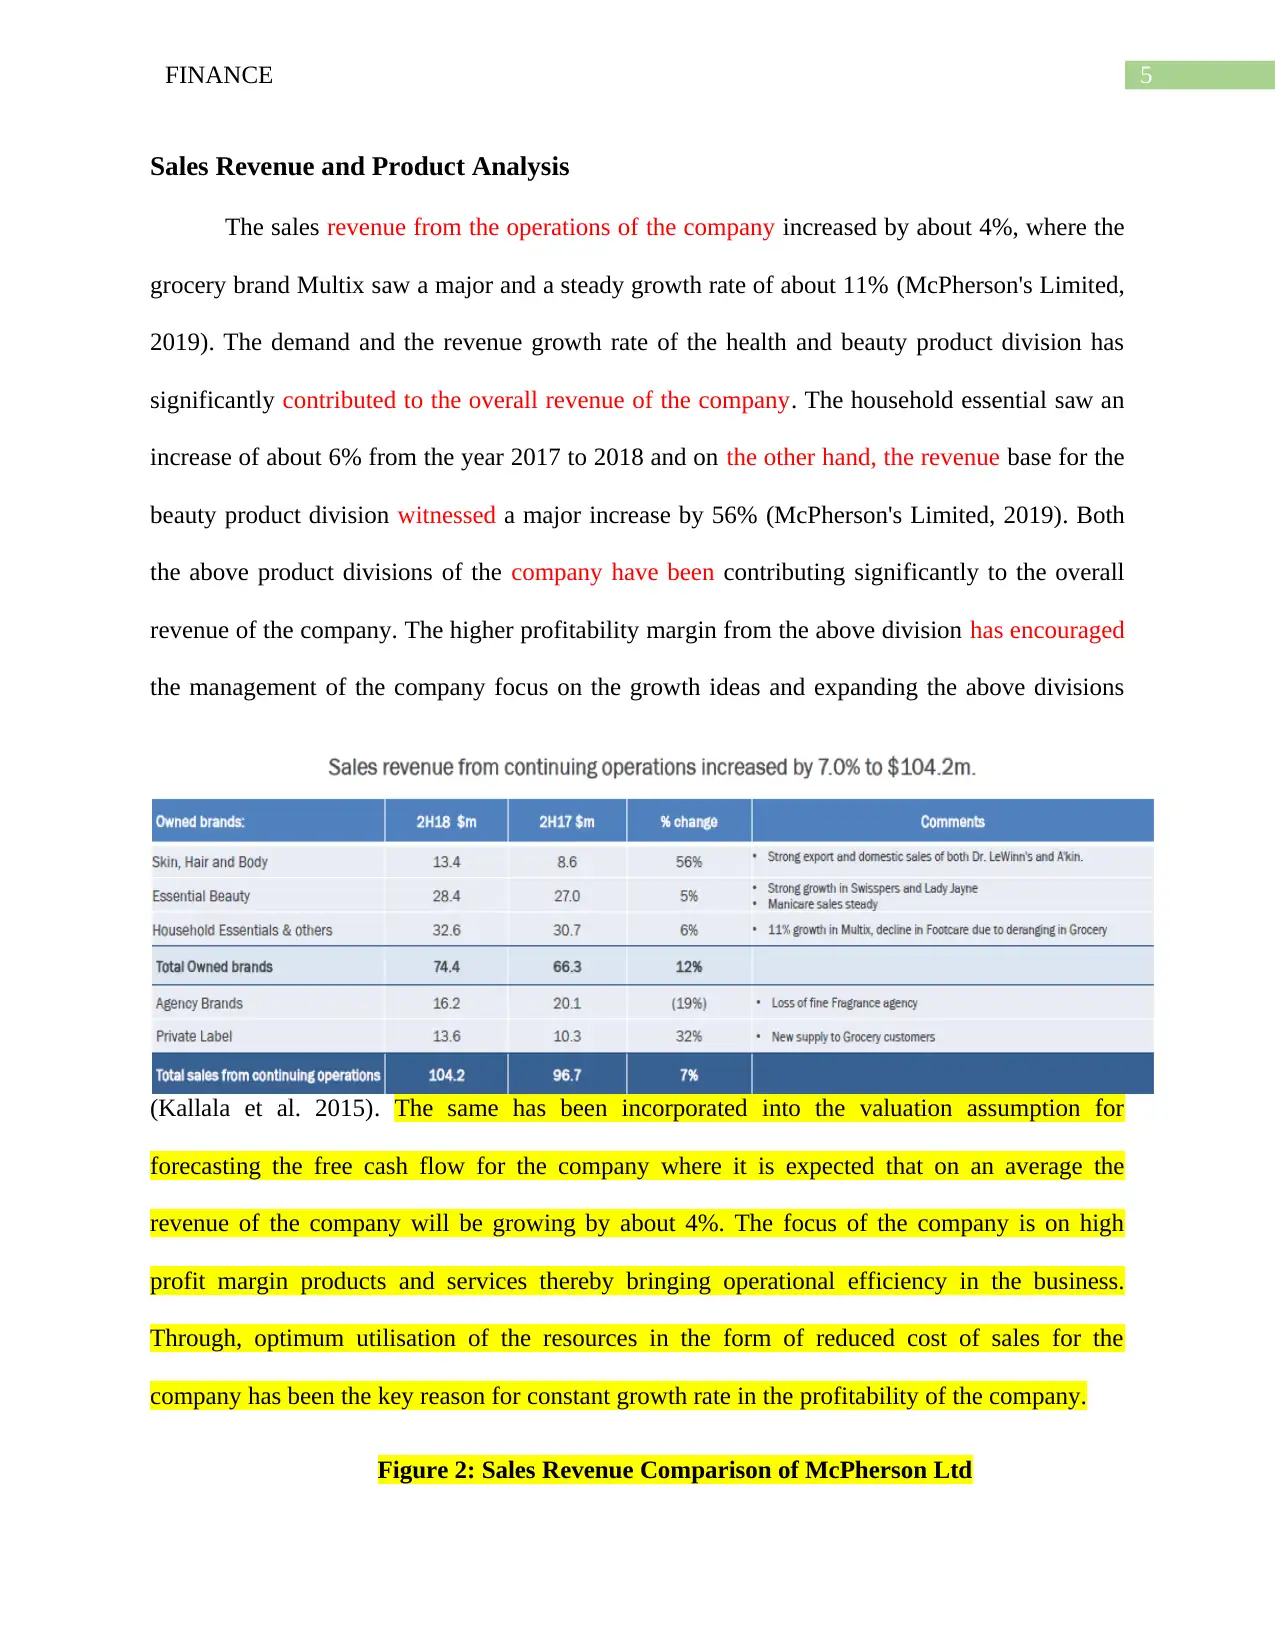
The sales revenue from the operations of the company increased by about 4%, where the
grocery brand Multix saw a major and a steady growth rate of about 11% (McPherson's Limited,
2019). The demand and the revenue growth rate of the health and beauty product division has
significantly contributed to the overall revenue of the company. The household essential saw an
increase of about 6% from the year 2017 to 2018 and on the other hand, the revenue base for the
beauty product division witnessed a major increase by 56% (McPherson's Limited, 2019). Both
the above product divisions of the company have been contributing significantly to the overall
revenue of the company. The higher profitability margin from the above division has encouraged
the management of the company focus on the growth ideas and expanding the above divisions
(Kallala et al. 2015). The same has been incorporated into the valuation assumption for
forecasting the free cash flow for the company where it is expected that on an average the
revenue of the company will be growing by about 4%. The focus of the company is on high
profit margin products and services thereby bringing operational efficiency in the business.
Through, optimum utilisation of the resources in the form of reduced cost of sales for the
company has been the key reason for constant growth rate in the profitability of the company.
Figure 2: Sales Revenue Comparison of McPherson Ltd
Sales Revenue and Product Analysis
The sales revenue from the operations of the company increased by about 4%, where the
grocery brand Multix saw a major and a steady growth rate of about 11% (McPherson's Limited,
2019). The demand and the revenue growth rate of the health and beauty product division has
significantly contributed to the overall revenue of the company. The household essential saw an
increase of about 6% from the year 2017 to 2018 and on the other hand, the revenue base for the
beauty product division witnessed a major increase by 56% (McPherson's Limited, 2019). Both
the above product divisions of the company have been contributing significantly to the overall
revenue of the company. The higher profitability margin from the above division has encouraged
the management of the company focus on the growth ideas and expanding the above divisions
(Kallala et al. 2015). The same has been incorporated into the valuation assumption for
forecasting the free cash flow for the company where it is expected that on an average the
revenue of the company will be growing by about 4%. The focus of the company is on high
profit margin products and services thereby bringing operational efficiency in the business.
Through, optimum utilisation of the resources in the form of reduced cost of sales for the
company has been the key reason for constant growth rate in the profitability of the company.
Figure 2: Sales Revenue Comparison of McPherson Ltd
⊘ This is a preview!⊘
Do you want full access?
Subscribe today to unlock all pages.
Trusted by 1+ million students worldwide
6FINANCE
(Source: 2018 Full Year Result, 2018)
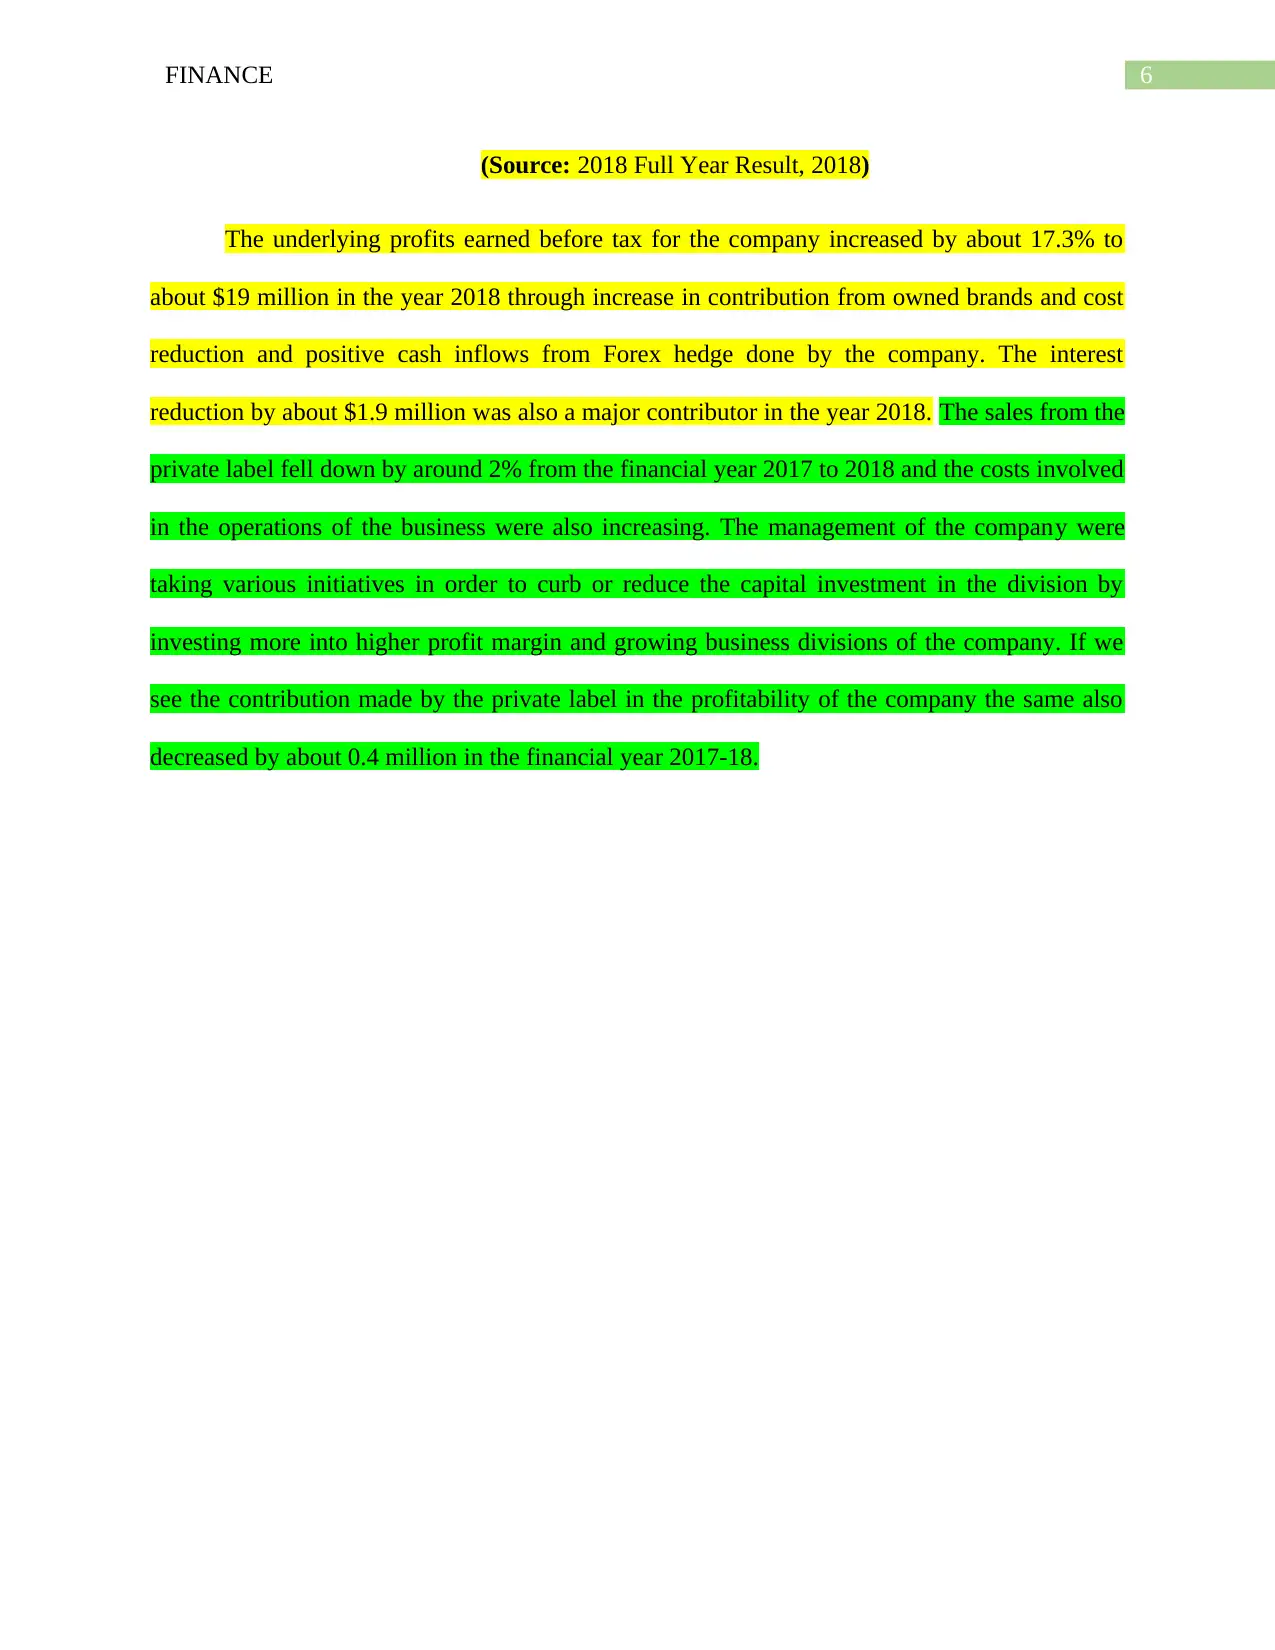
The underlying profits earned before tax for the company increased by about 17.3% to
about $19 million in the year 2018 through increase in contribution from owned brands and cost
reduction and positive cash inflows from Forex hedge done by the company. The interest
reduction by about $1.9 million was also a major contributor in the year 2018. The sales from the
private label fell down by around 2% from the financial year 2017 to 2018 and the costs involved
in the operations of the business were also increasing. The management of the company were
taking various initiatives in order to curb or reduce the capital investment in the division by
investing more into higher profit margin and growing business divisions of the company. If we
see the contribution made by the private label in the profitability of the company the same also
decreased by about 0.4 million in the financial year 2017-18.
(Source: 2018 Full Year Result, 2018)
The underlying profits earned before tax for the company increased by about 17.3% to
about $19 million in the year 2018 through increase in contribution from owned brands and cost
reduction and positive cash inflows from Forex hedge done by the company. The interest
reduction by about $1.9 million was also a major contributor in the year 2018. The sales from the
private label fell down by around 2% from the financial year 2017 to 2018 and the costs involved
in the operations of the business were also increasing. The management of the company were
taking various initiatives in order to curb or reduce the capital investment in the division by
investing more into higher profit margin and growing business divisions of the company. If we
see the contribution made by the private label in the profitability of the company the same also
decreased by about 0.4 million in the financial year 2017-18.
Paraphrase This Document
Need a fresh take? Get an instant paraphrase of this document with our AI Paraphraser
7FINANCE
Figure 3: Underlying Profit Tax of Financial Year 2017-18
(Source: 2018 Full Year Result, 2018)
Key Risks Identified
The key risks identified for the company were the business risk and the financial risk,
which were well tackled by the management of the company through the application of various
strategies. Business risks of McPherson’s were in the form of volatile revenue from the various
brands and product portfolio of the company. The financial risk of the company is generally in
the form of high leverage or debt but the company has tackled and managed the same by
reducing the debt from the financials of the company in the year 2018. Almost, 73% reduction in
the debt of the company was observed where the net debt pf the company was around $9.8
million.
8FINANCE
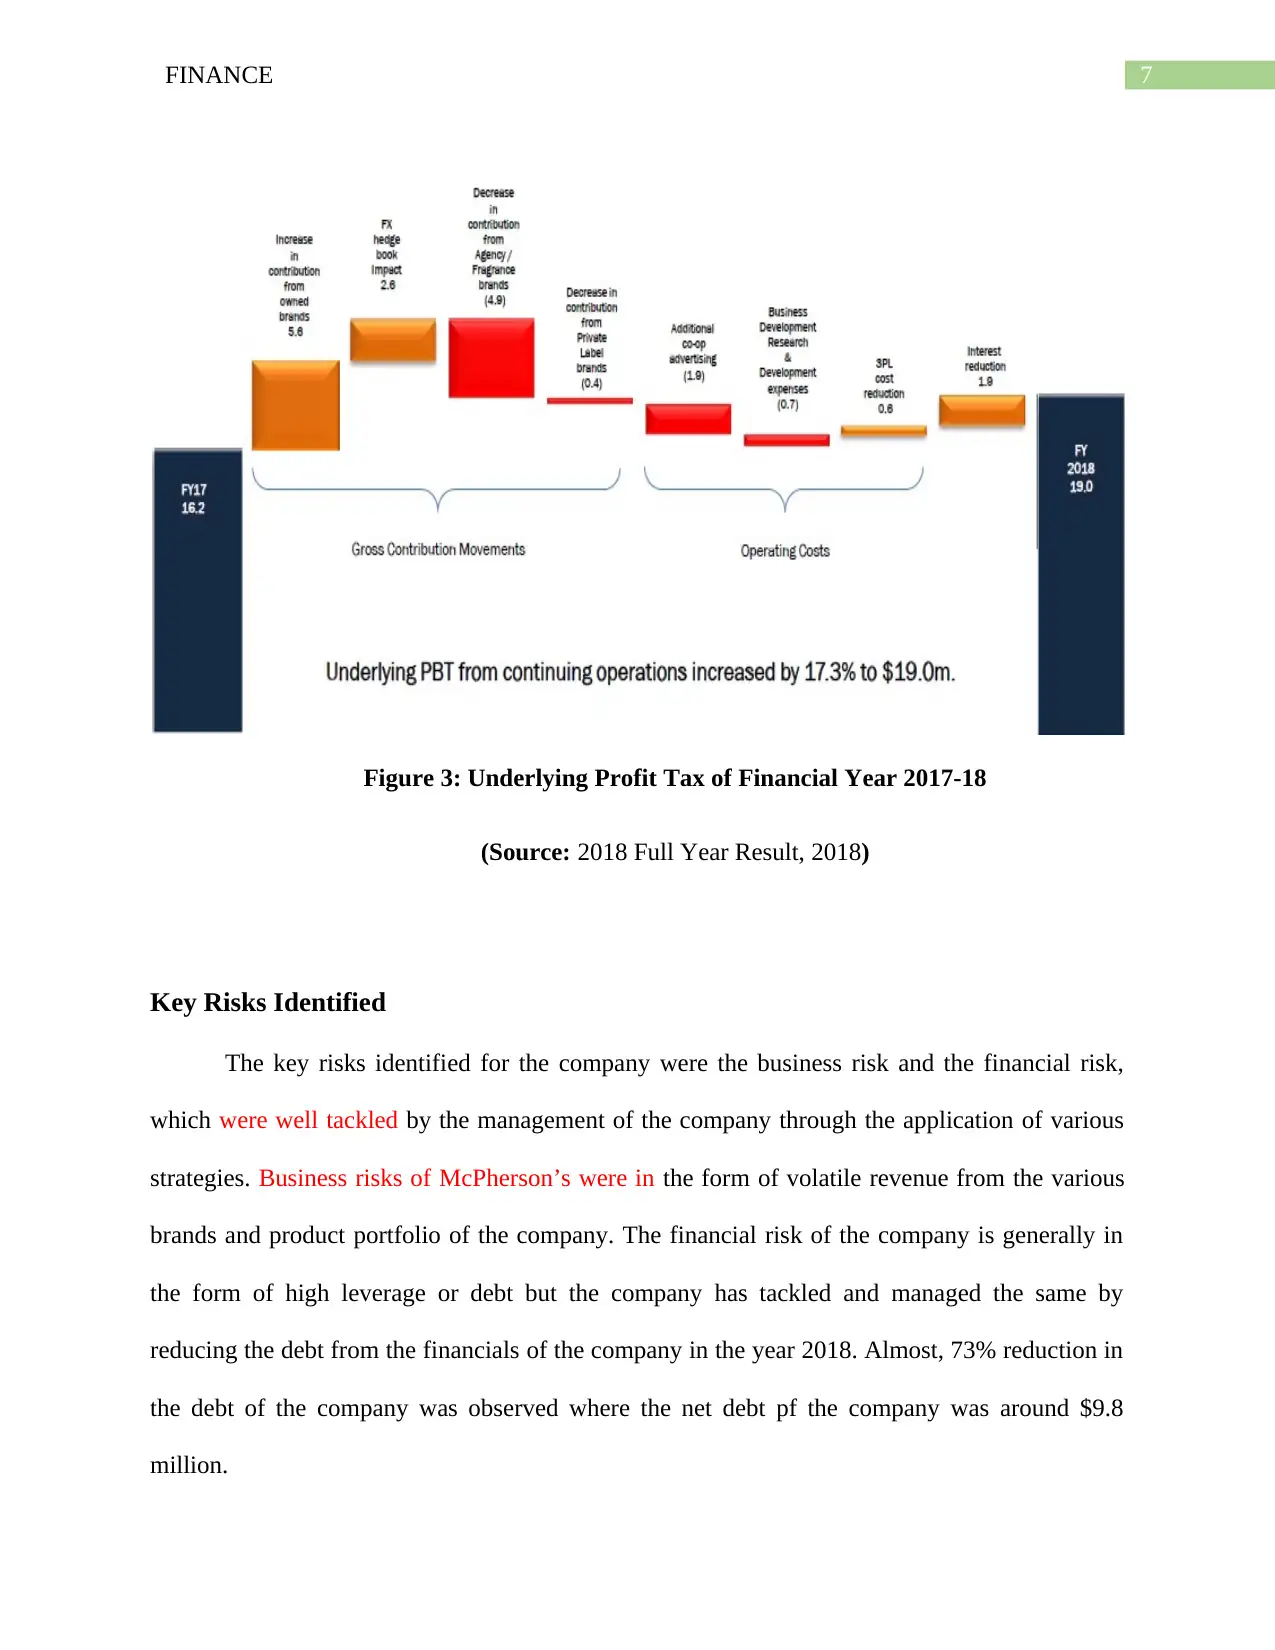
Figure 3: Trading Environment of McPherson’s Ltd Company
(Source: 2018 Full Year Result, 2018)
Financial Analysis
The valuation of the company is done based on the assumption that the operational
activity of the company is expected to be sustainable in the defined trend period of analysis. The
trend or the growth rate of the various key factors of the company are taken into consideration
for the purpose of the analysis of the company. The analysis of the company was done after
taking the growth rate of the revenue of the company, the expense of the company and various
⊘ This is a preview!⊘
Do you want full access?
Subscribe today to unlock all pages.
Trusted by 1+ million students worldwide
9FINANCE
accounting factors for the company to get the forecasted financials of the company. Forecasting
the financials of the company includes various trends and factors that should be taken into
consolidation so that the financial performance of the company reflect well and potential risk and
reflects the current and business economic scenario of the company where the operations of the
company is based (MarketScreener, 2019).
Key Factors
Revenue Growth Rate: The growth rate in the revenue for the company was taken to be at a
constant rate of around 4% for the company, which is expected to be in line with the operations
of the company. The company has introduced several products whereby the company has in the
past observed a growth rate of around 4%. The same has been taken into assumption by
forecasting the revenue growth of the company and the financials of the company on the same
basis has been taken into consideration for preparing the financials of the company (Susan
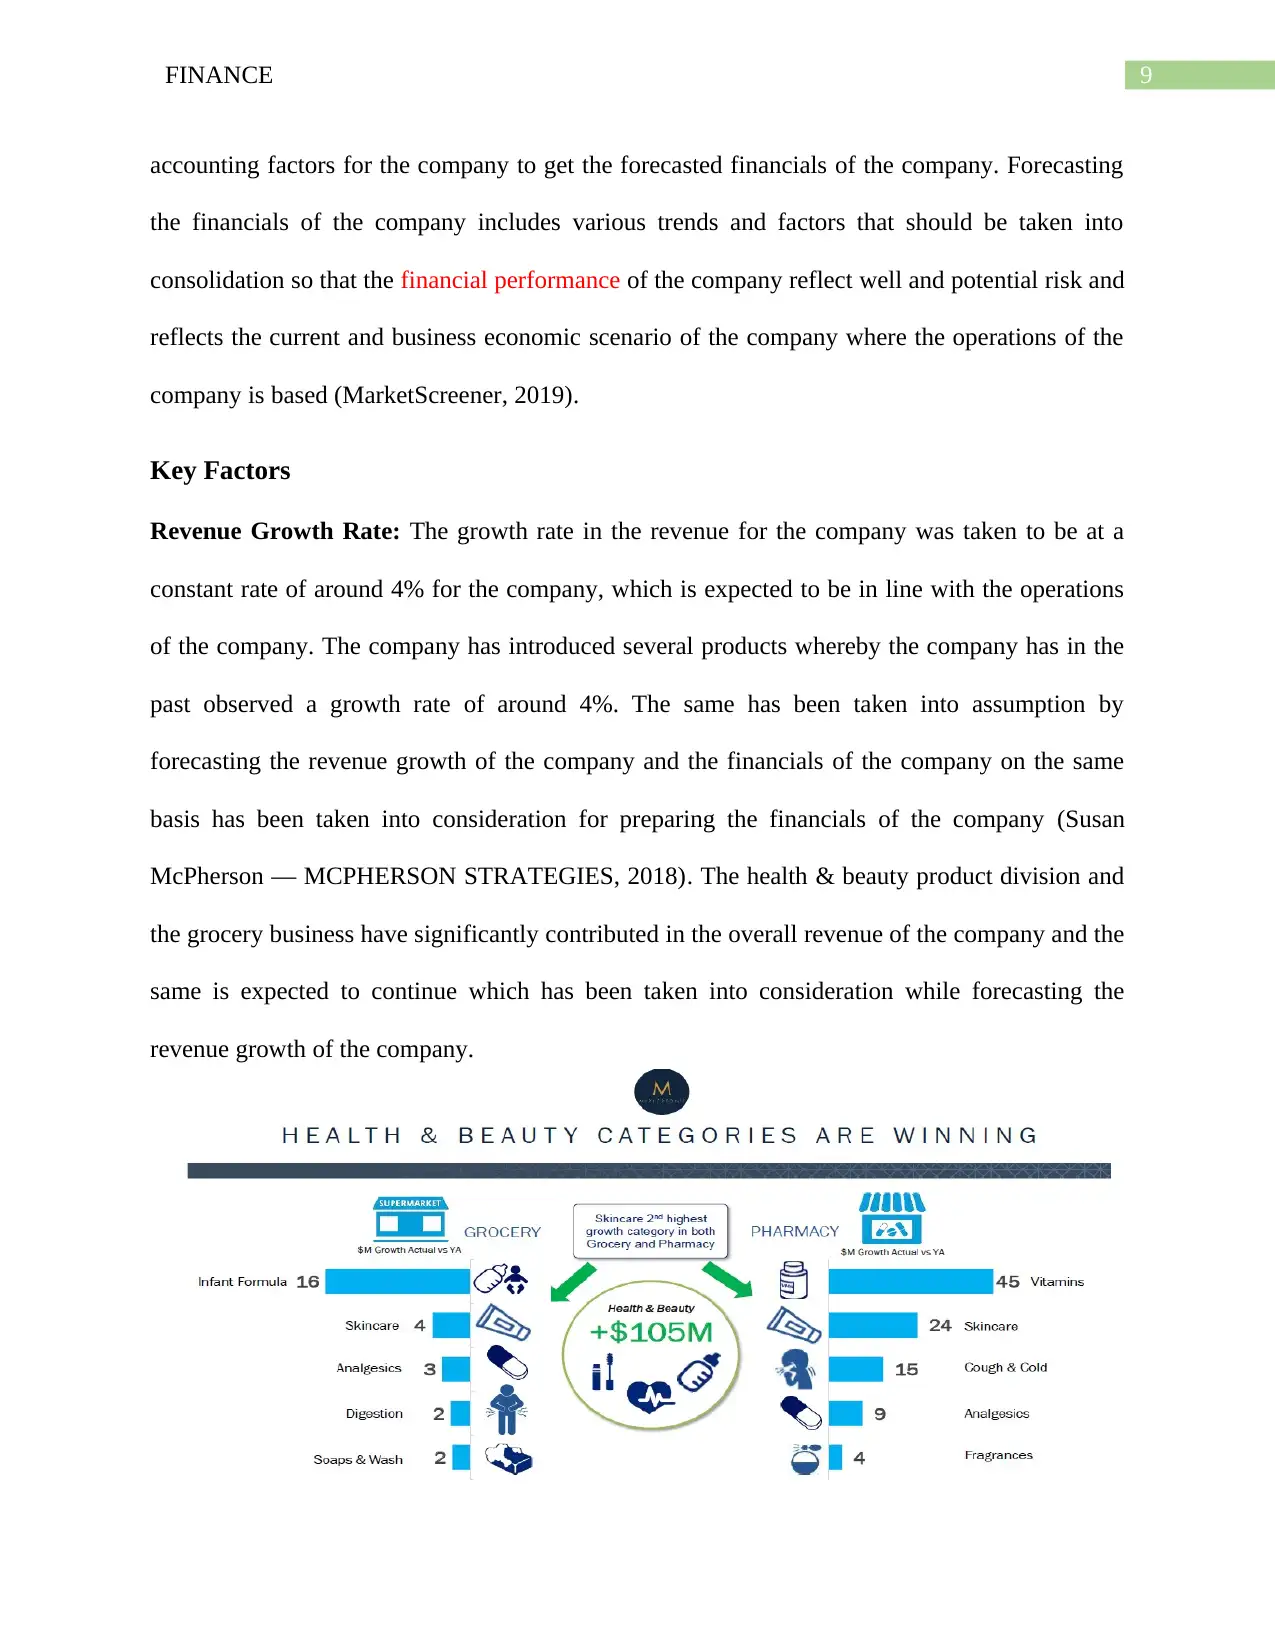
McPherson — MCPHERSON STRATEGIES, 2018). The health & beauty product division and
the grocery business have significantly contributed in the overall revenue of the company and the
same is expected to continue which has been taken into consideration while forecasting the
revenue growth of the company.
accounting factors for the company to get the forecasted financials of the company. Forecasting
the financials of the company includes various trends and factors that should be taken into
consolidation so that the financial performance of the company reflect well and potential risk and
reflects the current and business economic scenario of the company where the operations of the
company is based (MarketScreener, 2019).
Key Factors
Revenue Growth Rate: The growth rate in the revenue for the company was taken to be at a
constant rate of around 4% for the company, which is expected to be in line with the operations
of the company. The company has introduced several products whereby the company has in the
past observed a growth rate of around 4%. The same has been taken into assumption by
forecasting the revenue growth of the company and the financials of the company on the same
basis has been taken into consideration for preparing the financials of the company (Susan
McPherson — MCPHERSON STRATEGIES, 2018). The health & beauty product division and
the grocery business have significantly contributed in the overall revenue of the company and the
same is expected to continue which has been taken into consideration while forecasting the
revenue growth of the company.
Paraphrase This Document
Need a fresh take? Get an instant paraphrase of this document with our AI Paraphraser
10FINANCE
Figure 4: Grocery and Pharmacy division of McPherson’s Ltd Company
(Source: 2018 Full Year Result, 2018)
Operating Cost Margins: The operating cost margins for the company is assumed to be around
89% for the company in the financials of the company. The operating cost for the company is
expected to be sustainable and is sound that will make the financial operations of the company
more sustainable.
Depreciation: Depreciation rate on the other hand will be charged under the fixed assets of the
company. The depreciation rate for the company will be around 3% for the total fixed assets of
the company.
Interest Rates: The interest rate for the company will be applicable as per the applicable interest
rate on the debt balance of the company. The interest rate on the debt of the company will be
around 22% which is a significant amount affecting the profitability of the company.
Pay-out Ratio: The pay-out ratio for the company will be around 77% of the total earnings of
the company and the same has been taken into assumption by taking the historical pay-out ratio
of the company.
Debt/Equity Ratio: The debt to equity ratio for the company is expected to increase for the
company in the forecasted financials of the company where the debt for the company is expected
to increase for the company, which in turn would increase the leverage and financial risk of the
company.
11FINANCE
Free Cash Flow Valuation
The free cash flow valuation for the company will be done based on the earnings of the
company and the forecasted valuation for the company. The free cash flow for equity was
determined with the help of the formula given below:
FCFF: Earnings before Tax+ Depreciation + Amortisation - Change in WACC- Capital
Expenditure.
The financials for the McPherson Ltd Company was forecasted from the year 2019-2023
by taking 2018 as the base year for the company and taking the relevant cash flows of the
company into consideration for the purpose of the valuation of the company (CapitalCube,
2019). The free cash flows for the company is expected to grow as the projected net income
grows for the company in the forecasted trend period of the company. It is crucial to note that
while valuing the company or the forecasted share price of the company based on the forecasted
growth rate of the company there are several factors and conditions, which needs to be taken into
consideration for the purpose of the valuation of the company. The free cash flow for the
company is expected to grow for the company with the increasing revenue base of the company.
The valuation and the analysis of the company needs to be done while analysing the
estimated share price of the company with the current share price of the company. While
evaluating the estimated free cash flow and the equity value/share price of the company there are
two important factors that should be taken into consideration that is the required rate of return on
equity and the growth rate of the company.
Equity Hurdle Rate: The hurdle rate for the equity shows the minimum required return by the
shareholders of the company which was calculated with the formula:
⊘ This is a preview!⊘
Do you want full access?
Subscribe today to unlock all pages.
Trusted by 1+ million students worldwide
1 out of 26
Related Documents


Your All-in-One AI-Powered Toolkit for Academic Success.
+13062052269
info@desklib.com
Available 24*7 on WhatsApp / Email
![[object Object]](/_next/static/media/star-bottom.7253800d.svg)
Unlock your academic potential
Copyright © 2020–2026 A2Z Services. All Rights Reserved. Developed and managed by ZUCOL.