CFM-CW2 Group Assignment: McTavish & Company Financial Strategy Report
VerifiedAdded on 2022/09/12
|20
|3426
|18
Report
AI Summary
This report provides a detailed analysis of McTavish & Company's financial performance, focusing on the type, scale, and geographical scope of its contracts. The analysis includes an examination of the company's history, initial investments, and the scope of the report. Chapter 2 delves into the analysis, discussion, and results, including general history analysis, contract type, scale, and geographical scope analysis, supported by figures and tables illustrating contract values, gross profits, procurement methods, locations, and contract types. The report evaluates the profitability of different contract types, procurement methods, and geographical locations, providing insights into the company's strengths and weaknesses. The conclusion and recommendations in Chapter 3 include the management and organizational structure and recommendations. The report suggests focusing on specific contract types (fire repair, housing, office blocks), procurement methods (selective tenders), and geographical areas (Bathgate and Armadale). It also recommends prudent selection of project scales, cash flow management, and defining technical expertise. The report concludes by emphasizing the importance of strategic decision-making in contract selection and financial planning for sustainable growth.
Table Content
List of Figures iv
List of Table iv
1 CHAPTER 1- INTRODUCTION 1
1.1 The Historic of Mctavish and Company 1
1.2 The Initial Investment of Company 1
1.3 Scope of Report 2
2 CHAPTER 2: ANALYSIS, DISCUSSION AND RESULT 3
2.1 General History Analysis 3
2.2 Type, Scale and Geographical of the Mctavish &
Company
7
2.2.1 The Analysis of Contract Type 8
2.2.2 The Analysis of Contract Scale 9
2.2.3 The Analysis of Geographic Scope 11
3 CHAPTER 3: CONCLUSION AND RECOMMENDATION 26
Paraphrase This Document
Need a fresh take? Get an instant paraphrase of this document with our AI Paraphraser

CFM-CW2-GROUP ASSIGNMENT
3.1 Management and McTavish & Smith Organizational
Structure
26
3.2 Recommendations 26
REFERENCE 29
APPENDIX I (Individual Views) 30
APPENDIX II (Minutes of Meeting) 36
List of Figures
Figure Title Page NO.
ii
3.1 Management and McTavish & Smith Organizational
Structure
26
3.2 Recommendations 26
REFERENCE 29
APPENDIX I (Individual Views) 30
APPENDIX II (Minutes of Meeting) 36
List of Figures
Figure Title Page NO.
ii
CFM-CW2-GROUP ASSIGNMENT
Figure 1: Value of Contracts 3
Figure 2: Gross Profit of Contracts 3
Figure 3: Gross Profit and Procurement Method 4
Figure 4: Gross Profit and Location 5
Figure 5: Gross profit and Contract Type 6
List of Tables
Table 1: Summary of Financial Contribute 1
Table 2: The Details of McTavish Companies Contracts 9
iii
⊘ This is a preview!⊘
Do you want full access?
Subscribe today to unlock all pages.
Trusted by 1+ million students worldwide
Chapter 1- Introduction
CHAPTER 1- INTRODUCTION
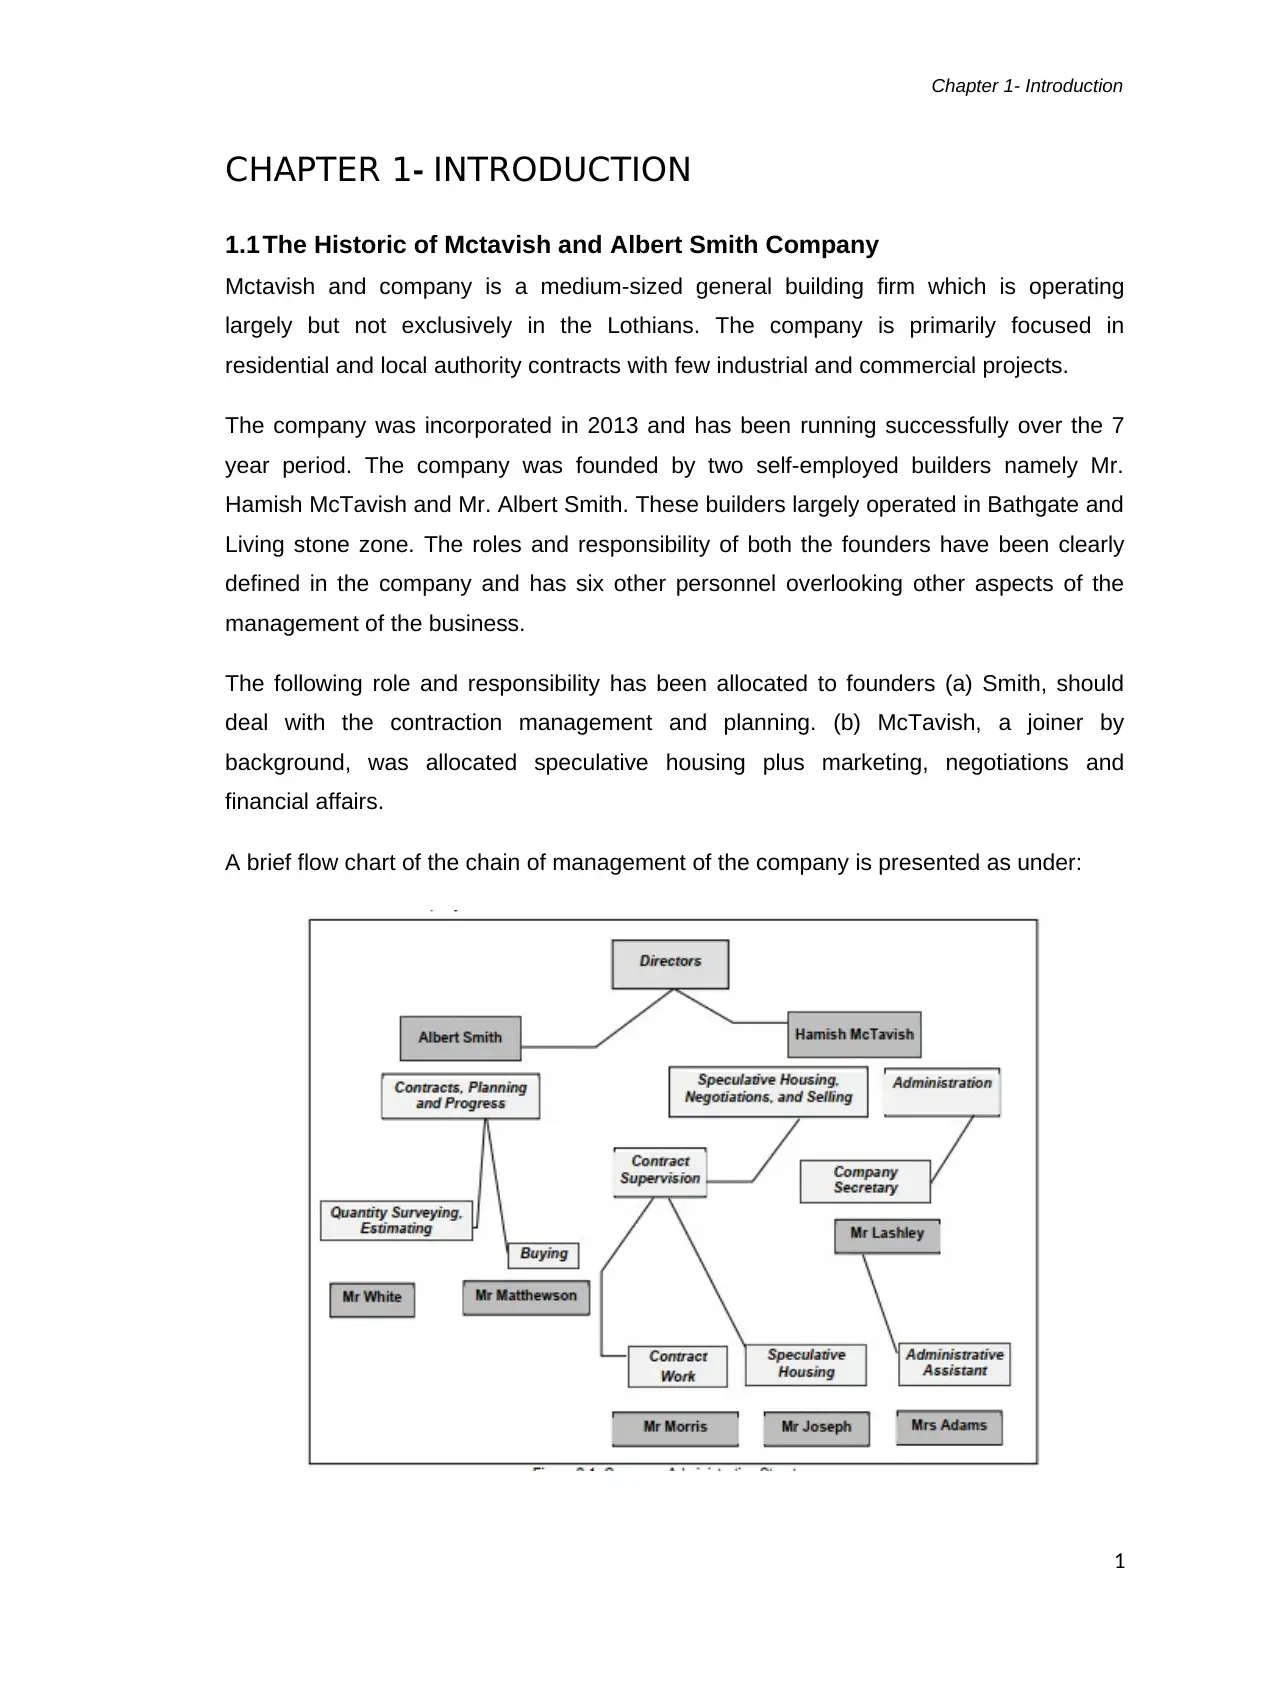
1.1 The Historic of Mctavish and Albert Smith Company
Mctavish and company is a medium-sized general building firm which is operating
largely but not exclusively in the Lothians. The company is primarily focused in
residential and local authority contracts with few industrial and commercial projects.
The company was incorporated in 2013 and has been running successfully over the 7
year period. The company was founded by two self-employed builders namely Mr.
Hamish McTavish and Mr. Albert Smith. These builders largely operated in Bathgate and
Living stone zone. The roles and responsibility of both the founders have been clearly
defined in the company and has six other personnel overlooking other aspects of the
management of the business.
The following role and responsibility has been allocated to founders (a) Smith, should
deal with the contraction management and planning. (b) McTavish, a joiner by
background, was allocated speculative housing plus marketing, negotiations and
financial affairs.
A brief flow chart of the chain of management of the company is presented as under:
1
CHAPTER 1- INTRODUCTION
1.1 The Historic of Mctavish and Albert Smith Company
Mctavish and company is a medium-sized general building firm which is operating
largely but not exclusively in the Lothians. The company is primarily focused in
residential and local authority contracts with few industrial and commercial projects.
The company was incorporated in 2013 and has been running successfully over the 7
year period. The company was founded by two self-employed builders namely Mr.
Hamish McTavish and Mr. Albert Smith. These builders largely operated in Bathgate and
Living stone zone. The roles and responsibility of both the founders have been clearly
defined in the company and has six other personnel overlooking other aspects of the
management of the business.
The following role and responsibility has been allocated to founders (a) Smith, should
deal with the contraction management and planning. (b) McTavish, a joiner by
background, was allocated speculative housing plus marketing, negotiations and
financial affairs.
A brief flow chart of the chain of management of the company is presented as under:
1
Paraphrase This Document
Need a fresh take? Get an instant paraphrase of this document with our AI Paraphraser
Chapter 1- Introduction
1.2 The Initial Investment of Company
The following capital investment in the proposed company has been done by the
founders in the wake of creation of the new company:
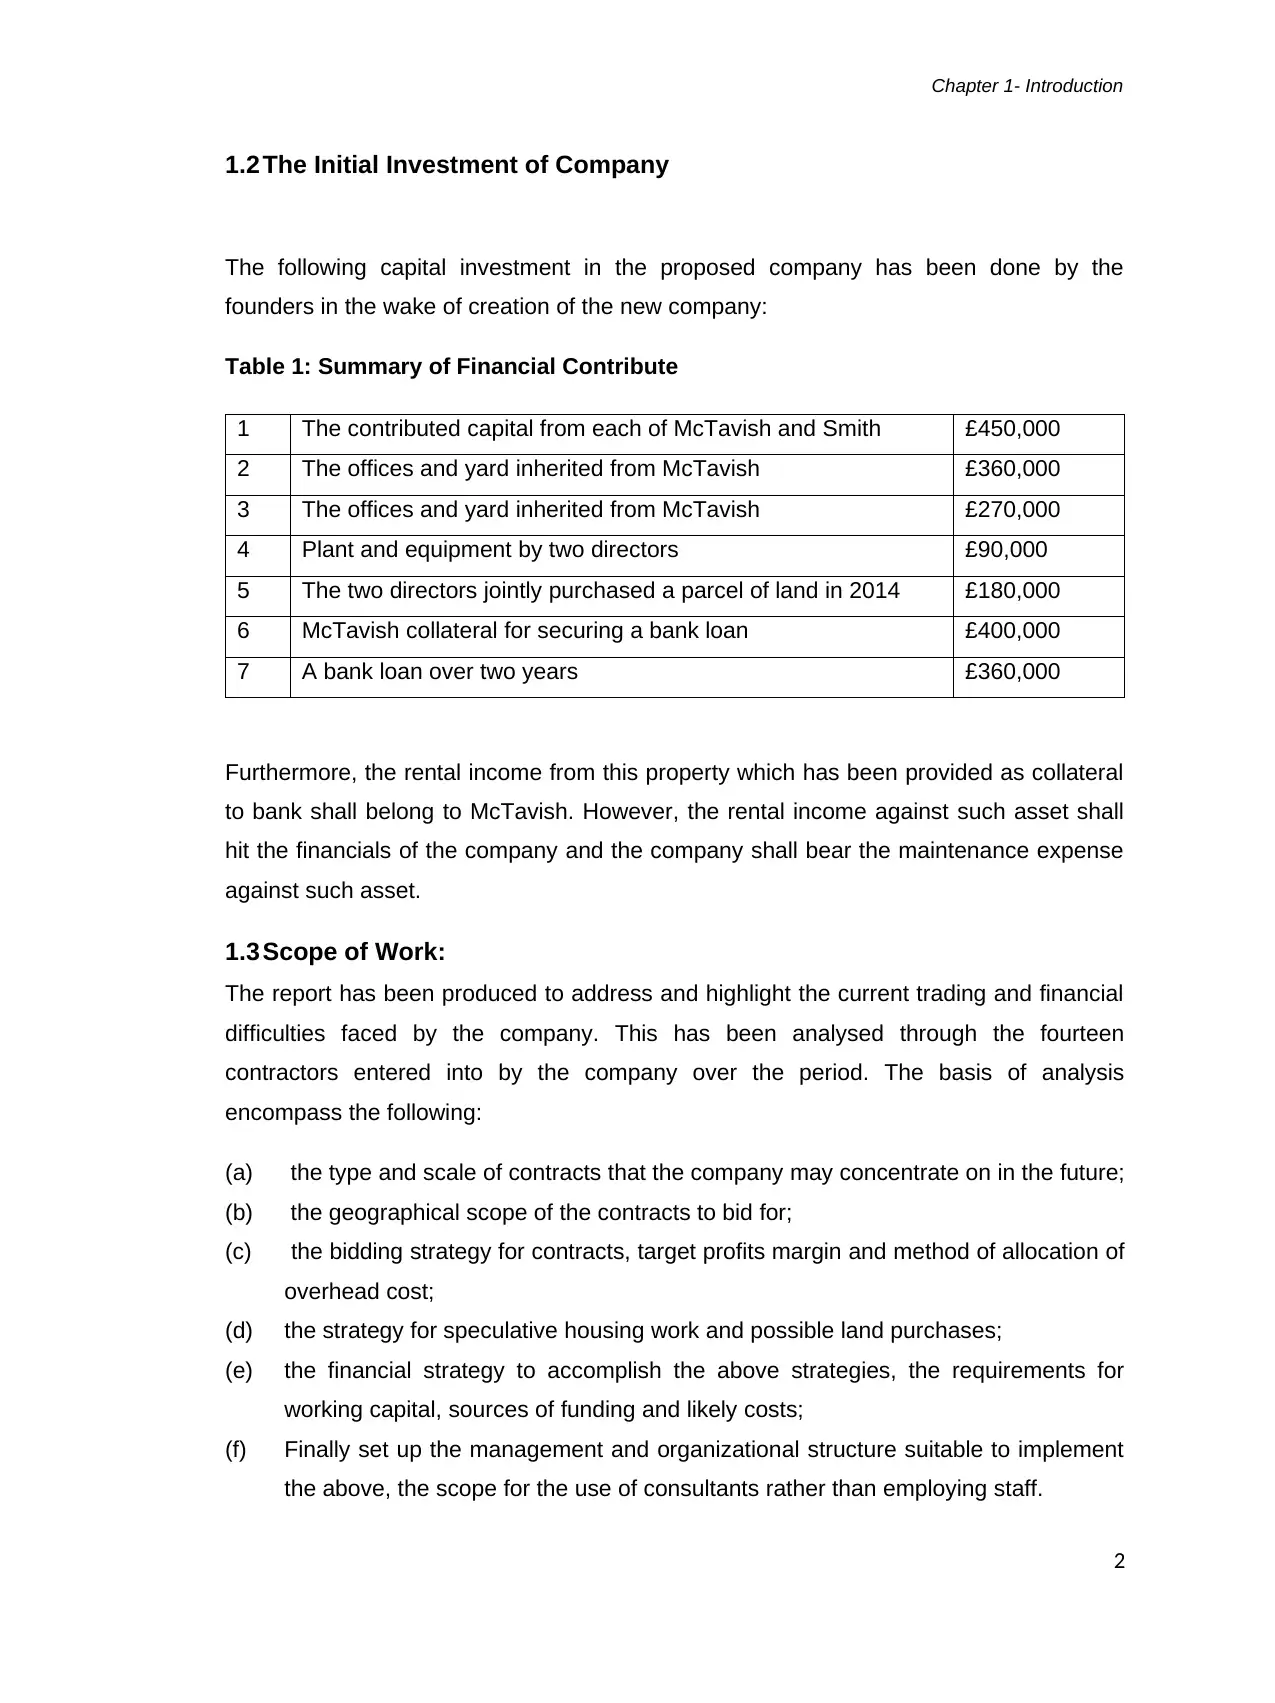
Table 1: Summary of Financial Contribute
1 The contributed capital from each of McTavish and Smith £450,000
2 The offices and yard inherited from McTavish £360,000
3 The offices and yard inherited from McTavish £270,000
4 Plant and equipment by two directors £90,000
5 The two directors jointly purchased a parcel of land in 2014 £180,000
6 McTavish collateral for securing a bank loan £400,000
7 A bank loan over two years £360,000
Furthermore, the rental income from this property which has been provided as collateral
to bank shall belong to McTavish. However, the rental income against such asset shall
hit the financials of the company and the company shall bear the maintenance expense
against such asset.
1.3 Scope of Work:
The report has been produced to address and highlight the current trading and financial
difficulties faced by the company. This has been analysed through the fourteen
contractors entered into by the company over the period. The basis of analysis
encompass the following:
(a) the type and scale of contracts that the company may concentrate on in the future;
(b) the geographical scope of the contracts to bid for;
(c) the bidding strategy for contracts, target profits margin and method of allocation of
overhead cost;
(d) the strategy for speculative housing work and possible land purchases;
(e) the financial strategy to accomplish the above strategies, the requirements for
working capital, sources of funding and likely costs;
(f) Finally set up the management and organizational structure suitable to implement
the above, the scope for the use of consultants rather than employing staff.
2
1.2 The Initial Investment of Company
The following capital investment in the proposed company has been done by the
founders in the wake of creation of the new company:
Table 1: Summary of Financial Contribute
1 The contributed capital from each of McTavish and Smith £450,000
2 The offices and yard inherited from McTavish £360,000
3 The offices and yard inherited from McTavish £270,000
4 Plant and equipment by two directors £90,000
5 The two directors jointly purchased a parcel of land in 2014 £180,000
6 McTavish collateral for securing a bank loan £400,000
7 A bank loan over two years £360,000
Furthermore, the rental income from this property which has been provided as collateral
to bank shall belong to McTavish. However, the rental income against such asset shall
hit the financials of the company and the company shall bear the maintenance expense
against such asset.
1.3 Scope of Work:
The report has been produced to address and highlight the current trading and financial
difficulties faced by the company. This has been analysed through the fourteen
contractors entered into by the company over the period. The basis of analysis
encompass the following:
(a) the type and scale of contracts that the company may concentrate on in the future;
(b) the geographical scope of the contracts to bid for;
(c) the bidding strategy for contracts, target profits margin and method of allocation of
overhead cost;
(d) the strategy for speculative housing work and possible land purchases;
(e) the financial strategy to accomplish the above strategies, the requirements for
working capital, sources of funding and likely costs;
(f) Finally set up the management and organizational structure suitable to implement
the above, the scope for the use of consultants rather than employing staff.
2

Chapter 1- Introduction
3
3
⊘ This is a preview!⊘
Do you want full access?
Subscribe today to unlock all pages.
Trusted by 1+ million students worldwide
Chapter 3- Conclusion and Recommendation
CHAPTER 2- DISCUSSION, ANALYSIS AND RESULTS
2.1 General History Analysis
1 2 3 4 5 6 7 8 9 10 11 12 13 14
0
2000000
4000000
6000000
8000000
10000000
12000000
1 2 3 4 9 5 6 7 8 10 11 12 13 14
864,000
2,115,000
333,000
315,000
1,620,000
10,560,000
2,493,000
1,458,000
9,348,000
360,000
1,620,000
9,110,000
4,410,000
1,878,000
Value in Sterling
Contract No Value
Contract
Value
Figure 1: Value of Contracts
0 1 2 3 4 5 6 7 8 9 10 11 12 13 14 15
-40.00%
-20.00%
0.00%
20.00%
40.00%
60.00%
80.00%
15.66%
25.00%
60.87%
0.00%
12.50%
-0.06%
19.40%
24.62%
5.99%
25.00%
5.88%
-4.35%
-26.53%
4.35%
Gross Profit
Contract No
Gross Margin
Figure 2: Gross Profit of Contracts
4
Paraphrase This Document
Need a fresh take? Get an instant paraphrase of this document with our AI Paraphraser
Chapter 3- Conclusion and Recommendation
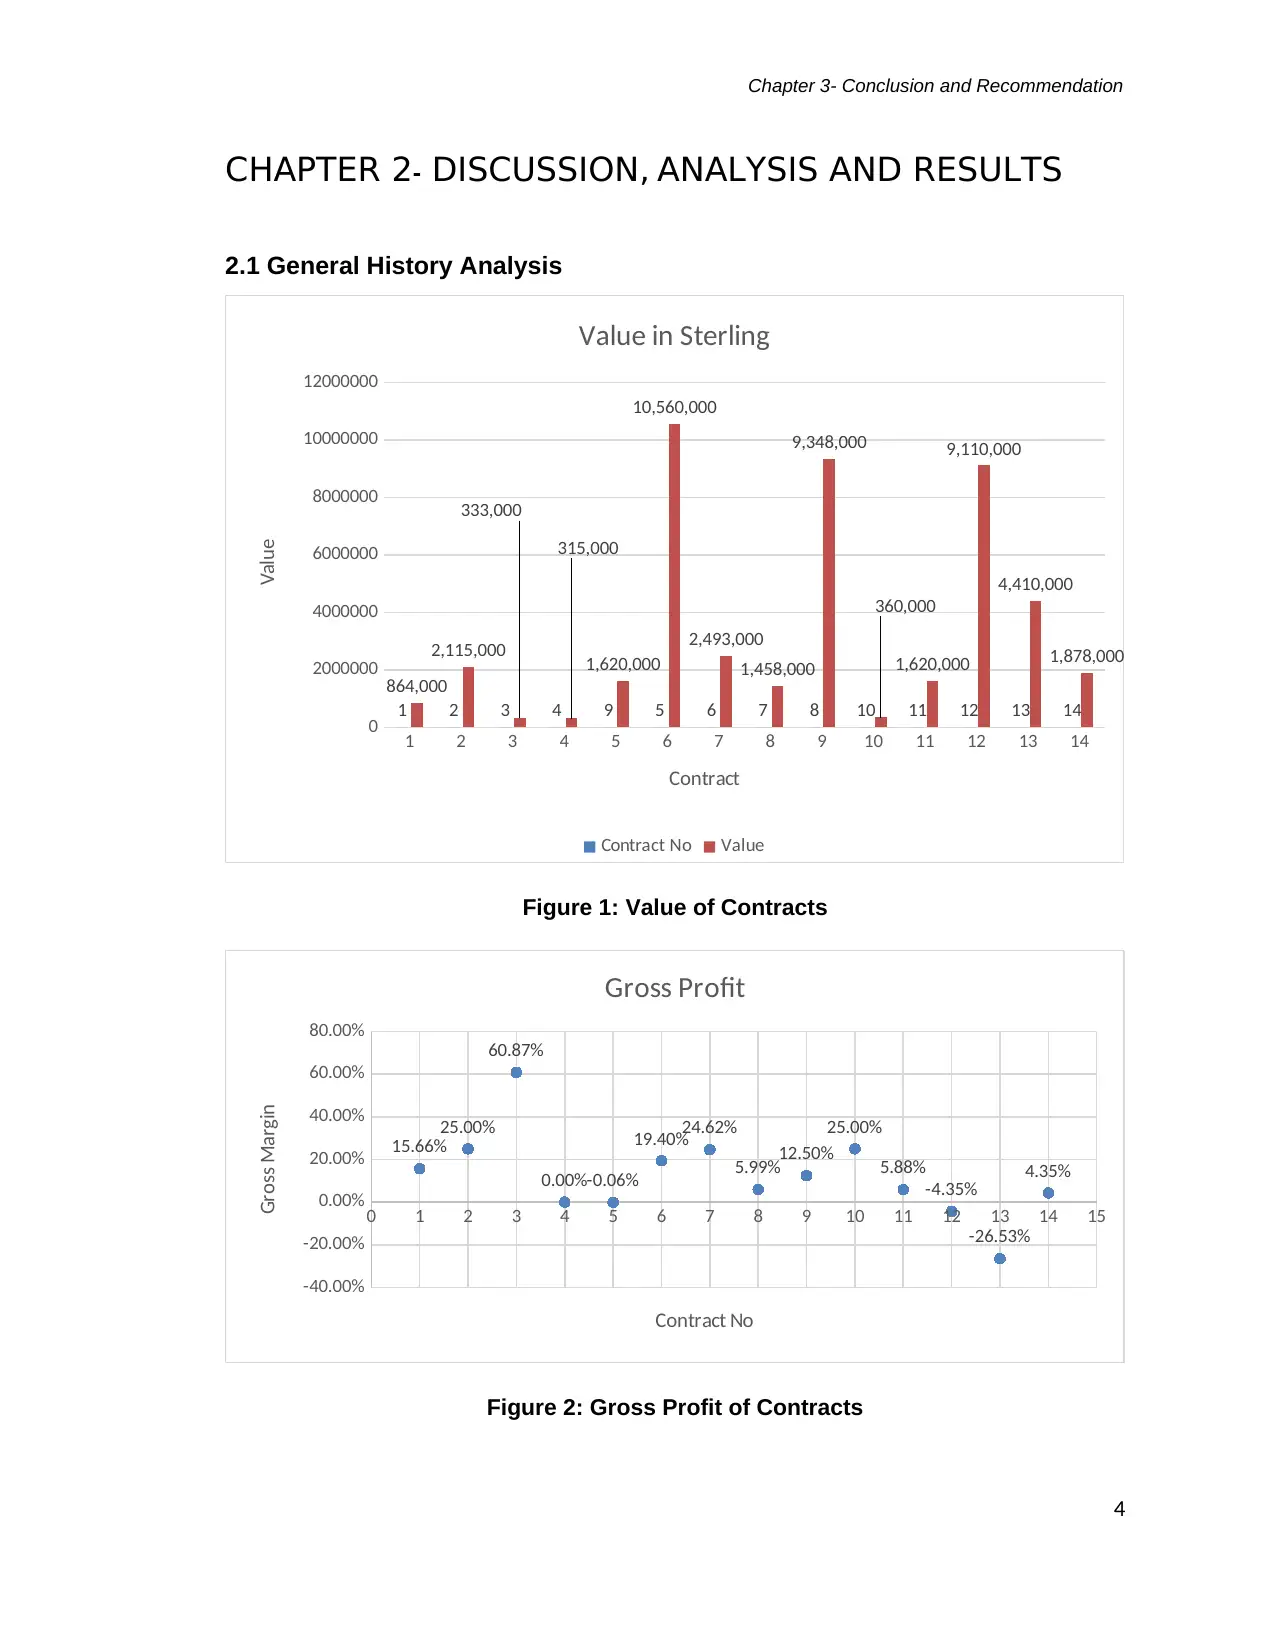
On perusal of the above charts and data as enclosed in excel, it may be inferred that the
highest three contracts values were for Contracts C6, C9 and C12. On the other hand,
the lowest three contract values where for C4, C3 and C10 as Shown above. However,
the highest value does not necessarily guarantee that the project will generate the
highest return. As shown above, the highest gross profit percentage is 60.87% that has
been achieved in contract C3. Further, one should note that the contract C3 was one of
the lowest contracts values but the profit was highest amongst all the contracts entered
into by the company over the period of analysis. On the other hand, contract C6 had the
highest value of £10,560,000 but there was a loss of -0.06%. In an average, it was
noticed that the projects with value range between £333,000 and £9,348,000 can
produce good profit percentage without loss. However, in contract C9, there was good
gross profit of 12.50% but the duration of the project is too long.
The highest loss was in contract C13 with -26.53% as the gross profit margin and the
valuation of loss stood at £ (-) 11,70,000. However, this was due to the insolvency of the
client.
5
Negotiated Open Tender Sale Selectve Tender Speculative
-0.1
0
0.1
0.2
0.3
0.4
0.5
Average of Gross Profit by Procurement
Chapter 3- Conclusion and Recommendation
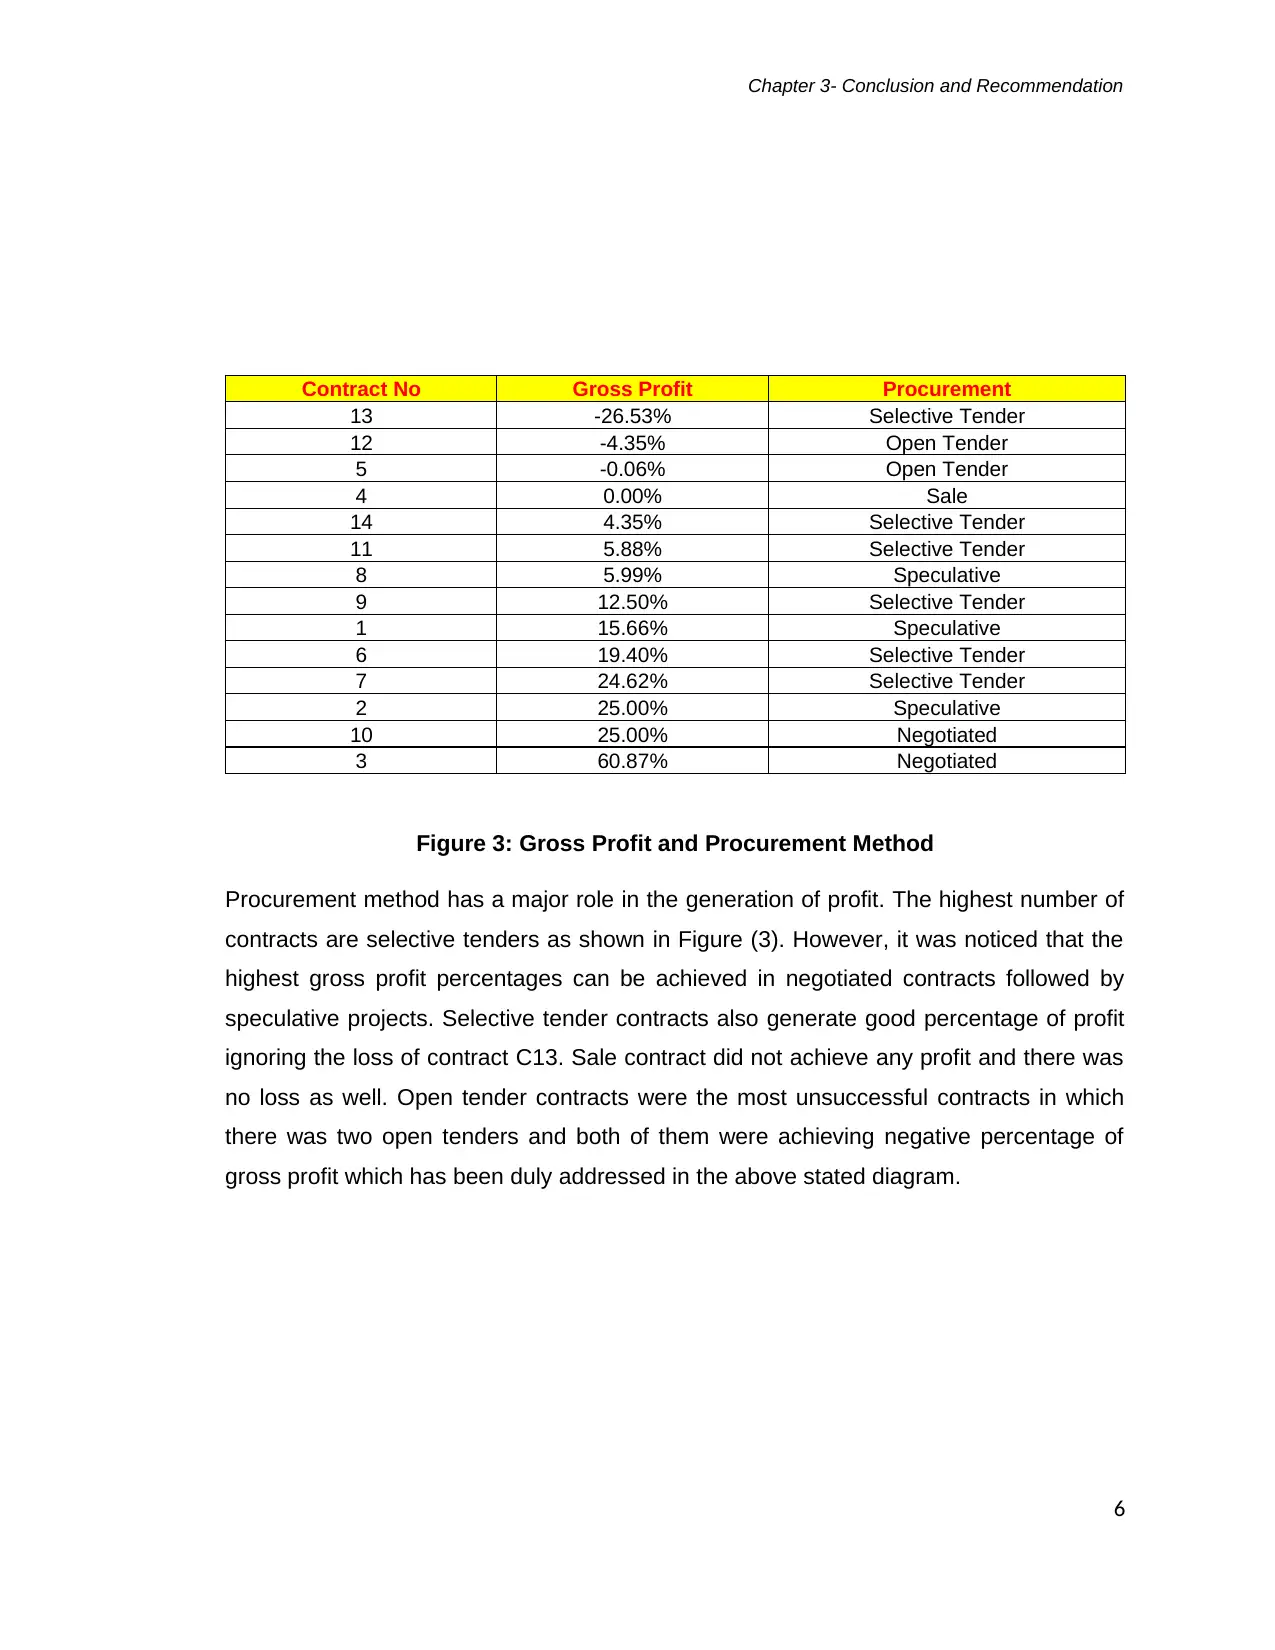
Contract No Gross Profit Procurement
13 -26.53% Selective Tender
12 -4.35% Open Tender
5 -0.06% Open Tender
4 0.00% Sale
14 4.35% Selective Tender
11 5.88% Selective Tender
8 5.99% Speculative
9 12.50% Selective Tender
1 15.66% Speculative
6 19.40% Selective Tender
7 24.62% Selective Tender
2 25.00% Speculative
10 25.00% Negotiated
3 60.87% Negotiated
Figure 3: Gross Profit and Procurement Method
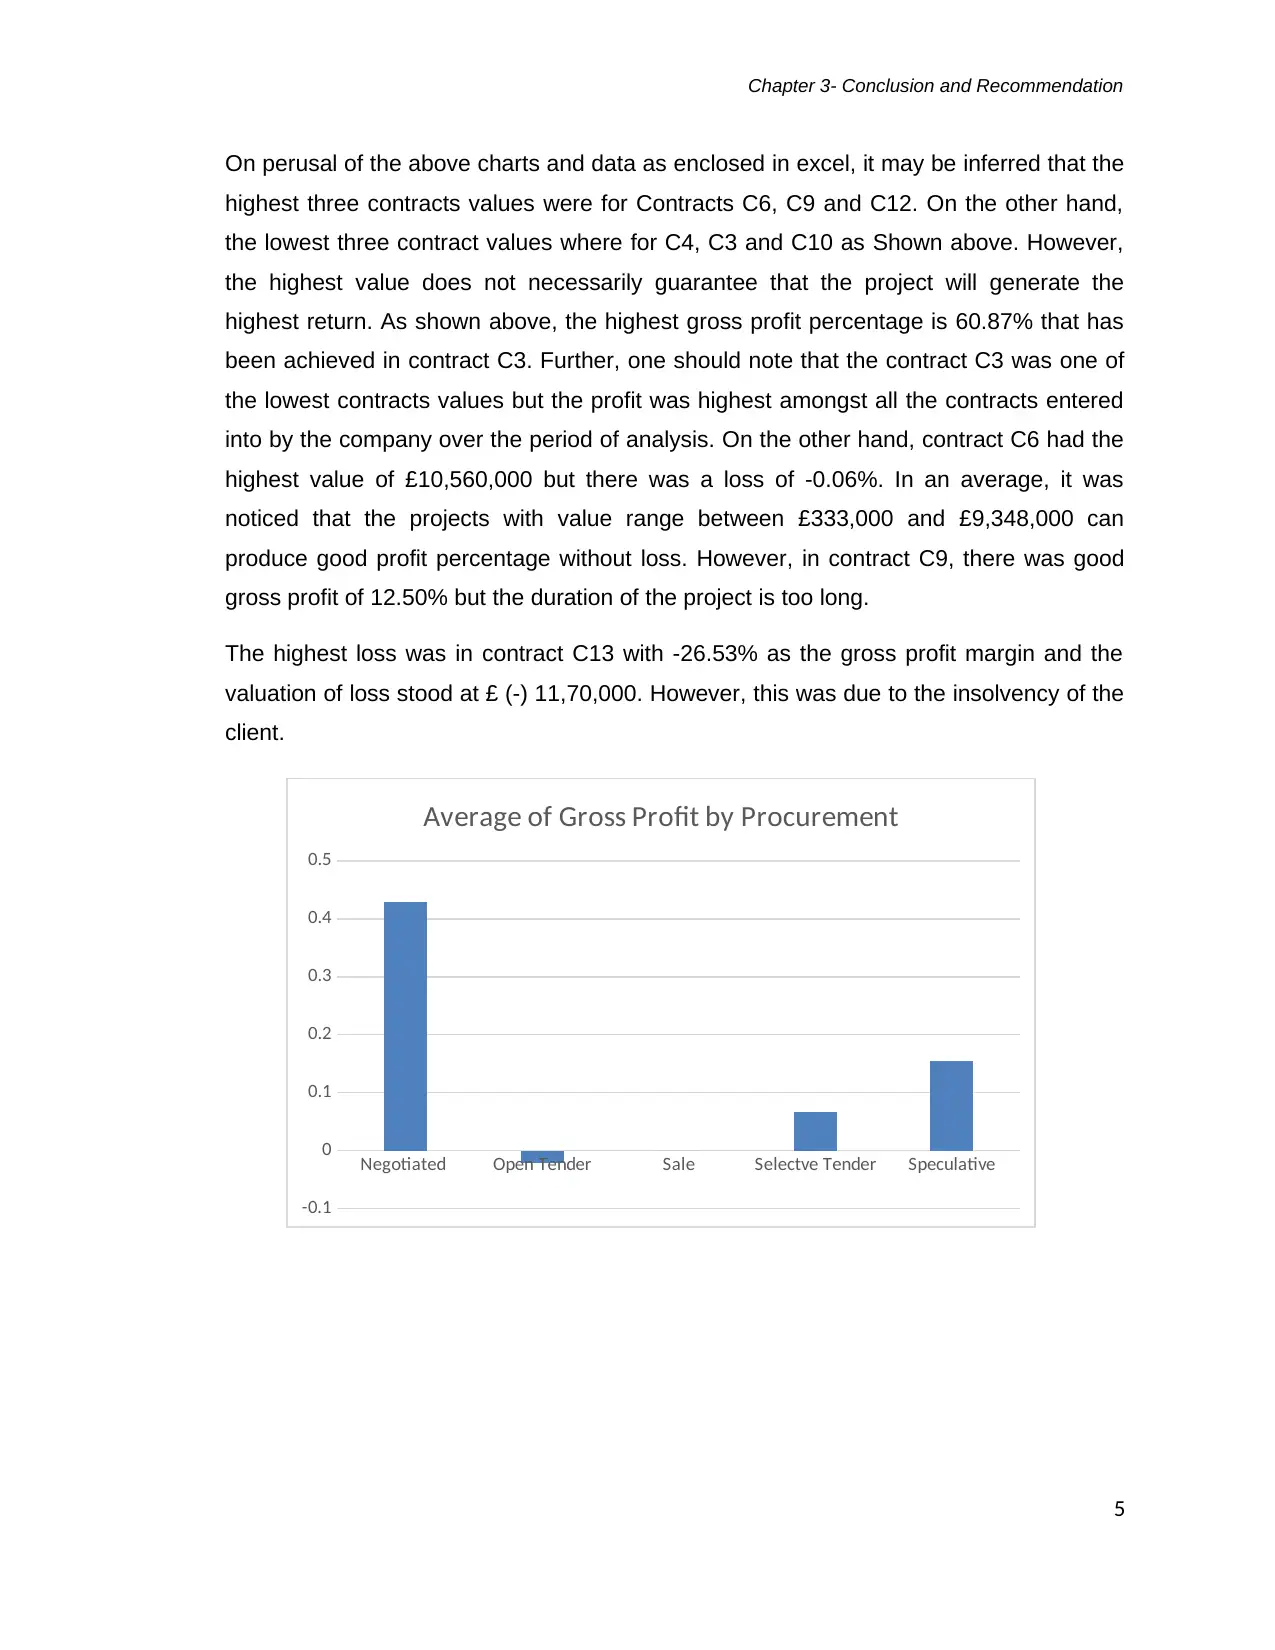
Procurement method has a major role in the generation of profit. The highest number of
contracts are selective tenders as shown in Figure (3). However, it was noticed that the
highest gross profit percentages can be achieved in negotiated contracts followed by
speculative projects. Selective tender contracts also generate good percentage of profit
ignoring the loss of contract C13. Sale contract did not achieve any profit and there was
no loss as well. Open tender contracts were the most unsuccessful contracts in which
there was two open tenders and both of them were achieving negative percentage of
gross profit which has been duly addressed in the above stated diagram.
6
Contract No Gross Profit Procurement
13 -26.53% Selective Tender
12 -4.35% Open Tender
5 -0.06% Open Tender
4 0.00% Sale
14 4.35% Selective Tender
11 5.88% Selective Tender
8 5.99% Speculative
9 12.50% Selective Tender
1 15.66% Speculative
6 19.40% Selective Tender
7 24.62% Selective Tender
2 25.00% Speculative
10 25.00% Negotiated
3 60.87% Negotiated
Figure 3: Gross Profit and Procurement Method
Procurement method has a major role in the generation of profit. The highest number of
contracts are selective tenders as shown in Figure (3). However, it was noticed that the
highest gross profit percentages can be achieved in negotiated contracts followed by
speculative projects. Selective tender contracts also generate good percentage of profit
ignoring the loss of contract C13. Sale contract did not achieve any profit and there was
no loss as well. Open tender contracts were the most unsuccessful contracts in which
there was two open tenders and both of them were achieving negative percentage of
gross profit which has been duly addressed in the above stated diagram.
6
⊘ This is a preview!⊘
Do you want full access?
Subscribe today to unlock all pages.
Trusted by 1+ million students worldwide
Chapter 3- Conclusion and Recommendation
Armadale Bathgate Blackridge livingston West Calder Whitburn
-40%
-20%
0%
20%
40%
60%
80%
0.25
0.2461538461
53846 16%
61%
19%
6%
13% 4%
-
0.0435267857
142857
0
0.25
-
0.2653061224
4898
0.0588235294
117647
-
0.0005678591
7092561
Location Wise
1 2
3 4
5 6
7 8
9 10
11 12
13 14
Location
Margin
Figure 4: Gross Profit and Location
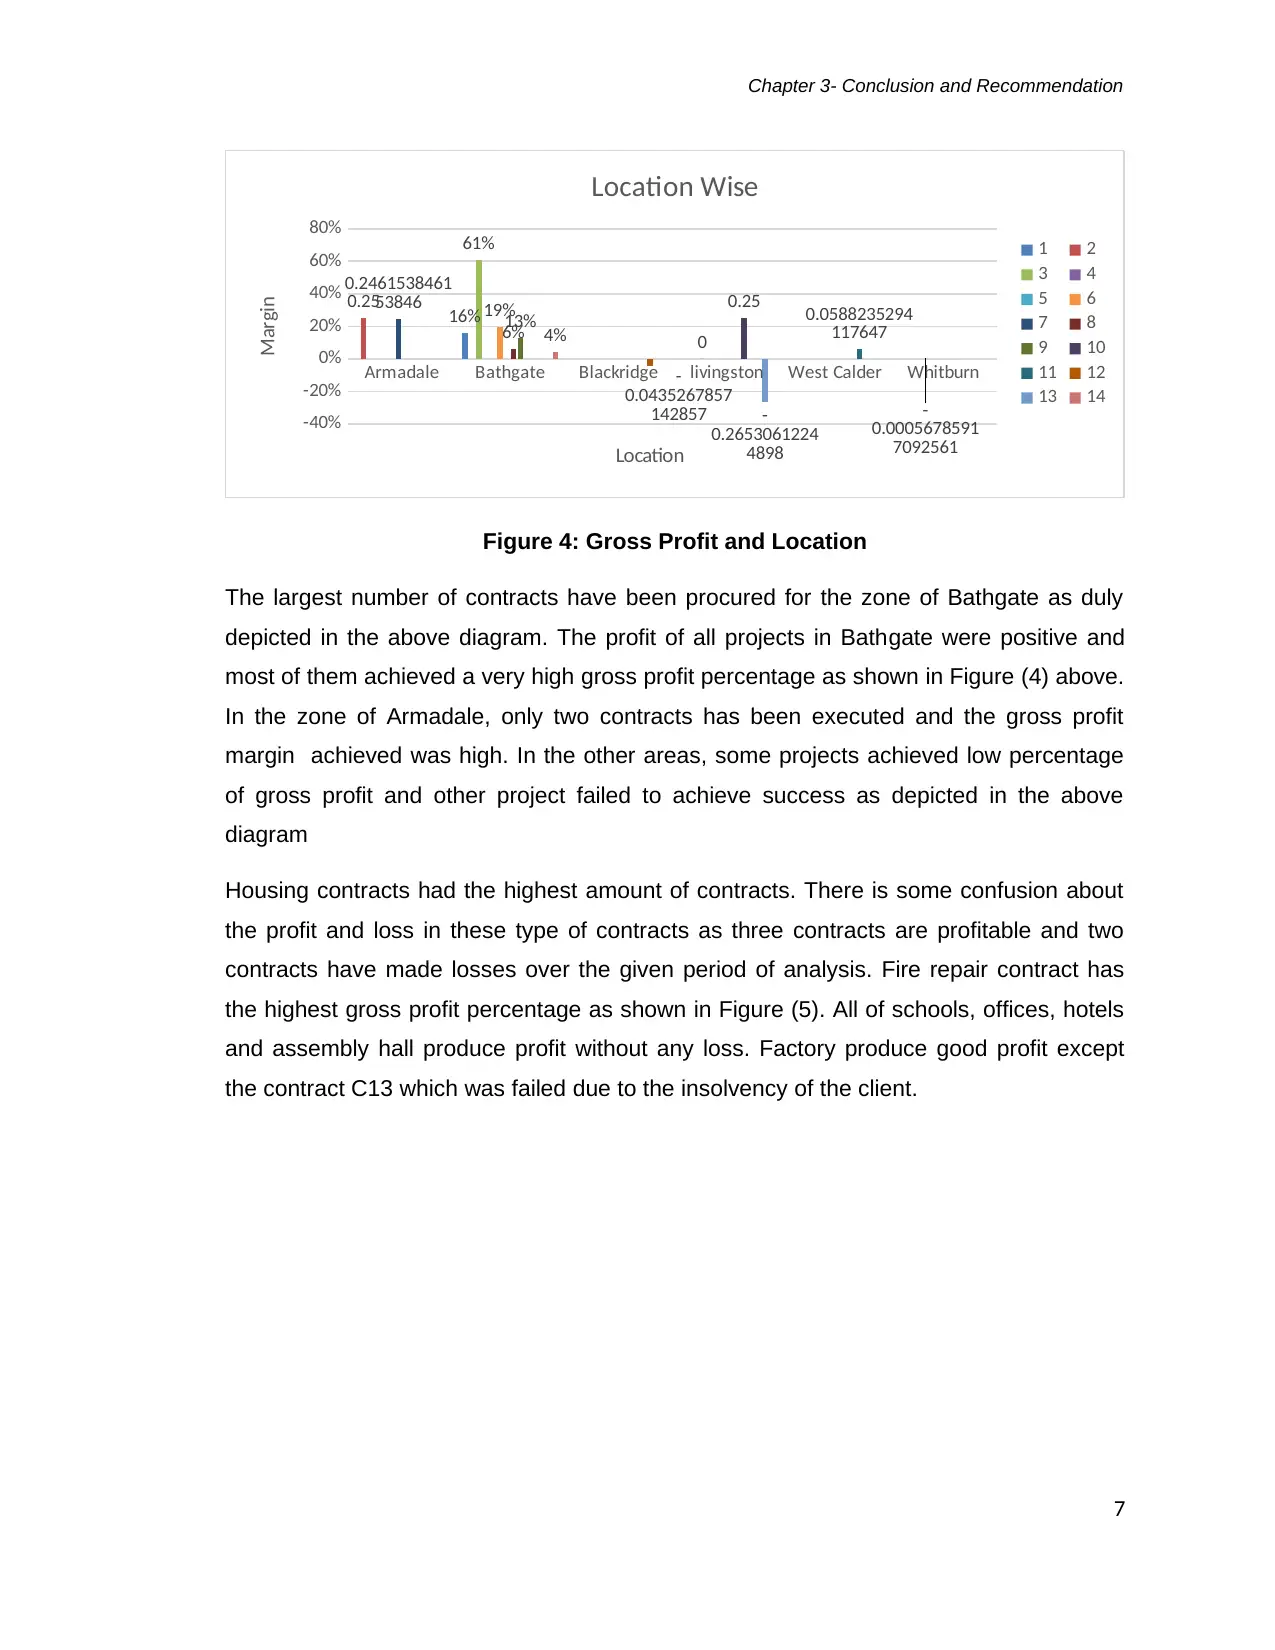
The largest number of contracts have been procured for the zone of Bathgate as duly
depicted in the above diagram. The profit of all projects in Bathgate were positive and
most of them achieved a very high gross profit percentage as shown in Figure (4) above.
In the zone of Armadale, only two contracts has been executed and the gross profit
margin achieved was high. In the other areas, some projects achieved low percentage
of gross profit and other project failed to achieve success as depicted in the above
diagram
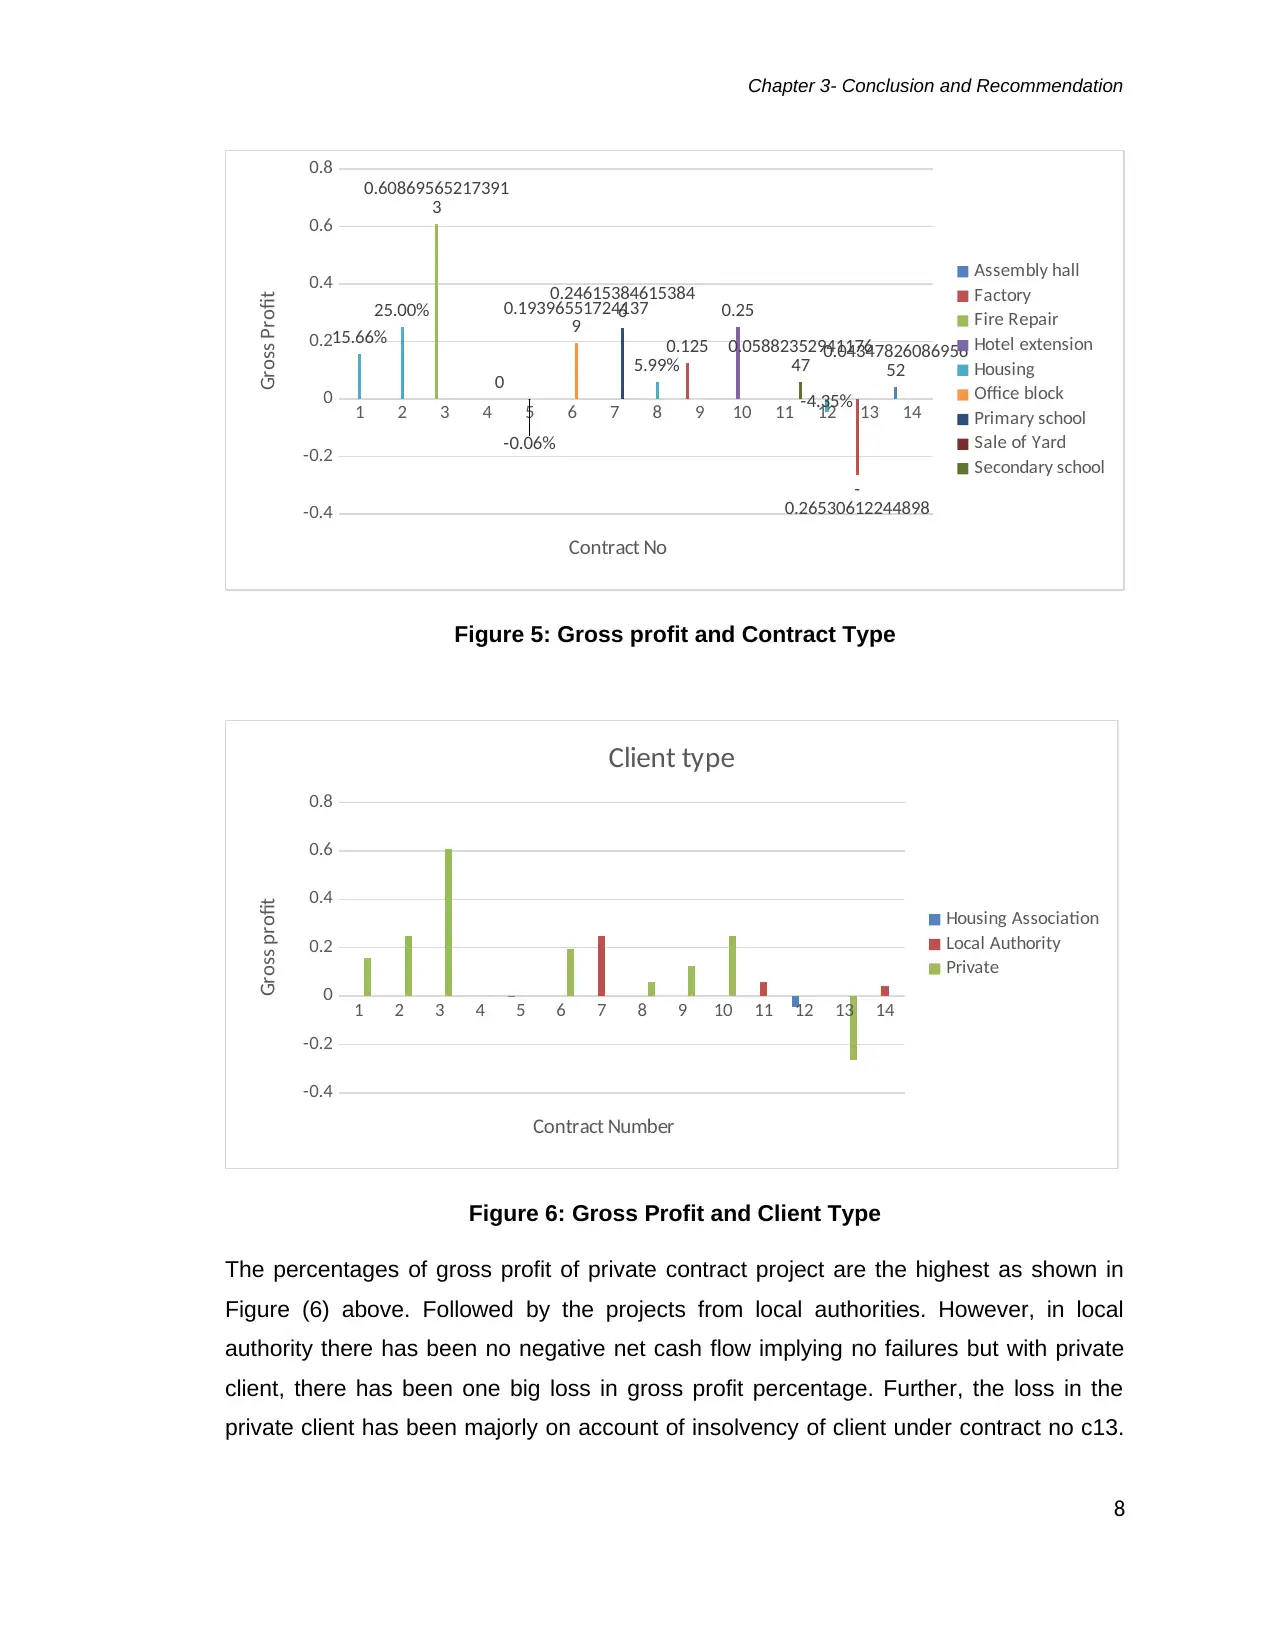
Housing contracts had the highest amount of contracts. There is some confusion about
the profit and loss in these type of contracts as three contracts are profitable and two
contracts have made losses over the given period of analysis. Fire repair contract has
the highest gross profit percentage as shown in Figure (5). All of schools, offices, hotels
and assembly hall produce profit without any loss. Factory produce good profit except
the contract C13 which was failed due to the insolvency of the client.
7
Armadale Bathgate Blackridge livingston West Calder Whitburn
-40%
-20%
0%
20%
40%
60%
80%
0.25
0.2461538461
53846 16%
61%
19%
6%
13% 4%
-
0.0435267857
142857
0
0.25
-
0.2653061224
4898
0.0588235294
117647
-
0.0005678591
7092561
Location Wise
1 2
3 4
5 6
7 8
9 10
11 12
13 14
Location
Margin
Figure 4: Gross Profit and Location
The largest number of contracts have been procured for the zone of Bathgate as duly
depicted in the above diagram. The profit of all projects in Bathgate were positive and
most of them achieved a very high gross profit percentage as shown in Figure (4) above.
In the zone of Armadale, only two contracts has been executed and the gross profit
margin achieved was high. In the other areas, some projects achieved low percentage
of gross profit and other project failed to achieve success as depicted in the above
diagram
Housing contracts had the highest amount of contracts. There is some confusion about
the profit and loss in these type of contracts as three contracts are profitable and two
contracts have made losses over the given period of analysis. Fire repair contract has
the highest gross profit percentage as shown in Figure (5). All of schools, offices, hotels
and assembly hall produce profit without any loss. Factory produce good profit except
the contract C13 which was failed due to the insolvency of the client.
7
Paraphrase This Document
Need a fresh take? Get an instant paraphrase of this document with our AI Paraphraser
Chapter 3- Conclusion and Recommendation
1 2 3 4 5 6 7 8 9 10 11 12 13 14
-0.4
-0.2
0
0.2
0.4
0.6
0.8
15.66%
25.00%
-0.06%
5.99%
-4.35%
0.60869565217391
3
0
0.19396551724137
9
0.24615384615384
6
0.125
-
0.26530612244898
0.25
0.05882352941176
47 0.04347826086956
52
Assembly hall
Factory
Fire Repair
Hotel extension
Housing
Office block
Primary school
Sale of Yard
Secondary school
Contract No
Gross Profit
Figure 5: Gross profit and Contract Type
1 2 3 4 5 6 7 8 9 10 11 12 13 14
-0.4
-0.2
0
0.2
0.4
0.6
0.8
Client type
Housing Association
Local Authority
Private
Contract Number
Gross profit
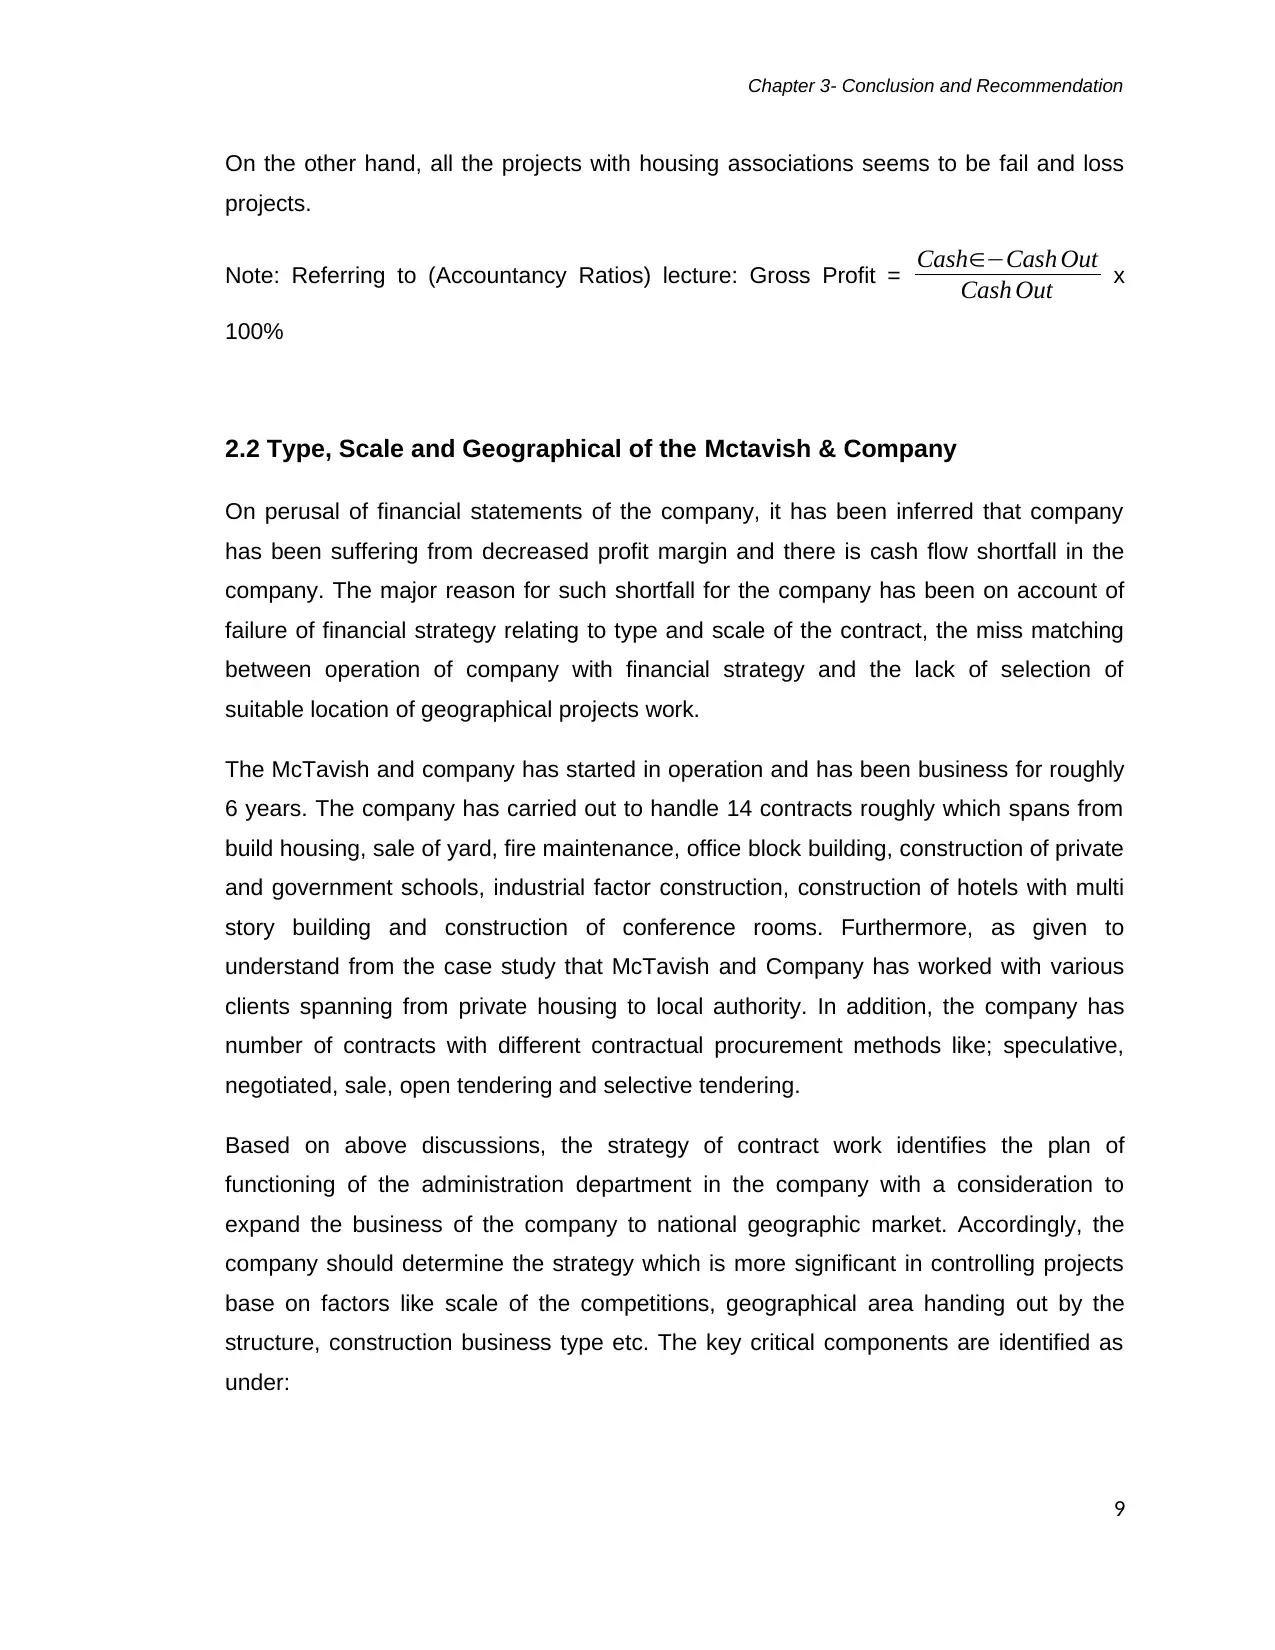
Figure 6: Gross Profit and Client Type
The percentages of gross profit of private contract project are the highest as shown in
Figure (6) above. Followed by the projects from local authorities. However, in local
authority there has been no negative net cash flow implying no failures but with private
client, there has been one big loss in gross profit percentage. Further, the loss in the
private client has been majorly on account of insolvency of client under contract no c13.
8
1 2 3 4 5 6 7 8 9 10 11 12 13 14
-0.4
-0.2
0
0.2
0.4
0.6
0.8
15.66%
25.00%
-0.06%
5.99%
-4.35%
0.60869565217391
3
0
0.19396551724137
9
0.24615384615384
6
0.125
-
0.26530612244898
0.25
0.05882352941176
47 0.04347826086956
52
Assembly hall
Factory
Fire Repair
Hotel extension
Housing
Office block
Primary school
Sale of Yard
Secondary school
Contract No
Gross Profit
Figure 5: Gross profit and Contract Type
1 2 3 4 5 6 7 8 9 10 11 12 13 14
-0.4
-0.2
0
0.2
0.4
0.6
0.8
Client type
Housing Association
Local Authority
Private
Contract Number
Gross profit
Figure 6: Gross Profit and Client Type
The percentages of gross profit of private contract project are the highest as shown in
Figure (6) above. Followed by the projects from local authorities. However, in local
authority there has been no negative net cash flow implying no failures but with private
client, there has been one big loss in gross profit percentage. Further, the loss in the
private client has been majorly on account of insolvency of client under contract no c13.
8
Chapter 3- Conclusion and Recommendation
On the other hand, all the projects with housing associations seems to be fail and loss
projects.
Note: Referring to (Accountancy Ratios) lecture: Gross Profit = Cash∈−Cash Out
Cash Out x
100%
2.2 Type, Scale and Geographical of the Mctavish & Company
On perusal of financial statements of the company, it has been inferred that company
has been suffering from decreased profit margin and there is cash flow shortfall in the
company. The major reason for such shortfall for the company has been on account of
failure of financial strategy relating to type and scale of the contract, the miss matching
between operation of company with financial strategy and the lack of selection of
suitable location of geographical projects work.
The McTavish and company has started in operation and has been business for roughly
6 years. The company has carried out to handle 14 contracts roughly which spans from
build housing, sale of yard, fire maintenance, office block building, construction of private
and government schools, industrial factor construction, construction of hotels with multi
story building and construction of conference rooms. Furthermore, as given to
understand from the case study that McTavish and Company has worked with various
clients spanning from private housing to local authority. In addition, the company has
number of contracts with different contractual procurement methods like; speculative,
negotiated, sale, open tendering and selective tendering.
Based on above discussions, the strategy of contract work identifies the plan of
functioning of the administration department in the company with a consideration to
expand the business of the company to national geographic market. Accordingly, the
company should determine the strategy which is more significant in controlling projects
base on factors like scale of the competitions, geographical area handing out by the
structure, construction business type etc. The key critical components are identified as
under:
9
⊘ This is a preview!⊘
Do you want full access?
Subscribe today to unlock all pages.
Trusted by 1+ million students worldwide
1 out of 20
Your All-in-One AI-Powered Toolkit for Academic Success.
+13062052269
info@desklib.com
Available 24*7 on WhatsApp / Email
![[object Object]](/_next/static/media/star-bottom.7253800d.svg)
Unlock your academic potential
Copyright © 2020–2026 A2Z Services. All Rights Reserved. Developed and managed by ZUCOL.