An Analysis of Measuring Historical Risk and Return in Finance
VerifiedAdded on 2020/07/22
|8
|2177
|110
Report
AI Summary
This report provides a literature review on the appropriate methods for measuring historical risk and return in investments. It begins by introducing the core concepts of risk and return, emphasizing their significance in investment decisions. The report then delves into various measurement techniques, including standard deviation, magnitude of loss, beta, and value at risk (VAR), evaluating their effectiveness and limitations. Furthermore, the report explores the risk-return trade-off, discussing its implications for investment strategies and decision-making. It examines the Capital Asset Pricing Model (CAPM) and its application in assessing risk and return, particularly in the context of Exchange-Traded Funds (ETFs). The report concludes by identifying a research gap and highlighting the need for further investigation into the measurement of risk and return within specific financial instruments such as the SPDR® S&P®/ASX 200.

What is appropriate way to measure
historical risk and return?
historical risk and return?
Paraphrase This Document
Need a fresh take? Get an instant paraphrase of this document with our AI Paraphraser
TABLE OF CONTENTS
CHPATER 2: LITERATURE REVIEW.........................................................................................1
2.1 Introduction............................................................................................................................1
2.2 Appropriate methods to measure risk and return...................................................................1
2.3 Ways to analyze the risk-return trade-off (RRT) in Exchange-Traded fund.........................2
2.4 Research gap..........................................................................................................................4
REFERENCES................................................................................................................................5
CHPATER 2: LITERATURE REVIEW
2.1 Appropriate methods to measure risk and return
Jeffrey, Lévesque and Maxwell (2016, pp.189-209) stated in their study risk and return is
the main elements that closely associated with an investment. High value addition in the money
is one of the main objectives of investors when they decision in relation to investing money in
the securities or portfolio. In this regard, investors undertake several measures with the motive to
quantify the risk level and estimate the return associated with the securities. Sherwood and
Pollard (2017, pp. 1-19) defined several methods in their study that can be undertaken to
measure the risk level such as standard deviation, magnitude of loss etc. By doing investigation
author found that standard deviation is one of the most effectual measures that helps in assessing
the risk associated with an investment or portfolio. Moreover, standard deviation clearly reflects
the extent to which investment will be influenced from the average return. For example: If
standard deviation of ABC portfolio is 4% then it shows that in the near future return of the same
will either incline or decline with such limit from average return. In addition to this, by assessing
the magnitude of loss investor can also determine the risk level. For instance: It magnitude of
loss is 30% then it shows that value of fund will be declined with such rate. In this way, through
making assessment of standard deviation and loss magnitude investors can measure risk.
However, on the critical note, Mascareñas and Yan (2017, pp. 145-151) presented that
beta is the best measure that provides deeper insight about the volatility of investment or
portfolio. By undertaking such measure investors can identify the extent to which investment risk
is high or low in against to the market benchmark. Thus, by calculating the beta ratios investors
can assess the level to which specific investment is risky. Moreover, it is assumed that securities
with higher beta such as more than 1 are considered as risky over others. Liu and Zeng (2017,
pp.782-788) said that by calculating value at risk investors can make idea about the same and
thereby would become able to measure the likelihood of loss. Thus, by calculating VAR
investors can identify the level of portfolio loss in the best possible way.
⊘ This is a preview!⊘
Do you want full access?
Subscribe today to unlock all pages.
Trusted by 1+ million students worldwide
Montford and Goldsmith (2016, pp.101-106) depicted that by doing assessment of EPS
investment return can be identified by the investors. Earning higher return from the investments
is one of the main objectives of investors behind investing money. In this, by calculating such
measure investors can assess the trend of return. However, it is to be critically evaluated by
author, who said that EPS is not highly effectual measure because it avoids cash flow and
inflation rate (Limitations of earnings per share, 2016. In addition to this, accounting policies
that are employed by the companies highly differ from one to another. In this regard, it is not
possible for the investors to appropriately evaluate the historical returns of individual companies
on the basis of such measure. It has been assessed through investigation that PE ratio measure is
highly significant which in turn provides assistance in estimating the investment return in the
right direction (P/E ratio, 2017). It provides assistance to the investors in comparing the price of
stock with historical earnings per share.
By calculating such ratio analyst can make idea about the sentiments of investors. In this,
higher P/E ratio shows that investors are expecting higher growth and return in the near future.
Thus, by calculating P/E ratio investors can get information about the stock return and would
become able to appropriate evaluation of the same. On the contrary to this, Jeffrey, Lévesque and
Maxwell (2016, pp.189-209) examined that during inflationary trend P/E ratio is lower which
shows that such measure does not provide assistance to the investors in doing valuation of stock
during bear phase. Further, EPS is considered to measure or calculate P/E ratio, so there is the
risk that company will manipulate its earnings and thereby distort the outcome. Hence, by
undertaking all the above mentioned measures investors can measure and evaluate both risk as
well as return.
2.2 Ways to analyze the risk-return trade-off (RRT) in Exchange-Traded fund
Aslanidis, Christiansen and Savva (2016, pp.84-103) identified that trade off which is
facing by investors between risk and return at the time of taking investment decision termed as
risk RRT. In the case of investment, higher risk level entails that probability of attaining return is
greater. On the other side, lower risk level accounts for smaller return. This aspect clearly entails
that both the variables like risk and return are highly correlated. On the other side, Montford and
Goldsmith (2016, pp.101-106) considered the equation of higher risk equals to the greater return
as misconception. Moreover, risk-return trade off only entails that higher risk may result into
Paraphrase This Document
Need a fresh take? Get an instant paraphrase of this document with our AI Paraphraser
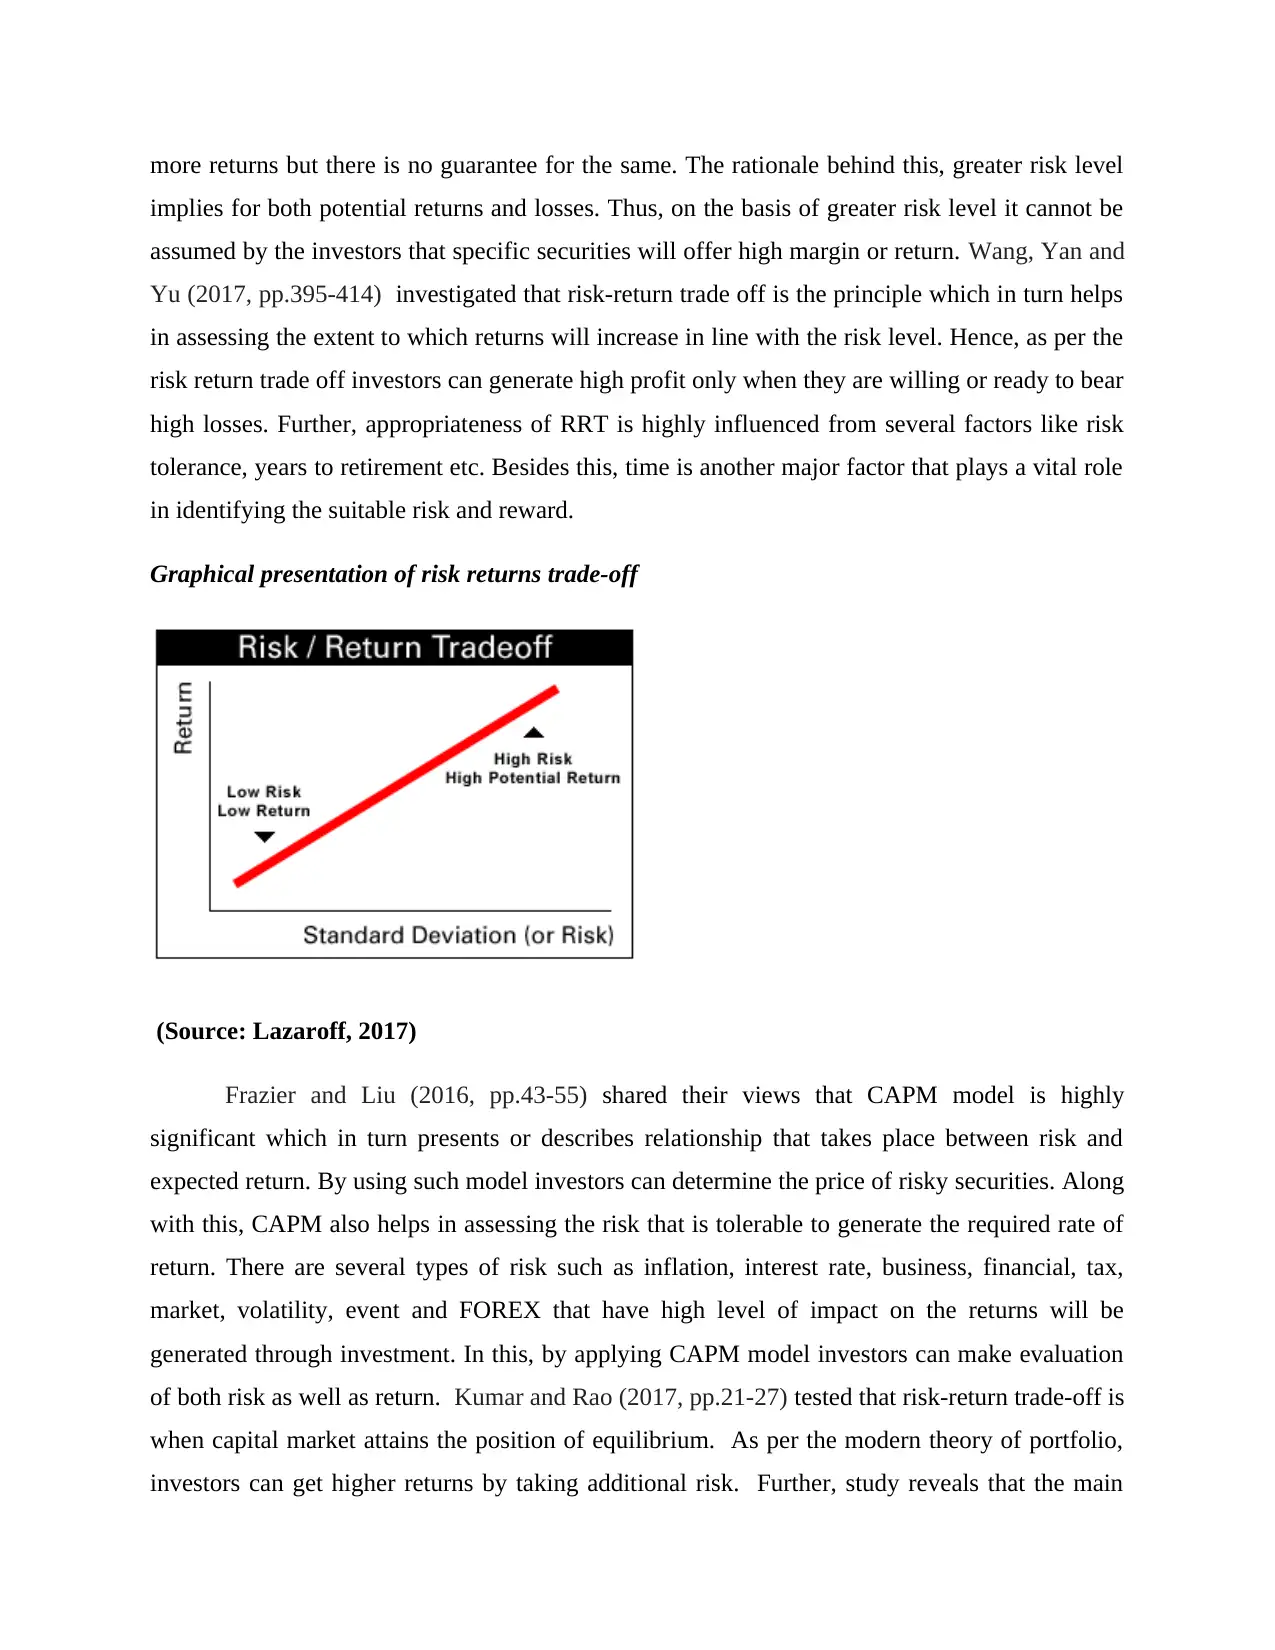
more returns but there is no guarantee for the same. The rationale behind this, greater risk level
implies for both potential returns and losses. Thus, on the basis of greater risk level it cannot be
assumed by the investors that specific securities will offer high margin or return. Wang, Yan and
Yu (2017, pp.395-414) investigated that risk-return trade off is the principle which in turn helps
in assessing the extent to which returns will increase in line with the risk level. Hence, as per the
risk return trade off investors can generate high profit only when they are willing or ready to bear
high losses. Further, appropriateness of RRT is highly influenced from several factors like risk
tolerance, years to retirement etc. Besides this, time is another major factor that plays a vital role
in identifying the suitable risk and reward.
Graphical presentation of risk returns trade-off
(Source: Lazaroff, 2017)
Frazier and Liu (2016, pp.43-55) shared their views that CAPM model is highly
significant which in turn presents or describes relationship that takes place between risk and
expected return. By using such model investors can determine the price of risky securities. Along
with this, CAPM also helps in assessing the risk that is tolerable to generate the required rate of
return. There are several types of risk such as inflation, interest rate, business, financial, tax,
market, volatility, event and FOREX that have high level of impact on the returns will be
generated through investment. In this, by applying CAPM model investors can make evaluation
of both risk as well as return. Kumar and Rao (2017, pp.21-27) tested that risk-return trade-off is
when capital market attains the position of equilibrium. As per the modern theory of portfolio,
investors can get higher returns by taking additional risk. Further, study reveals that the main
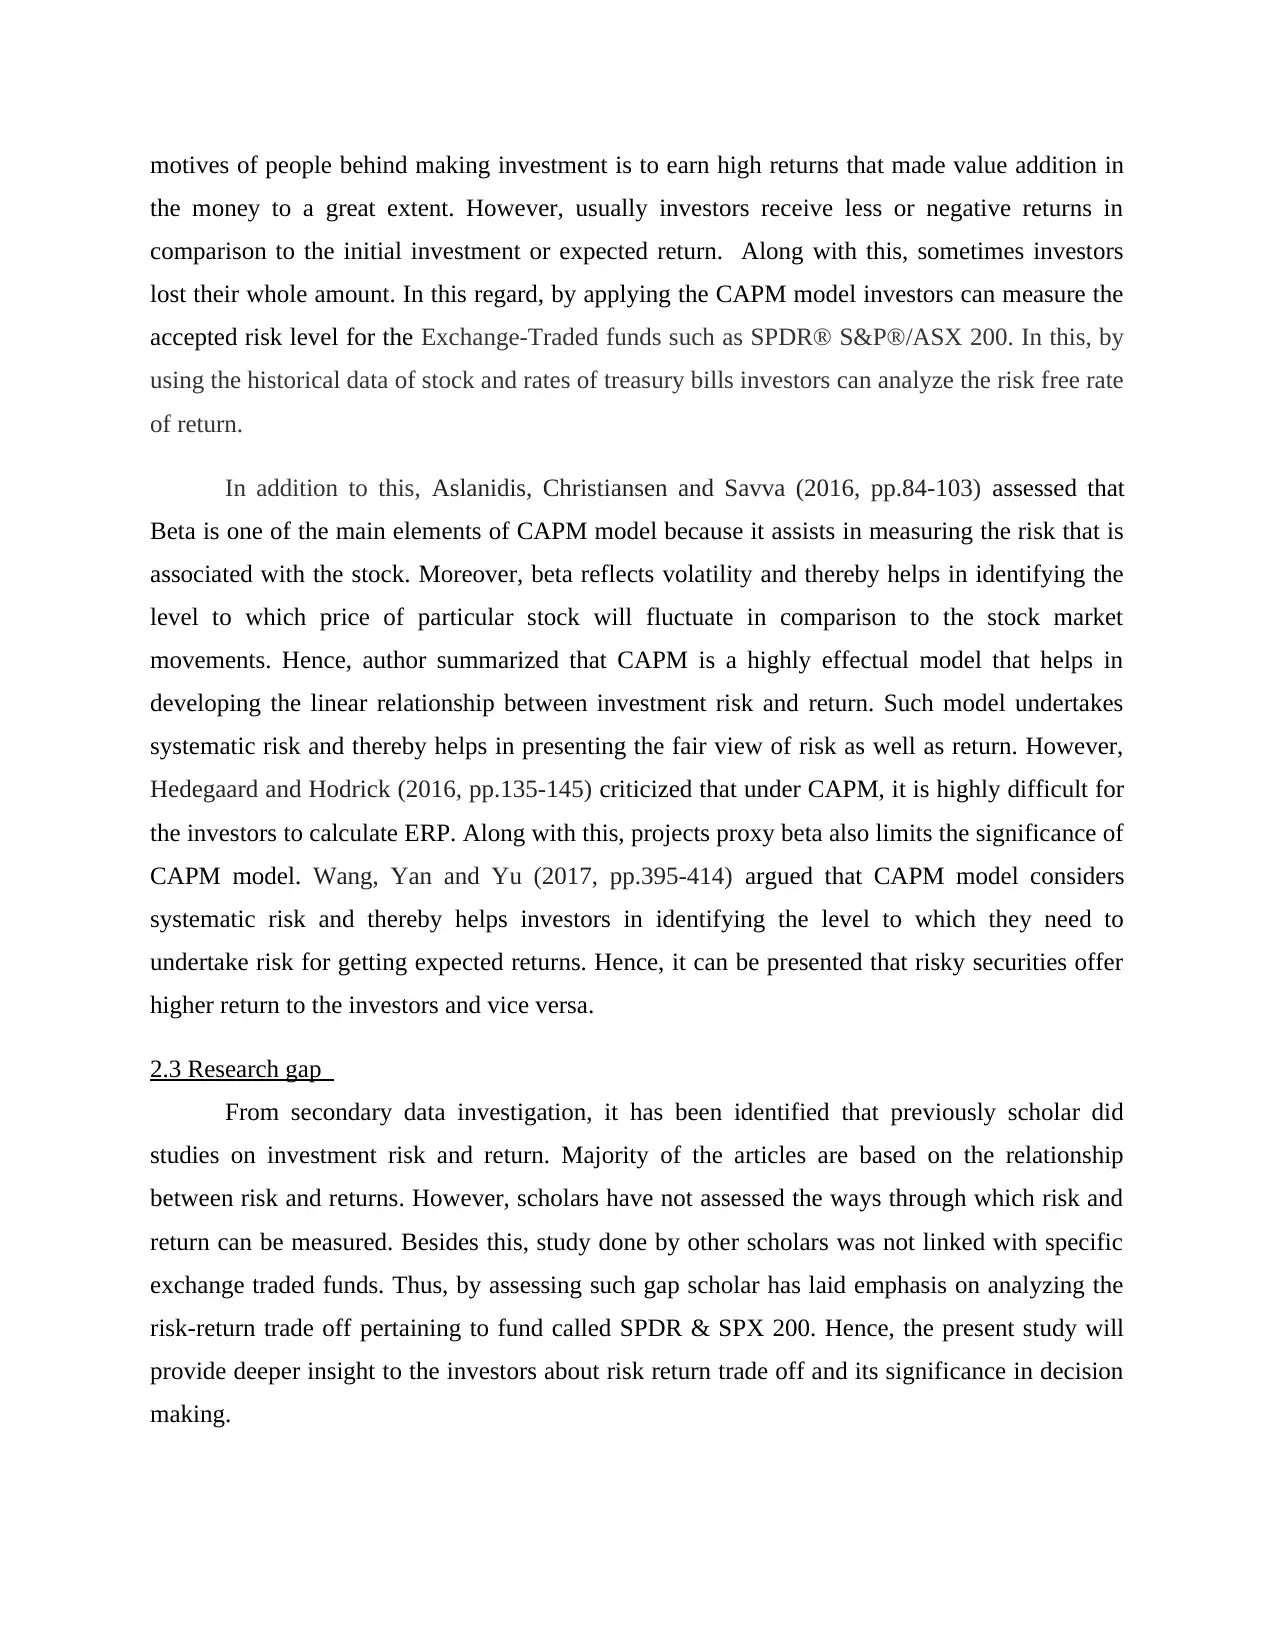
motives of people behind making investment is to earn high returns that made value addition in
the money to a great extent. However, usually investors receive less or negative returns in
comparison to the initial investment or expected return. Along with this, sometimes investors
lost their whole amount. In this regard, by applying the CAPM model investors can measure the
accepted risk level for the Exchange-Traded funds such as SPDR® S&P®/ASX 200. In this, by
using the historical data of stock and rates of treasury bills investors can analyze the risk free rate
of return.
In addition to this, Aslanidis, Christiansen and Savva (2016, pp.84-103) assessed that
Beta is one of the main elements of CAPM model because it assists in measuring the risk that is
associated with the stock. Moreover, beta reflects volatility and thereby helps in identifying the
level to which price of particular stock will fluctuate in comparison to the stock market
movements. Hence, author summarized that CAPM is a highly effectual model that helps in
developing the linear relationship between investment risk and return. Such model undertakes
systematic risk and thereby helps in presenting the fair view of risk as well as return. However,
Hedegaard and Hodrick (2016, pp.135-145) criticized that under CAPM, it is highly difficult for
the investors to calculate ERP. Along with this, projects proxy beta also limits the significance of
CAPM model. Wang, Yan and Yu (2017, pp.395-414) argued that CAPM model considers
systematic risk and thereby helps investors in identifying the level to which they need to
undertake risk for getting expected returns. Hence, it can be presented that risky securities offer
higher return to the investors and vice versa.
2.3 Research gap
From secondary data investigation, it has been identified that previously scholar did
studies on investment risk and return. Majority of the articles are based on the relationship
between risk and returns. However, scholars have not assessed the ways through which risk and
return can be measured. Besides this, study done by other scholars was not linked with specific
exchange traded funds. Thus, by assessing such gap scholar has laid emphasis on analyzing the
risk-return trade off pertaining to fund called SPDR & SPX 200. Hence, the present study will
provide deeper insight to the investors about risk return trade off and its significance in decision
making.
⊘ This is a preview!⊘
Do you want full access?
Subscribe today to unlock all pages.
Trusted by 1+ million students worldwide
REFERENCES
Books and Journals
Aslanidis, N., Christiansen, C. and Savva, C. S., 2016. Risk-return trade-off for European stock
markets. International Review of Financial Analysis. 46. pp.84-103.
Frazier, D. T. and Liu, X., 2016. A new approach to risk-return trade-off dynamics via
decomposition. Journal of Economic Dynamics and Control. 62. pp.43-55.
Hedegaard, E. and Hodrick, R. J., 2016. Estimating the risk-return trade-off with overlapping
data inference. Journal of Banking & Finance. 67. pp.135-145.
Jeffrey, S. A., Lévesque, M. and Maxwell, A. L., 2016. The non-compensatory relationship
between risk and return in business angel investment decision making. Venture
Capital.18(3). pp.189-209.
Kumar, S. and Rao, K. N., 2017. Study of Causality, Shocks, and Risk Return Trade-off in
Multifactor Asset Pricing Models. Australian Academy of Accounting and Finance Review.
3(1). pp.21-27.
Liu, X. and Zeng, M., 2017. Renewable energy investment risk evaluation model based on
system dynamics. Renewable and Sustainable Energy Reviews. 73. pp.782-788.
Mascareñas, J. and Yan, F., 2017. How People Apply Mental Accounting Philosophy to
Investment Risk?. International Journal of Economics and Financial Issues. 7(3). pp.145-
151.
Montford, W. and Goldsmith, R. E., 2016. How gender and financial self‐efficacy influence
investment risk taking. International journal of consumer studies. 40(1). pp.101-106.
Sherwood, M. W. and Pollard, J. L., 2017. The risk-adjusted return potential of integrating ESG
strategies into emerging market equities. Journal of Sustainable Finance & Investment. pp.1-
19.
Wang, H., Yan, J. and Yu, J., 2017. Reference-dependent preferences and the risk–return trade-
off. Journal of Financial Economics. 123(2). pp.395-414.
Paraphrase This Document
Need a fresh take? Get an instant paraphrase of this document with our AI Paraphraser
Online
Limitations of earnings per share. 2016. [Online]. Available through: <
http://www.charterededucation.com/ifrs/4-limitations-of-earnings-per-share-your-30-second-
recap-for-ias-33/>. [Accessed on 22nd August 2017].
P/E ratio. 2017. [Online]. Available through: <http://www.munknee.com/the-pe-ratio-its-
strengths-and-limitations/>. [Accessed on 22nd August 2017].
Lazaroff, P., 2017. Measuring the Risk and Return Tradeoff. [Online]. Available through:
<http://www.plancorp.com/measuring-the-risk-and-return-tradeoff/ >. [Accessed on 22nd August
2017].
1 out of 8
Related Documents


Your All-in-One AI-Powered Toolkit for Academic Success.
+13062052269
info@desklib.com
Available 24*7 on WhatsApp / Email
![[object Object]](/_next/static/media/star-bottom.7253800d.svg)
Unlock your academic potential
Copyright © 2020–2026 A2Z Services. All Rights Reserved. Developed and managed by ZUCOL.