Analyzing and Optimizing Mech. Wire Works Supply Chain: A Case Study
VerifiedAdded on 2023/06/04
|12
|3341
|288
Case Study
AI Summary
This case study analyzes the supply chain of Mech. Wire Works, focusing on optimizing production and maximizing profit using linear programming and Excel Solver. The analysis reveals that the plant's machine utilization is low, leading to a gap between demand and output. The solution involves formulating a linear programming model to determine the optimal production quantities for different wire products, considering constraints such as plant capacity, demand, and labor hours. The analysis indicates that the production of product W0005X should be stopped to maximize profit and that increasing the packaging capacity is crucial for fully utilizing other resources. Sensitivity analysis is also performed to evaluate the impact of changes in input parameters on the optimal solution. The solution recommends shifting resources to increase winding and packaging capacity and reduce rejections to improve profit margins. The case study provides a detailed breakdown of the problem, the model, and the results, offering valuable insights into supply chain optimization strategies.
Case study solution (Mech. wire works)
1 | P a g e
Supply chain analytics
1 | P a g e
Supply chain analytics
Paraphrase This Document
Need a fresh take? Get an instant paraphrase of this document with our AI Paraphraser
Case study solution (Mech. wire works)
Contents
Introduction......................................................................................................................................3
Solution 1.........................................................................................................................................3
Solution 2.........................................................................................................................................7
Solution 3.......................................................................................................................................10
Conclusion.....................................................................................................................................10
Works Cited...................................................................................................................................11
2 | P a g e
Case study solution (Mech. wire works)
Introduction
The use of information technology has affected the business process in all aspect. But use of
information technology in Supply chain management, has totally chained the face of doing
business, all the jargons like E-Commerce, EDI, ERP, Barcode, QR code, 3PL, all are only
possible after the application of computer in supply chain management. Here we will see that
how optimization can be done in limited resources with the help of computer application
(Szpilko, 2017).
As given in the question, the first work to John smith is the analyses the data as given in
question, the normal demand of Mech. wire is around 4276 unit, and average output is around
2400 unit/month, Therefore it clear that, we have to arrange all the resources to maximize the
profit from the given output. The main difference in output and demand is due to the reason, that,
the plant’s machine utilization is around 63%. By analysis and calculation we try to find, how we
can optimize the available machine and resources in give condition. We will solve this problem
with the help of excel solver in Microsoft Excel 2016 (Štefan Kudláč, 2017).
Solution 1
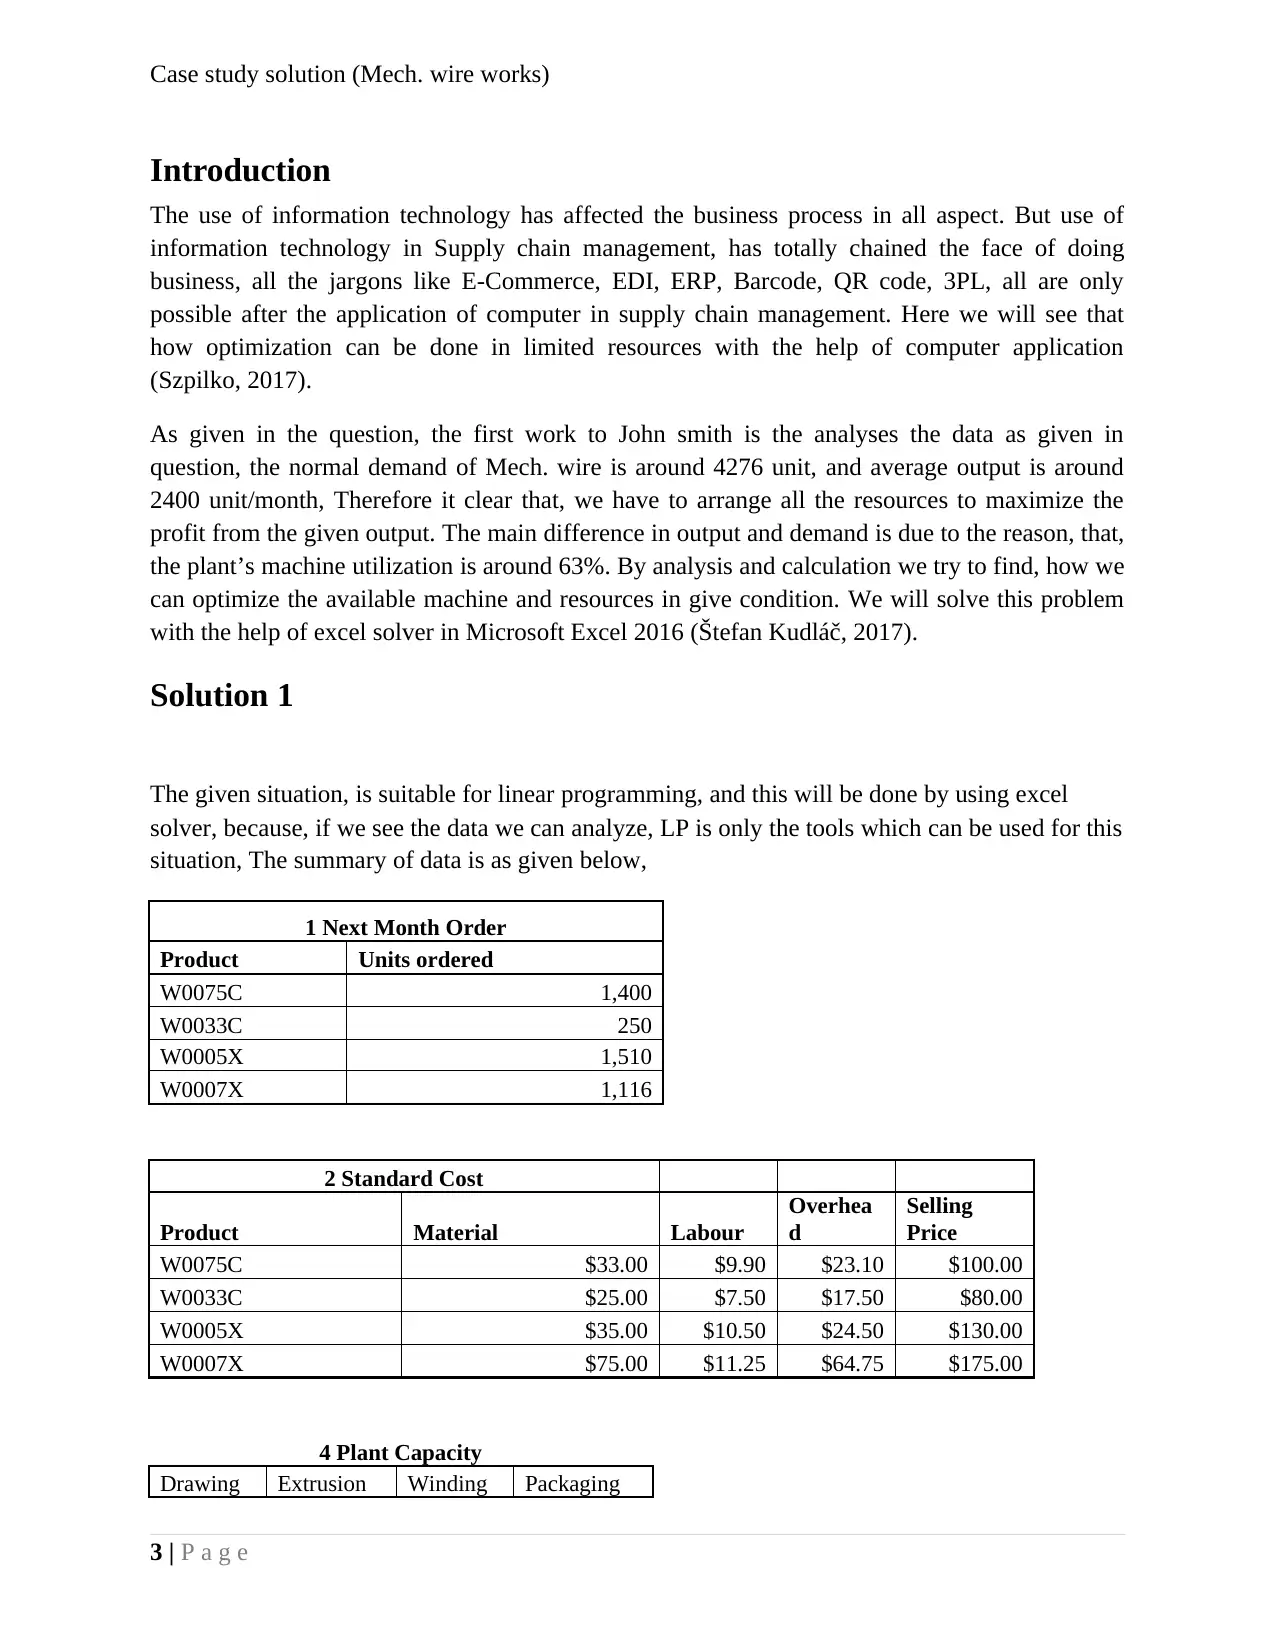
The given situation, is suitable for linear programming, and this will be done by using excel
solver, because, if we see the data we can analyze, LP is only the tools which can be used for this
situation, The summary of data is as given below,
1 Next Month Order
Product Units ordered
W0075C 1,400
W0033C 250
W0005X 1,510
W0007X 1,116
2 Standard Cost
Product Material Labour
Overhea
d
Selling
Price
W0075C $33.00 $9.90 $23.10 $100.00
W0033C $25.00 $7.50 $17.50 $80.00
W0005X $35.00 $10.50 $24.50 $130.00
W0007X $75.00 $11.25 $64.75 $175.00
4 Plant Capacity
Drawing Extrusion Winding Packaging
3 | P a g e
Introduction
The use of information technology has affected the business process in all aspect. But use of
information technology in Supply chain management, has totally chained the face of doing
business, all the jargons like E-Commerce, EDI, ERP, Barcode, QR code, 3PL, all are only
possible after the application of computer in supply chain management. Here we will see that
how optimization can be done in limited resources with the help of computer application
(Szpilko, 2017).
As given in the question, the first work to John smith is the analyses the data as given in
question, the normal demand of Mech. wire is around 4276 unit, and average output is around
2400 unit/month, Therefore it clear that, we have to arrange all the resources to maximize the
profit from the given output. The main difference in output and demand is due to the reason, that,
the plant’s machine utilization is around 63%. By analysis and calculation we try to find, how we
can optimize the available machine and resources in give condition. We will solve this problem
with the help of excel solver in Microsoft Excel 2016 (Štefan Kudláč, 2017).
Solution 1
The given situation, is suitable for linear programming, and this will be done by using excel
solver, because, if we see the data we can analyze, LP is only the tools which can be used for this
situation, The summary of data is as given below,
1 Next Month Order
Product Units ordered
W0075C 1,400
W0033C 250
W0005X 1,510
W0007X 1,116
2 Standard Cost
Product Material Labour
Overhea
d
Selling
Price
W0075C $33.00 $9.90 $23.10 $100.00
W0033C $25.00 $7.50 $17.50 $80.00
W0005X $35.00 $10.50 $24.50 $130.00
W0007X $75.00 $11.25 $64.75 $175.00
4 Plant Capacity
Drawing Extrusion Winding Packaging
3 | P a g e
⊘ This is a preview!⊘
Do you want full access?
Subscribe today to unlock all pages.
Trusted by 1+ million students worldwide
Case study solution (Mech. wire works)
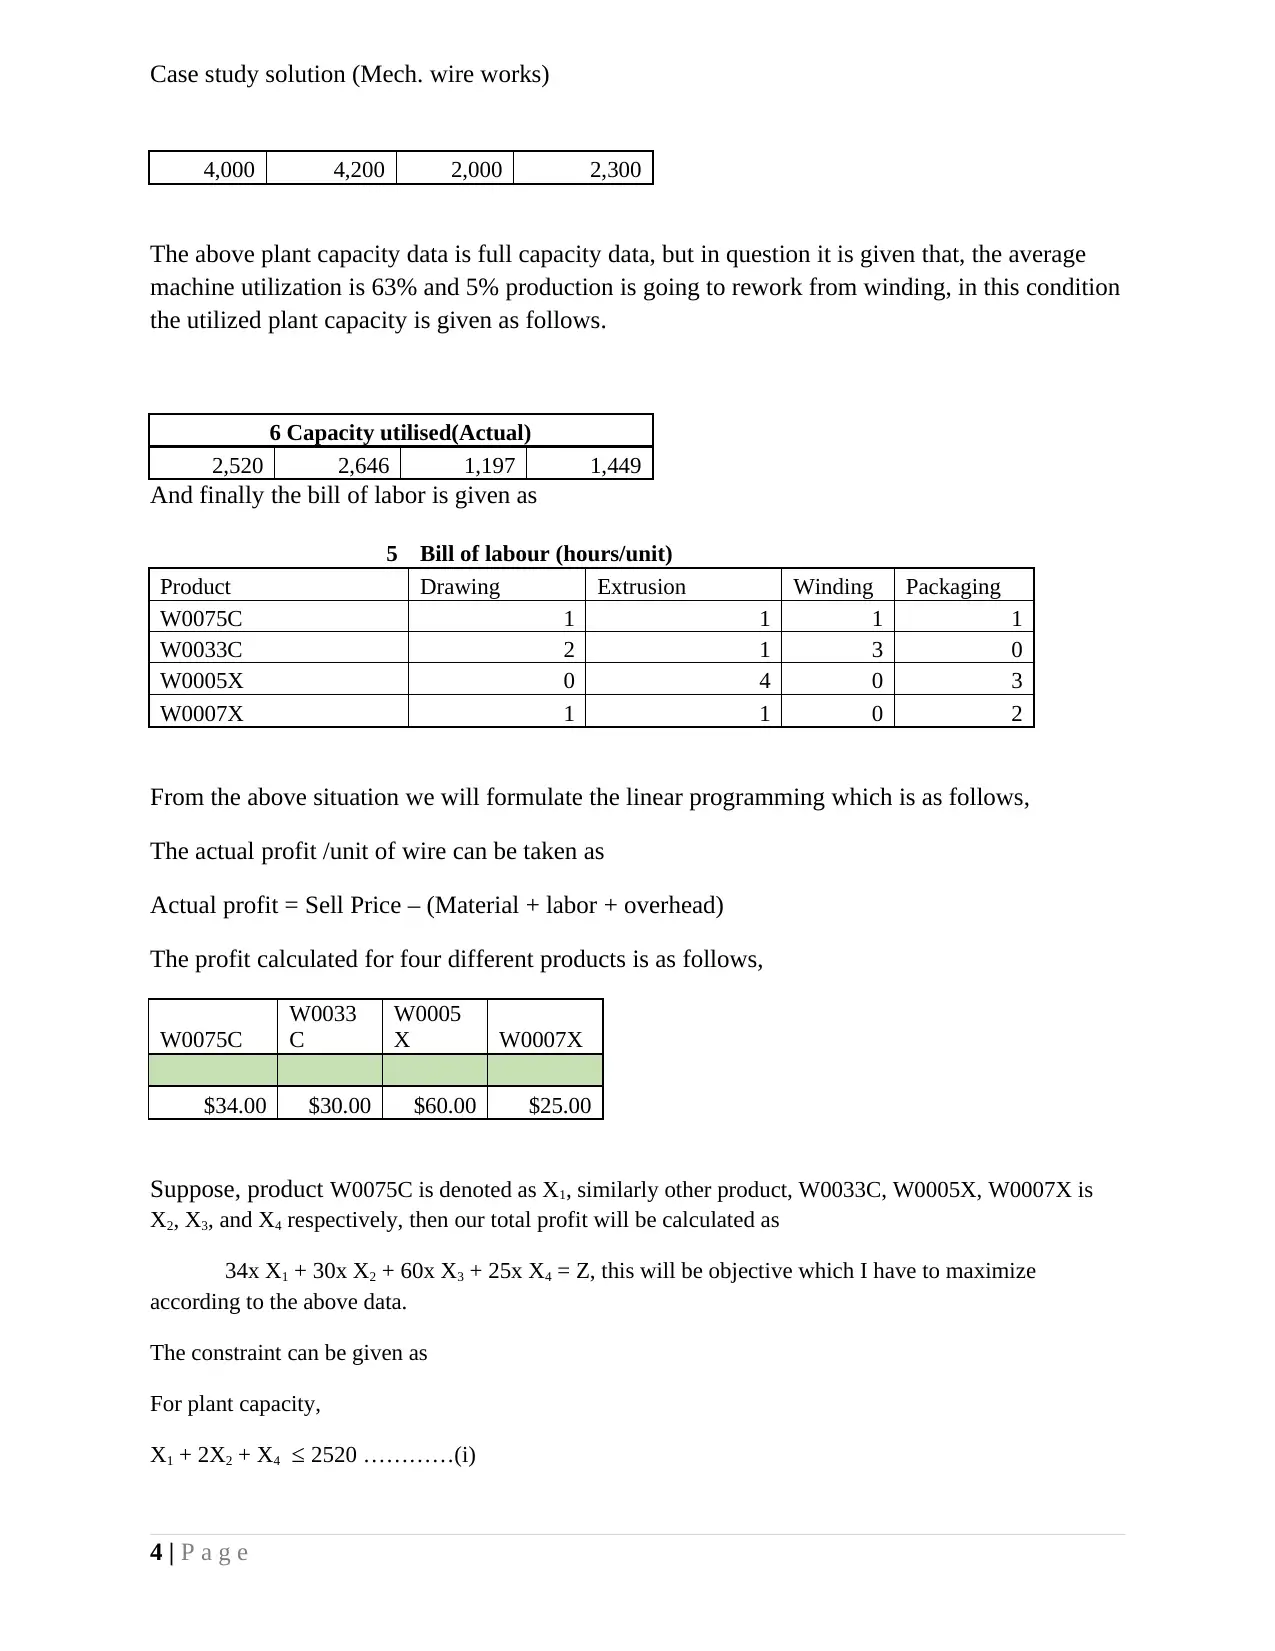
4,000 4,200 2,000 2,300
The above plant capacity data is full capacity data, but in question it is given that, the average
machine utilization is 63% and 5% production is going to rework from winding, in this condition
the utilized plant capacity is given as follows.
6 Capacity utilised(Actual)
2,520 2,646 1,197 1,449
And finally the bill of labor is given as
5 Bill of labour (hours/unit)
Product Drawing Extrusion Winding Packaging
W0075C 1 1 1 1
W0033C 2 1 3 0
W0005X 0 4 0 3
W0007X 1 1 0 2
From the above situation we will formulate the linear programming which is as follows,
The actual profit /unit of wire can be taken as
Actual profit = Sell Price – (Material + labor + overhead)
The profit calculated for four different products is as follows,
W0075C
W0033
C
W0005
X W0007X
$34.00 $30.00 $60.00 $25.00
Suppose, product W0075C is denoted as X1, similarly other product, W0033C, W0005X, W0007X is
X2, X3, and X4 respectively, then our total profit will be calculated as
34x X1 + 30x X2 + 60x X3 + 25x X4 = Z, this will be objective which I have to maximize
according to the above data.
The constraint can be given as
For plant capacity,
X1 + 2X2 + X4 ≤ 2520 …………(i)
4 | P a g e
Paraphrase This Document
Need a fresh take? Get an instant paraphrase of this document with our AI Paraphraser
Case study solution (Mech. wire works)
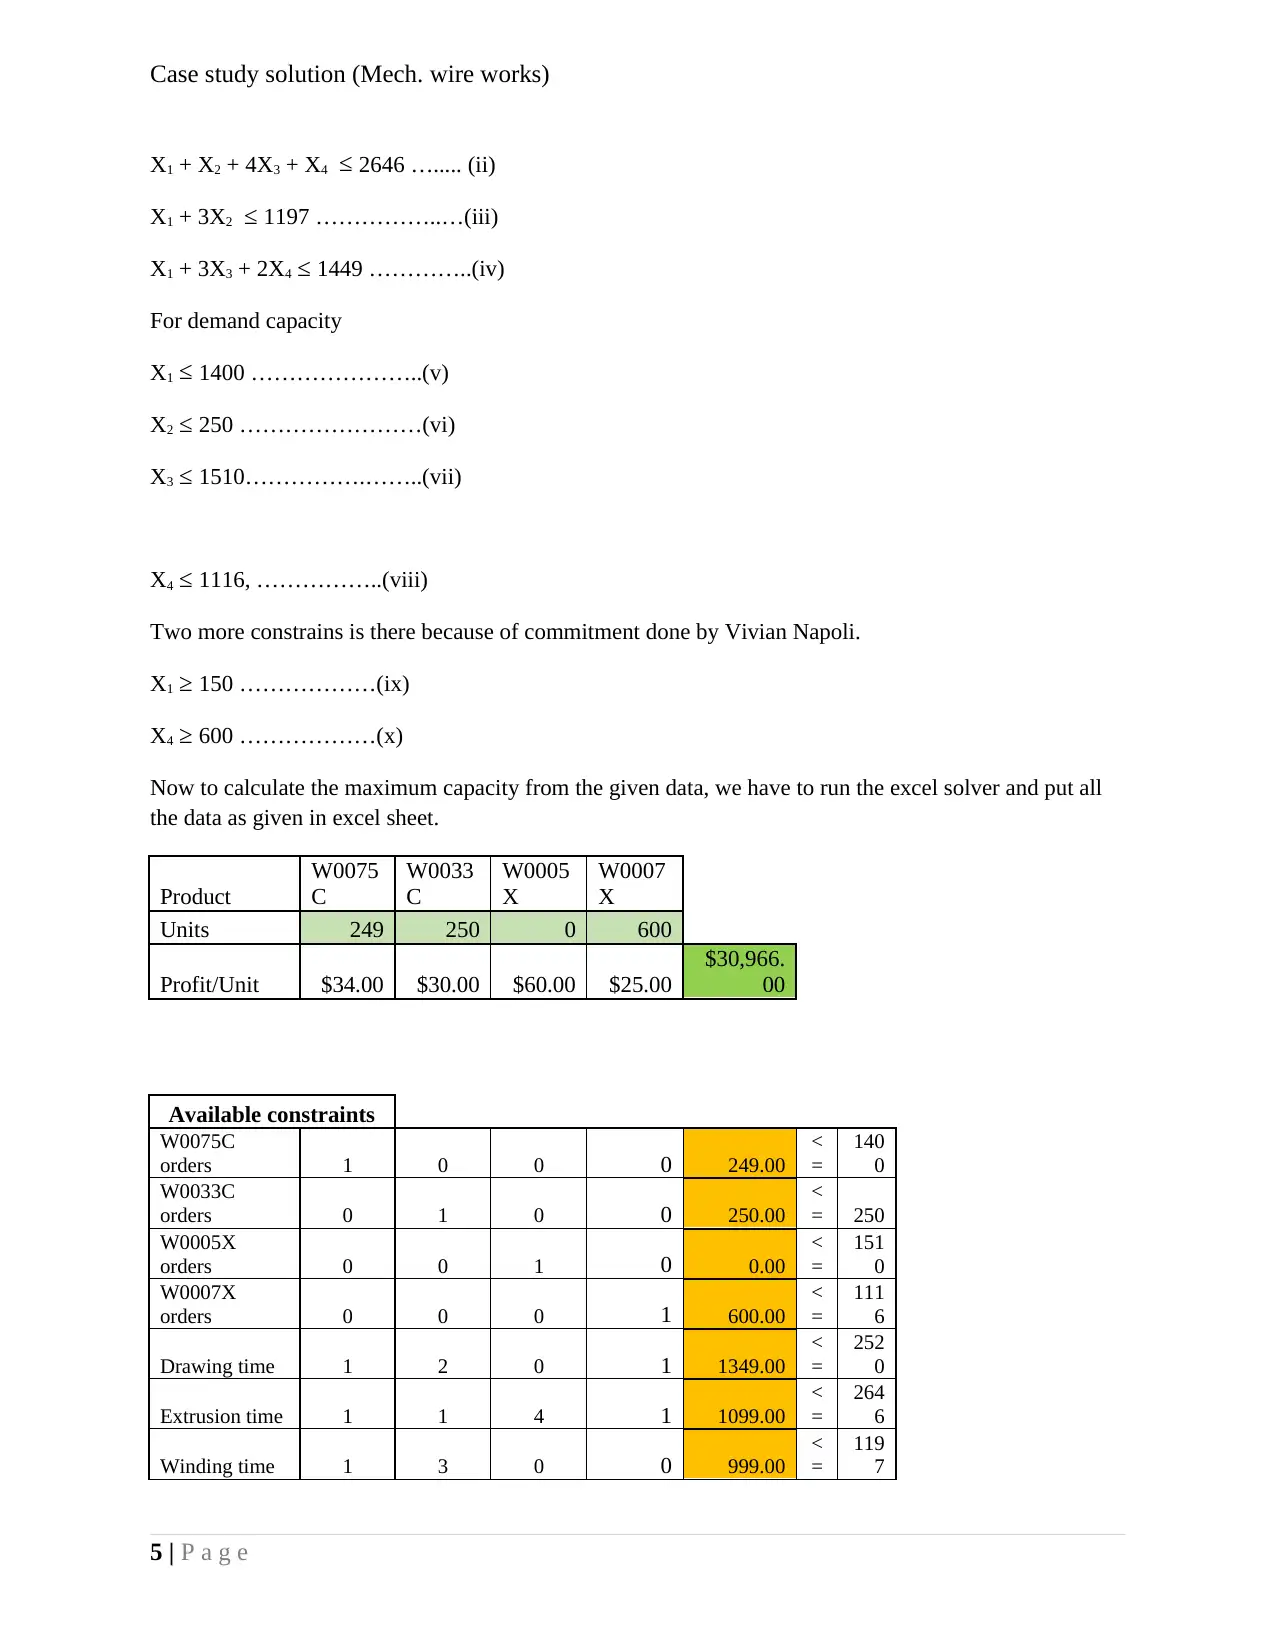
X1 + X2 + 4X3 + X4 ≤ 2646 …..... (ii)
X1 + 3X2 ≤ 1197 ……………..…(iii)
X1 + 3X3 + 2X4 ≤ 1449 …………..(iv)
For demand capacity
X1 ≤ 1400 …………………..(v)
X2 ≤ 250 ……………………(vi)
X3 ≤ 1510…………….……..(vii)
X4 ≤ 1116, ……………..(viii)
Two more constrains is there because of commitment done by Vivian Napoli.
X1 ≥ 150 ………………(ix)
X4 ≥ 600 ………………(x)
Now to calculate the maximum capacity from the given data, we have to run the excel solver and put all
the data as given in excel sheet.
Product
W0075
C
W0033
C
W0005
X
W0007
X
Units 249 250 0 600
Profit/Unit $34.00 $30.00 $60.00 $25.00
$30,966.
00
Available constraints
W0075C
orders 1 0 0 0 249.00
<
=
140
0
W0033C
orders 0 1 0 0 250.00
<
= 250
W0005X
orders 0 0 1 0 0.00
<
=
151
0
W0007X
orders 0 0 0 1 600.00
<
=
111
6
Drawing time 1 2 0 1 1349.00
<
=
252
0
Extrusion time 1 1 4 1 1099.00
<
=
264
6
Winding time 1 3 0 0 999.00
<
=
119
7
5 | P a g e
Case study solution (Mech. wire works)
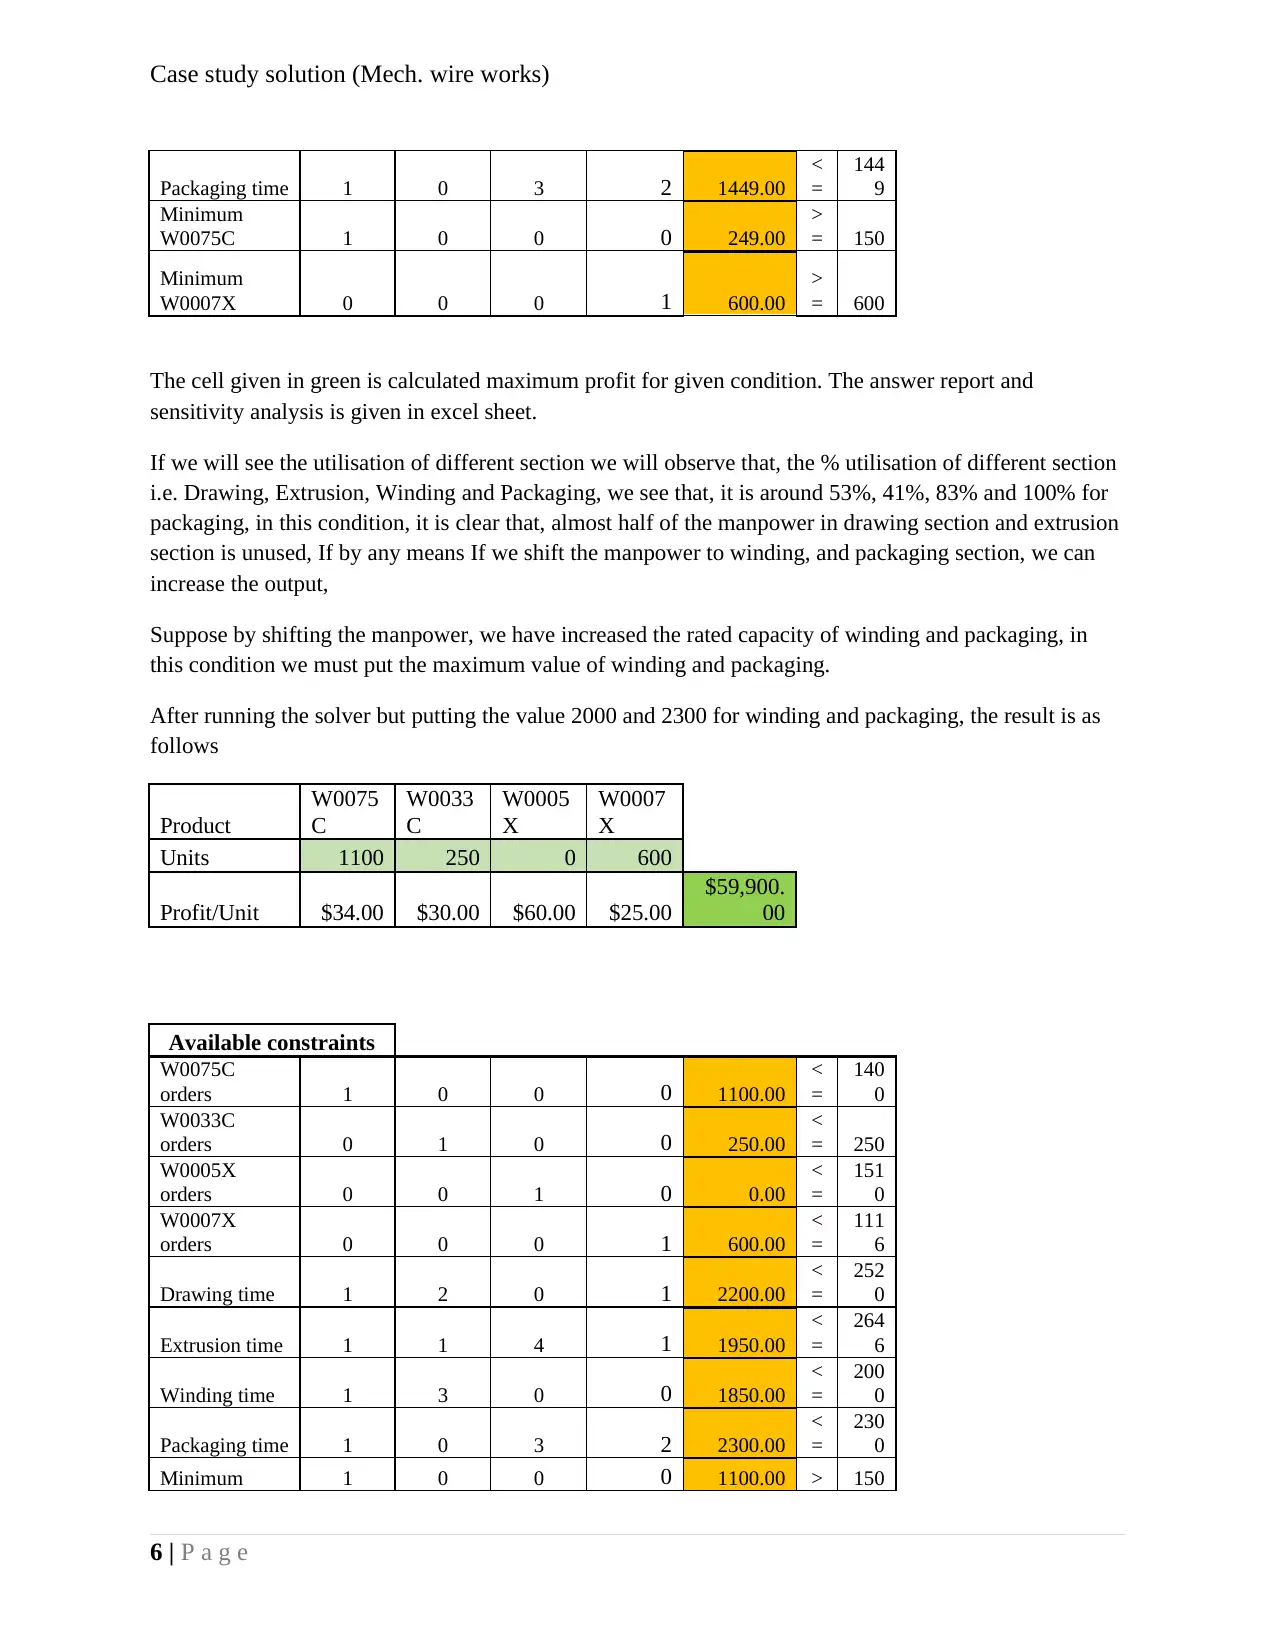
Packaging time 1 0 3 2 1449.00
<
=
144
9
Minimum
W0075C 1 0 0 0 249.00
>
= 150
Minimum
W0007X 0 0 0 1 600.00
>
= 600
The cell given in green is calculated maximum profit for given condition. The answer report and
sensitivity analysis is given in excel sheet.
If we will see the utilisation of different section we will observe that, the % utilisation of different section
i.e. Drawing, Extrusion, Winding and Packaging, we see that, it is around 53%, 41%, 83% and 100% for
packaging, in this condition, it is clear that, almost half of the manpower in drawing section and extrusion
section is unused, If by any means If we shift the manpower to winding, and packaging section, we can
increase the output,
Suppose by shifting the manpower, we have increased the rated capacity of winding and packaging, in
this condition we must put the maximum value of winding and packaging.
After running the solver but putting the value 2000 and 2300 for winding and packaging, the result is as
follows
Product
W0075
C
W0033
C
W0005
X
W0007
X
Units 1100 250 0 600
Profit/Unit $34.00 $30.00 $60.00 $25.00
$59,900.
00
Available constraints
W0075C
orders 1 0 0 0 1100.00
<
=
140
0
W0033C
orders 0 1 0 0 250.00
<
= 250
W0005X
orders 0 0 1 0 0.00
<
=
151
0
W0007X
orders 0 0 0 1 600.00
<
=
111
6
Drawing time 1 2 0 1 2200.00
<
=
252
0
Extrusion time 1 1 4 1 1950.00
<
=
264
6
Winding time 1 3 0 0 1850.00
<
=
200
0
Packaging time 1 0 3 2 2300.00
<
=
230
0
Minimum 1 0 0 0 1100.00 > 150
6 | P a g e
⊘ This is a preview!⊘
Do you want full access?
Subscribe today to unlock all pages.
Trusted by 1+ million students worldwide
Case study solution (Mech. wire works)
W0075C =
Minimum
W0007X 0 0 0 1 600.00
>
= 600
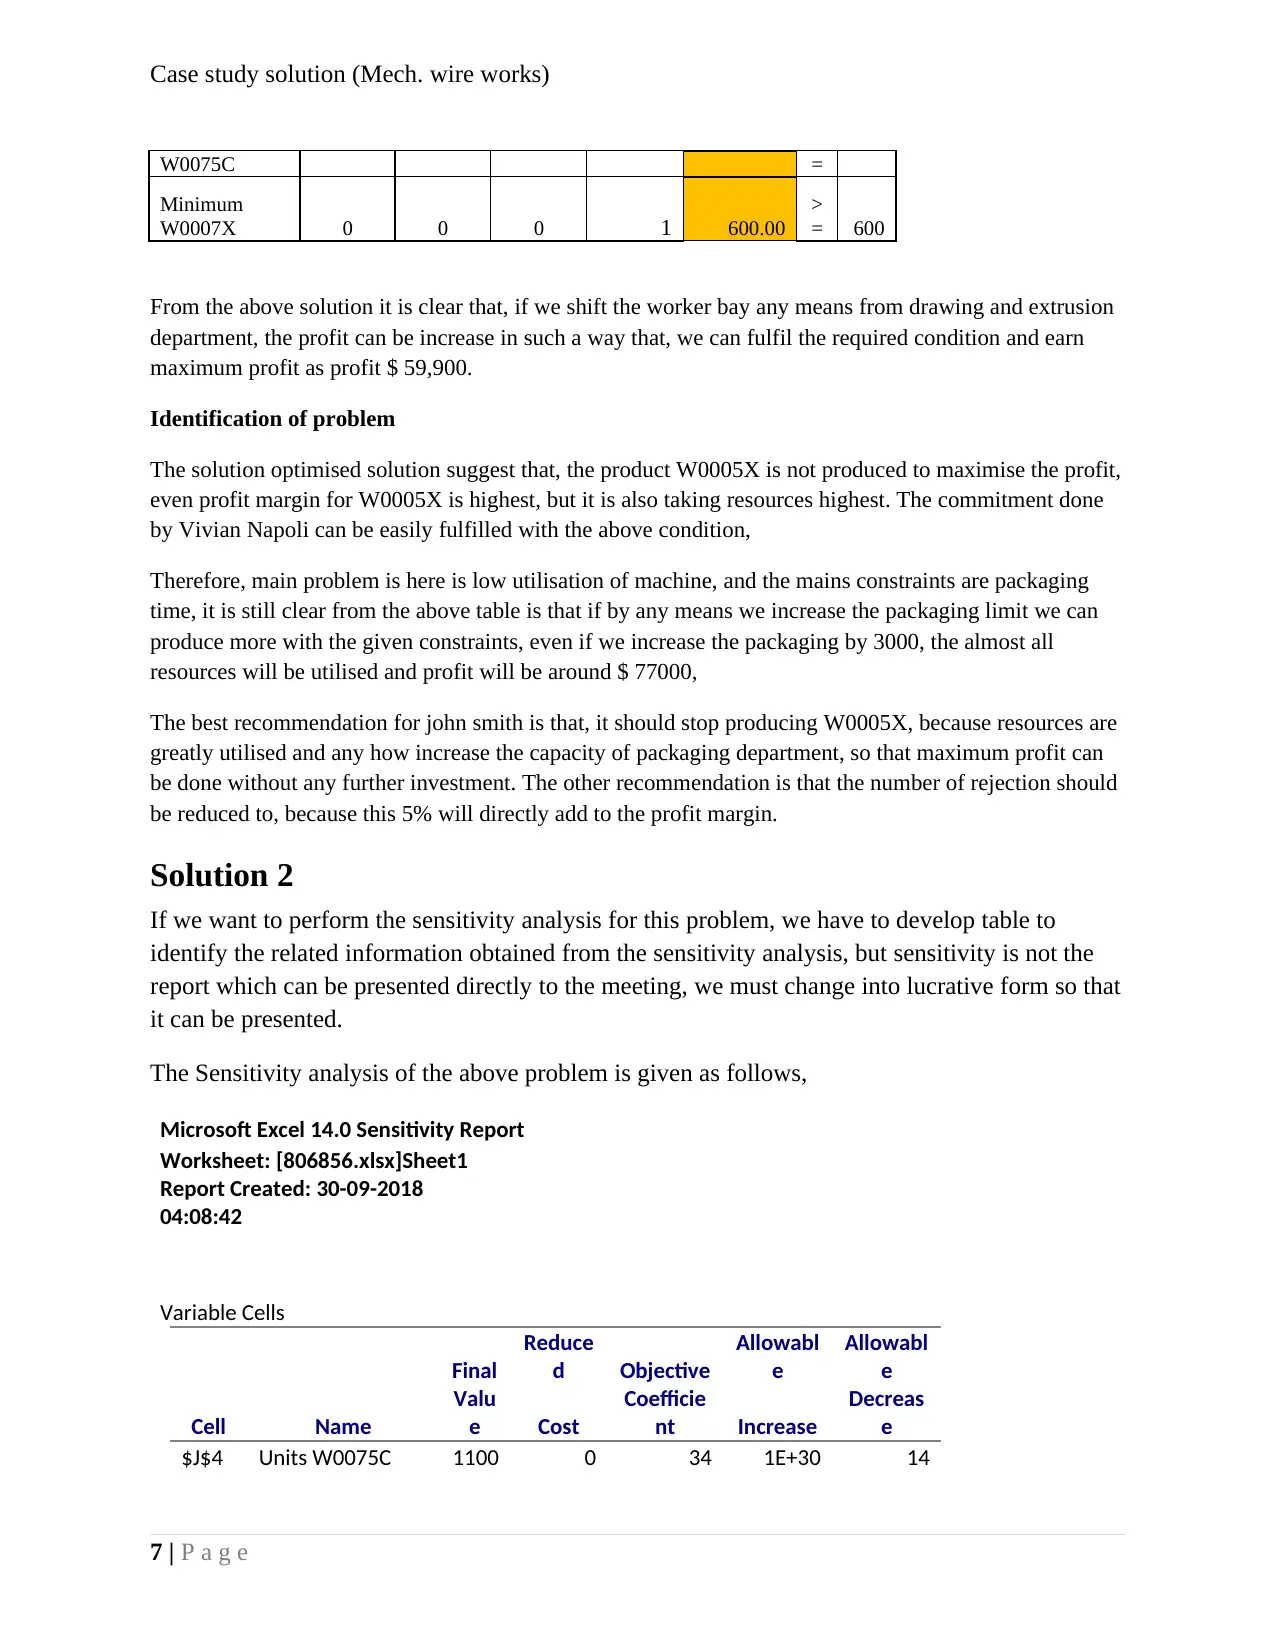
From the above solution it is clear that, if we shift the worker bay any means from drawing and extrusion
department, the profit can be increase in such a way that, we can fulfil the required condition and earn
maximum profit as profit $ 59,900.
Identification of problem
The solution optimised solution suggest that, the product W0005X is not produced to maximise the profit,
even profit margin for W0005X is highest, but it is also taking resources highest. The commitment done
by Vivian Napoli can be easily fulfilled with the above condition,
Therefore, main problem is here is low utilisation of machine, and the mains constraints are packaging
time, it is still clear from the above table is that if by any means we increase the packaging limit we can
produce more with the given constraints, even if we increase the packaging by 3000, the almost all
resources will be utilised and profit will be around $ 77000,
The best recommendation for john smith is that, it should stop producing W0005X, because resources are
greatly utilised and any how increase the capacity of packaging department, so that maximum profit can
be done without any further investment. The other recommendation is that the number of rejection should
be reduced to, because this 5% will directly add to the profit margin.
Solution 2
If we want to perform the sensitivity analysis for this problem, we have to develop table to
identify the related information obtained from the sensitivity analysis, but sensitivity is not the
report which can be presented directly to the meeting, we must change into lucrative form so that
it can be presented.
The Sensitivity analysis of the above problem is given as follows,
Microsoft Excel 14.0 Sensitivity Report
Worksheet: [806856.xlsx]Sheet1
Report Created: 30-09-2018
04:08:42
Variable Cells
Final
Reduce
d Objective
Allowabl
e
Allowabl
e
Cell Name
Valu
e Cost
Coefficie
nt Increase
Decreas
e
$J$4 Units W0075C 1100 0 34 1E+30 14
7 | P a g e
W0075C =
Minimum
W0007X 0 0 0 1 600.00
>
= 600
From the above solution it is clear that, if we shift the worker bay any means from drawing and extrusion
department, the profit can be increase in such a way that, we can fulfil the required condition and earn
maximum profit as profit $ 59,900.
Identification of problem
The solution optimised solution suggest that, the product W0005X is not produced to maximise the profit,
even profit margin for W0005X is highest, but it is also taking resources highest. The commitment done
by Vivian Napoli can be easily fulfilled with the above condition,
Therefore, main problem is here is low utilisation of machine, and the mains constraints are packaging
time, it is still clear from the above table is that if by any means we increase the packaging limit we can
produce more with the given constraints, even if we increase the packaging by 3000, the almost all
resources will be utilised and profit will be around $ 77000,
The best recommendation for john smith is that, it should stop producing W0005X, because resources are
greatly utilised and any how increase the capacity of packaging department, so that maximum profit can
be done without any further investment. The other recommendation is that the number of rejection should
be reduced to, because this 5% will directly add to the profit margin.
Solution 2
If we want to perform the sensitivity analysis for this problem, we have to develop table to
identify the related information obtained from the sensitivity analysis, but sensitivity is not the
report which can be presented directly to the meeting, we must change into lucrative form so that
it can be presented.
The Sensitivity analysis of the above problem is given as follows,
Microsoft Excel 14.0 Sensitivity Report
Worksheet: [806856.xlsx]Sheet1
Report Created: 30-09-2018
04:08:42
Variable Cells
Final
Reduce
d Objective
Allowabl
e
Allowabl
e
Cell Name
Valu
e Cost
Coefficie
nt Increase
Decreas
e
$J$4 Units W0075C 1100 0 34 1E+30 14
7 | P a g e
Paraphrase This Document
Need a fresh take? Get an instant paraphrase of this document with our AI Paraphraser
Case study solution (Mech. wire works)
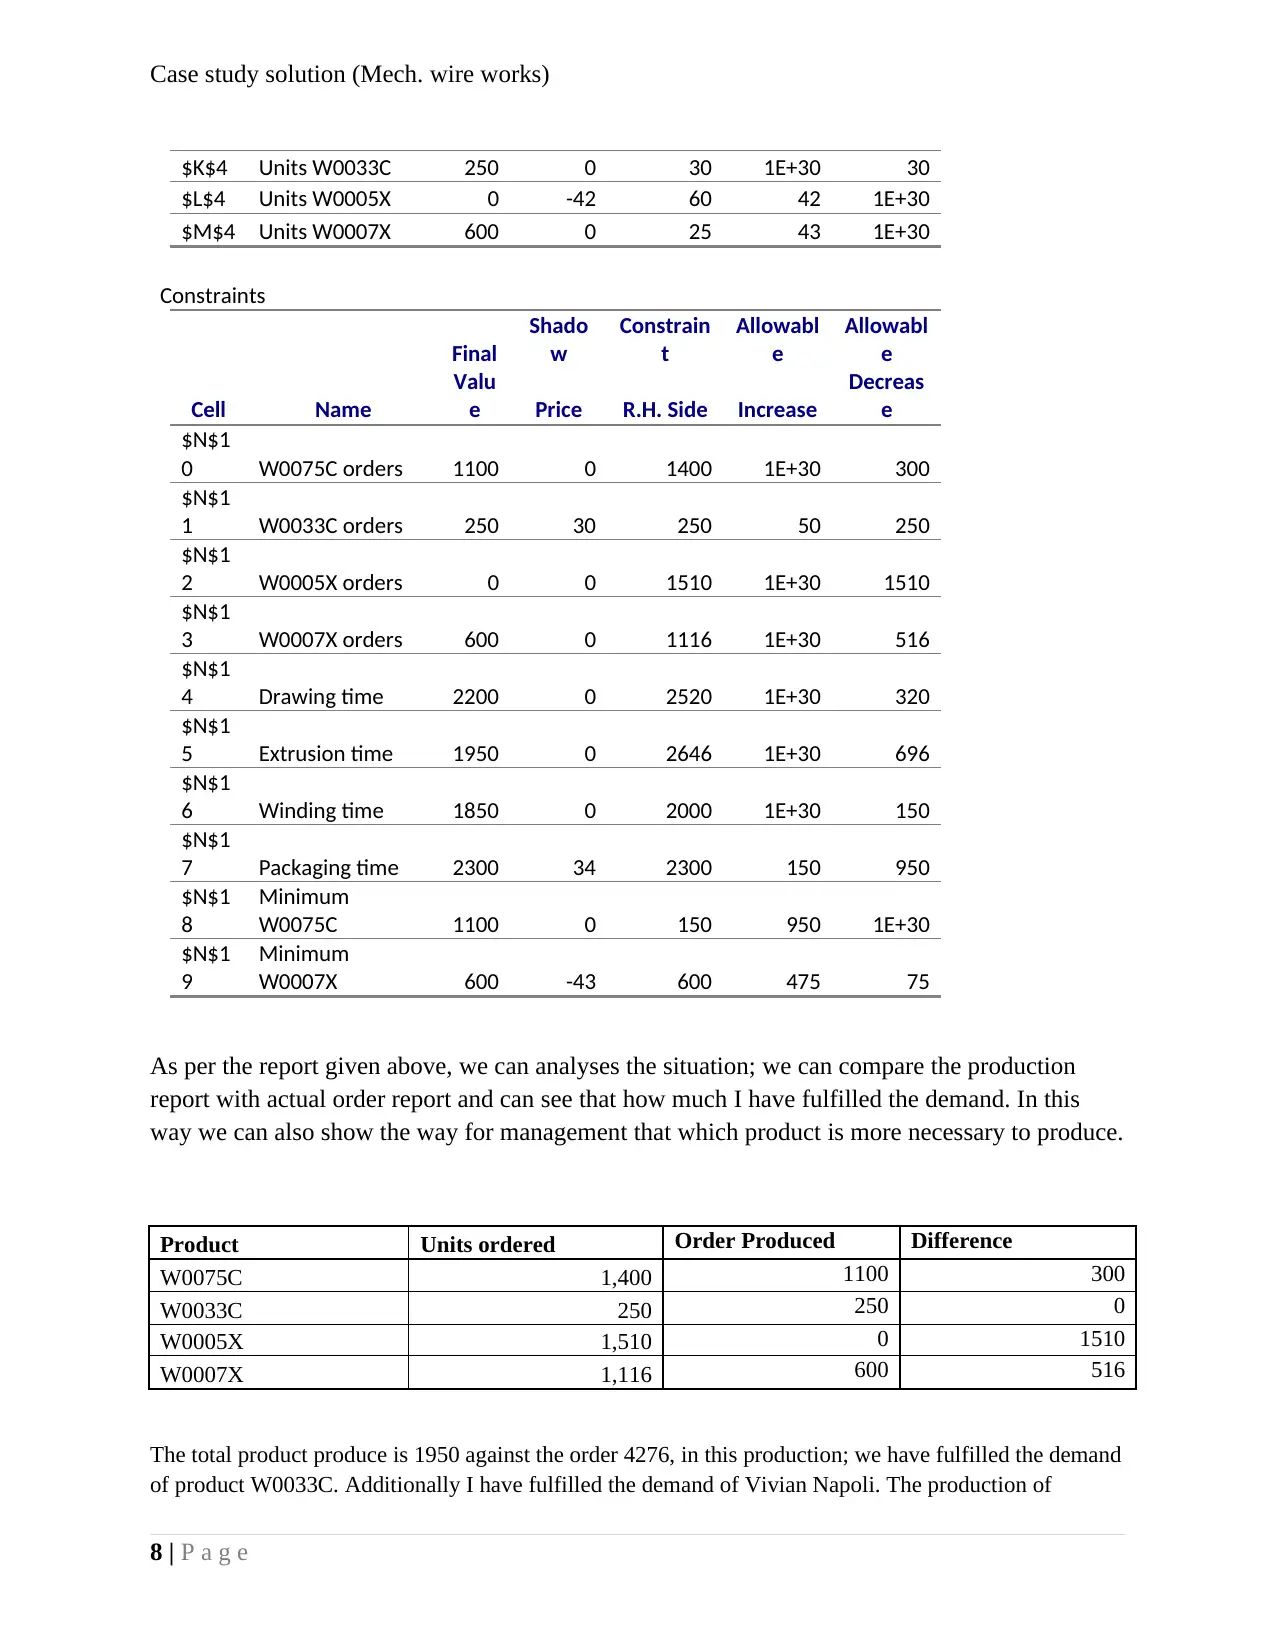
$K$4 Units W0033C 250 0 30 1E+30 30
$L$4 Units W0005X 0 -42 60 42 1E+30
$M$4 Units W0007X 600 0 25 43 1E+30
Constraints
Final
Shado
w
Constrain
t
Allowabl
e
Allowabl
e
Cell Name
Valu
e Price R.H. Side Increase
Decreas
e
$N$1
0 W0075C orders 1100 0 1400 1E+30 300
$N$1
1 W0033C orders 250 30 250 50 250
$N$1
2 W0005X orders 0 0 1510 1E+30 1510
$N$1
3 W0007X orders 600 0 1116 1E+30 516
$N$1
4 Drawing time 2200 0 2520 1E+30 320
$N$1
5 Extrusion time 1950 0 2646 1E+30 696
$N$1
6 Winding time 1850 0 2000 1E+30 150
$N$1
7 Packaging time 2300 34 2300 150 950
$N$1
8
Minimum
W0075C 1100 0 150 950 1E+30
$N$1
9
Minimum
W0007X 600 -43 600 475 75
As per the report given above, we can analyses the situation; we can compare the production
report with actual order report and can see that how much I have fulfilled the demand. In this
way we can also show the way for management that which product is more necessary to produce.
Product Units ordered Order Produced Difference
W0075C 1,400 1100 300
W0033C 250 250 0
W0005X 1,510 0 1510
W0007X 1,116 600 516
The total product produce is 1950 against the order 4276, in this production; we have fulfilled the demand
of product W0033C. Additionally I have fulfilled the demand of Vivian Napoli. The production of
8 | P a g e
Case study solution (Mech. wire works)
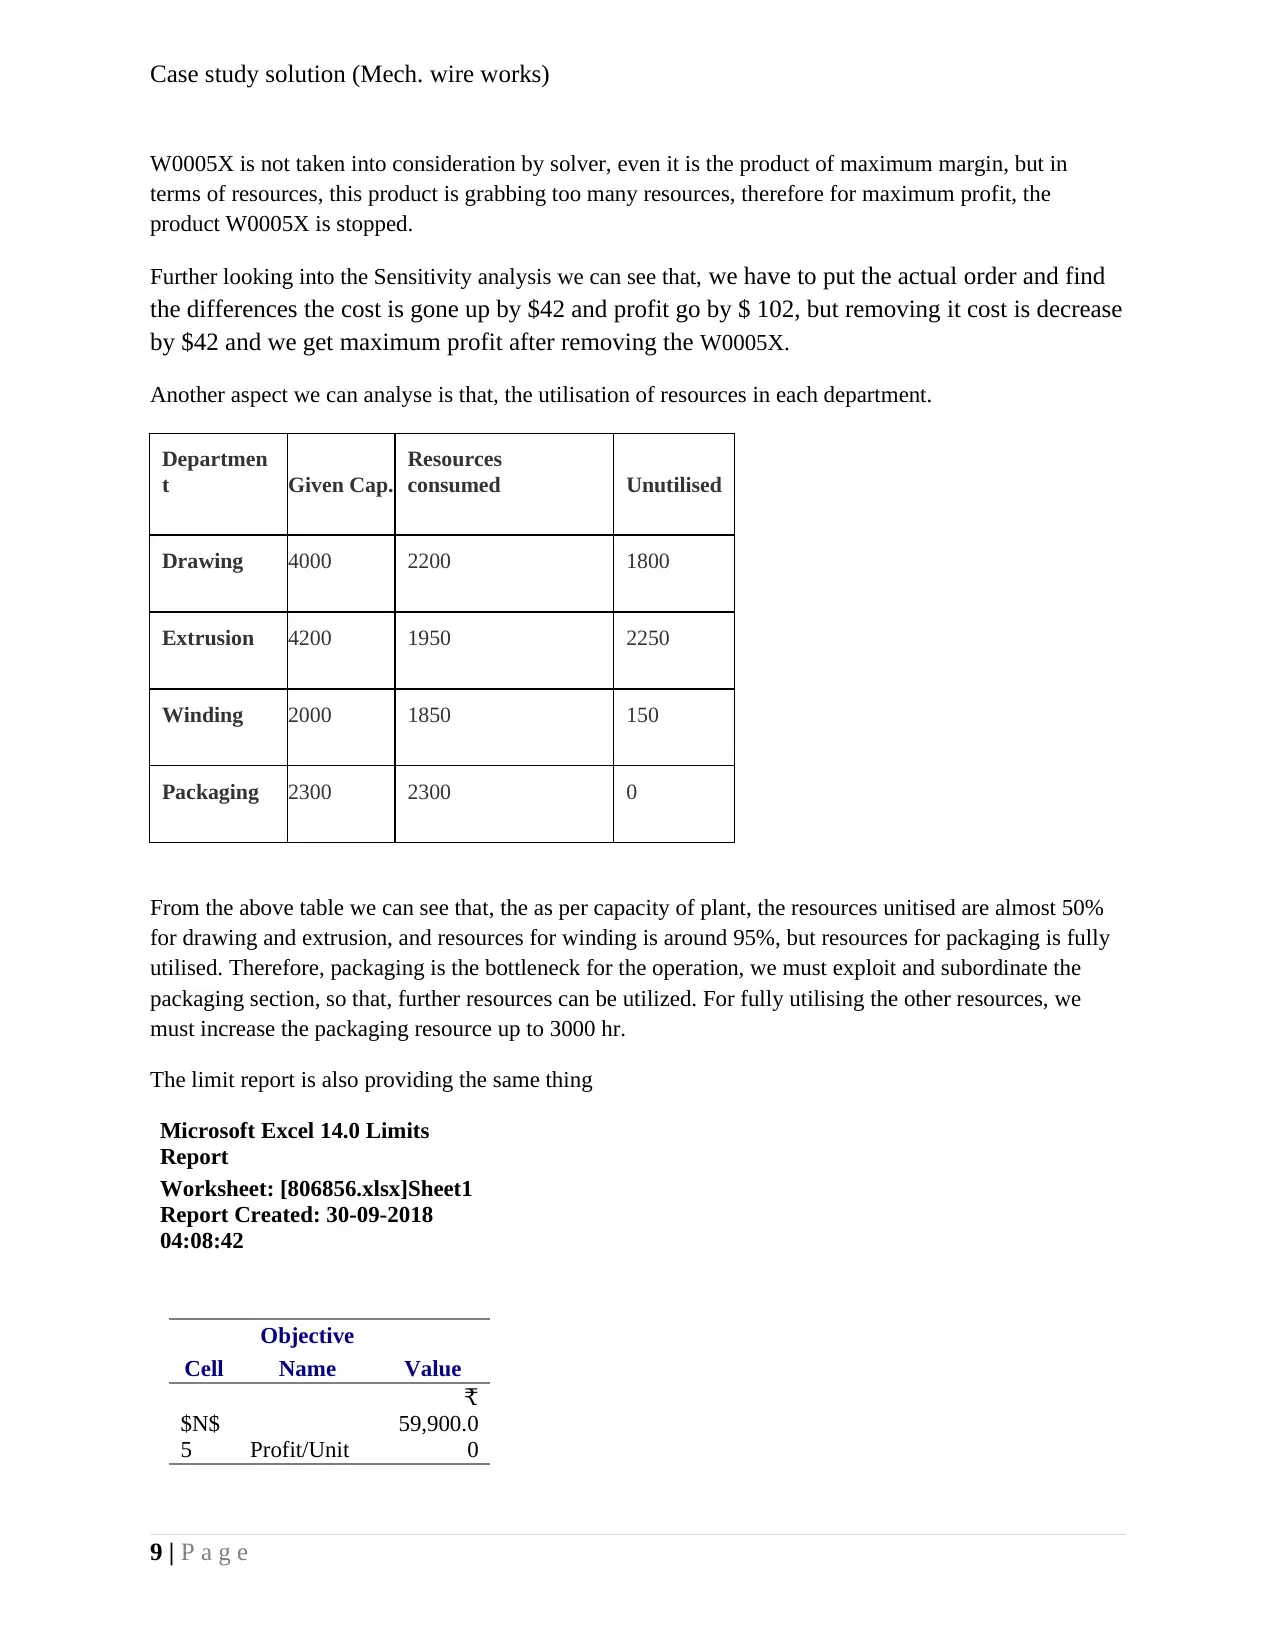
W0005X is not taken into consideration by solver, even it is the product of maximum margin, but in
terms of resources, this product is grabbing too many resources, therefore for maximum profit, the
product W0005X is stopped.
Further looking into the Sensitivity analysis we can see that, we have to put the actual order and find
the differences the cost is gone up by $42 and profit go by $ 102, but removing it cost is decrease
by $42 and we get maximum profit after removing the W0005X.
Another aspect we can analyse is that, the utilisation of resources in each department.
Departmen
t Given Cap.
Resources
consumed Unutilised
Drawing 4000 2200 1800
Extrusion 4200 1950 2250
Winding 2000 1850 150
Packaging 2300 2300 0
From the above table we can see that, the as per capacity of plant, the resources unitised are almost 50%
for drawing and extrusion, and resources for winding is around 95%, but resources for packaging is fully
utilised. Therefore, packaging is the bottleneck for the operation, we must exploit and subordinate the
packaging section, so that, further resources can be utilized. For fully utilising the other resources, we
must increase the packaging resource up to 3000 hr.
The limit report is also providing the same thing
Microsoft Excel 14.0 Limits
Report
Worksheet: [806856.xlsx]Sheet1
Report Created: 30-09-2018
04:08:42
Objective
Cell Name Value
$N$
5 Profit/Unit
₹
59,900.0
0
9 | P a g e
⊘ This is a preview!⊘
Do you want full access?
Subscribe today to unlock all pages.
Trusted by 1+ million students worldwide
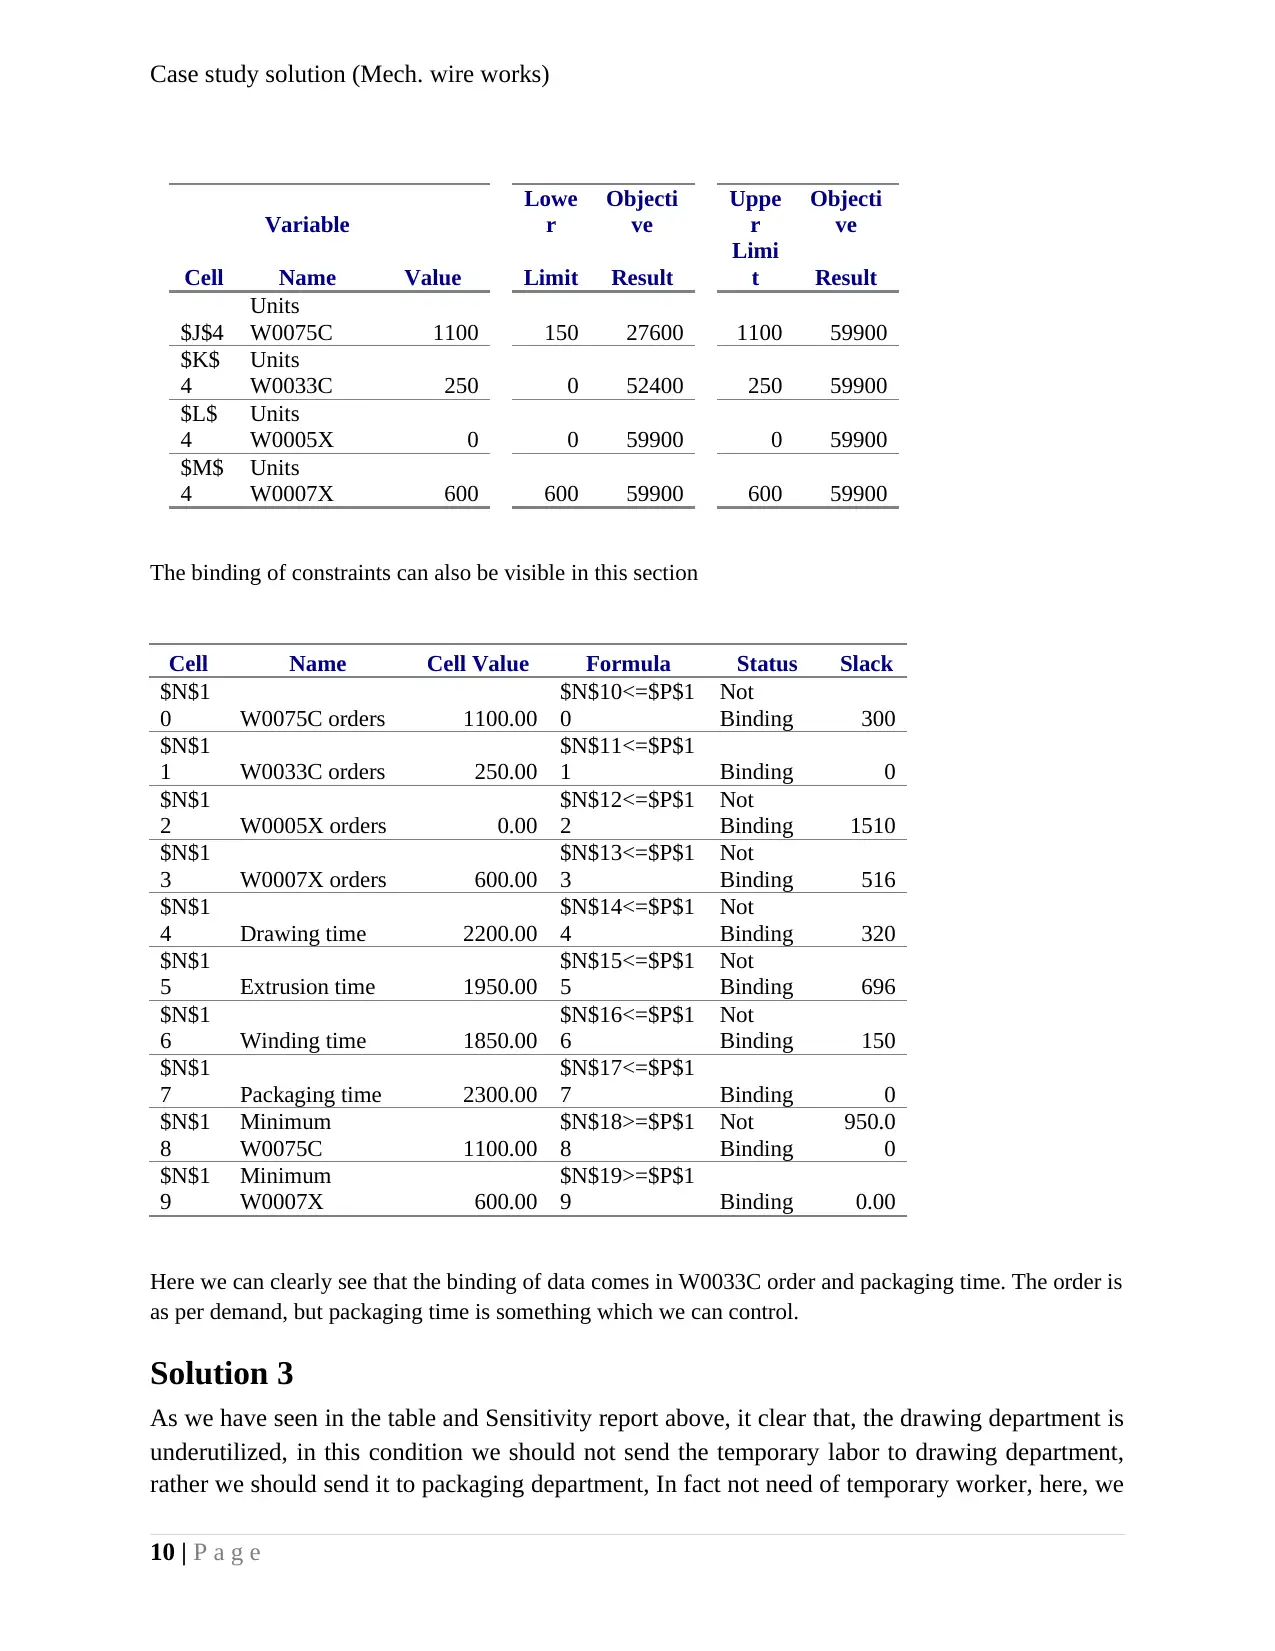
Case study solution (Mech. wire works)
Variable
Lowe
r
Objecti
ve
Uppe
r
Objecti
ve
Cell Name Value Limit Result
Limi
t Result
$J$4
Units
W0075C 1100 150 27600 1100 59900
$K$
4
Units
W0033C 250 0 52400 250 59900
$L$
4
Units
W0005X 0 0 59900 0 59900
$M$
4
Units
W0007X 600 600 59900 600 59900
The binding of constraints can also be visible in this section
Cell Name Cell Value Formula Status Slack
$N$1
0 W0075C orders 1100.00
$N$10<=$P$1
0
Not
Binding 300
$N$1
1 W0033C orders 250.00
$N$11<=$P$1
1 Binding 0
$N$1
2 W0005X orders 0.00
$N$12<=$P$1
2
Not
Binding 1510
$N$1
3 W0007X orders 600.00
$N$13<=$P$1
3
Not
Binding 516
$N$1
4 Drawing time 2200.00
$N$14<=$P$1
4
Not
Binding 320
$N$1
5 Extrusion time 1950.00
$N$15<=$P$1
5
Not
Binding 696
$N$1
6 Winding time 1850.00
$N$16<=$P$1
6
Not
Binding 150
$N$1
7 Packaging time 2300.00
$N$17<=$P$1
7 Binding 0
$N$1
8
Minimum
W0075C 1100.00
$N$18>=$P$1
8
Not
Binding
950.0
0
$N$1
9
Minimum
W0007X 600.00
$N$19>=$P$1
9 Binding 0.00
Here we can clearly see that the binding of data comes in W0033C order and packaging time. The order is
as per demand, but packaging time is something which we can control.
Solution 3
As we have seen in the table and Sensitivity report above, it clear that, the drawing department is
underutilized, in this condition we should not send the temporary labor to drawing department,
rather we should send it to packaging department, In fact not need of temporary worker, here, we
10 | P a g e
Paraphrase This Document
Need a fresh take? Get an instant paraphrase of this document with our AI Paraphraser
Case study solution (Mech. wire works)
can utilize own worker of the company to manage the packaging department, One important
information from the above reports is that, if we increase packaging hour by 1, out inherited
profit will rise by $34, this packaging hour can go up to, 2500 hour without any additional
resources. But if we further want to increase the profitability, we have to add some winding hour
also, this will give leverage to increase the profit.
Conclusion
The use of excel solver becomes very common for purpose of optimization problem. The main
reason behind this is easy to use Solver tools given in Microsoft excel. The use of complex
mathematical concept is history, when linear programming being solved by Simplex method or
any other manual method, in 1950s when linear programing first used in US military, to find the
low cost diet with highest nutrition value by Jerry Cornfield, it took 2 years to find the optimized
value, but today with the use of computer we can dot in two hours or less.
This is the report which can be presented by John Smith to the management. There are various
other possible permutation and combination of data by which we can analyses the result obtained
from solver. If manpower is given for department, we can reschedule the entire problem in better
optimization using this solver.
Works Cited
Ahmed Ghaithan, A, A, S, D, 2017, Multi-objective optimization model for a downstream oil
and gas supply chain, King Fahd University of Petroleum & Minerals, 1(1), pp, 1-20.
Anon, 2016, Lean Six Sigma Applications in Oil and Gas Industry: Case Studies, The Petroleum
Institute, 1(1), pp, 1-5.
Barker, J, A, 2014, From the Depths of Despair to the Promise of Presence, 1st ed, New York:
Eisenbrauns.
Ba-Shammakh, M, 2009, An Optimization Approach for Integrating Planning and CO2
Mitigation in the Power and Refinery Sectors, University of Waterloo, pp, 1-202.
Choudhary, A, 2014, ANALYSIS AND DESIGN OF SUPPLY CHAIN MODEL FOR A
SPECIFIC ORGANISATION, The Macrotheme Review, pp, 1-36.
11 | P a g e
Case study solution (Mech. wire works)
Jaber, D, S, A, A, 2015, ADNOC group sustainability report, Adnoc journal, pp, 1-11.
Jianhua Dai, S, P, S, L, 2017, Mitigation of Bullwhip Effect in Supply Chain Inventory
Management Model, Manufacturing and Management, 1(1), pp, 1-6.
Joseph Geunes, P, P, 2009, Supply chian optimisation, Applied Optimization techniques, 98(1),
pp, 1-418.
ling, R, 2017, Investment guide to UAE, Framework for investments journal, 1(1), pp, 1-48.
Mahmood, Y, H, 2015, Capacity consraints management stretegies and supply chian
performance of petroleum industries, Business adminitration school journal, 1(1), pp, 1-81.
Michael Talmadge, L, B, P, L, 2016, Optimizing Biorefinery Design and Operations via Linear
Programming Models, Symposium on Thermal and Catalytic Sciences, pp, 1-1.
O’Leary, 2014, Introduction to literature review, Literature review, 1(1), pp, 1-9.
Panos Pardalos, D,-Z, D, 2009, Optimisation and logistic challenges in the enterprize, Springer
Optimization and Its Applications, 1(1), pp, 1-430.
Raed Hussaian, B, K, 2006, Supply Chain Management in the PetroleumIndustry: Challenges
and Opportunities, International Journal of Global Logistics & Supply Chain Management, 1(2),
pp, 90-97.
Sharada Vadali, S, C, 2016, Buyer-Supplier Transport Access Measures for Industry Clusters,
Texas A&M University System, 1(1), pp, 1-11.
12 | P a g e
⊘ This is a preview!⊘
Do you want full access?
Subscribe today to unlock all pages.
Trusted by 1+ million students worldwide
1 out of 12
Related Documents


Your All-in-One AI-Powered Toolkit for Academic Success.
+13062052269
info@desklib.com
Available 24*7 on WhatsApp / Email
![[object Object]](/_next/static/media/star-bottom.7253800d.svg)
Unlock your academic potential
Copyright © 2020–2026 A2Z Services. All Rights Reserved. Developed and managed by ZUCOL.