EG-285 Supplementary Work: Data Analysis and Interpretation

Verified

Added on  2022/10/04

|8
|532
|17
Homework Assignment
AI Summary
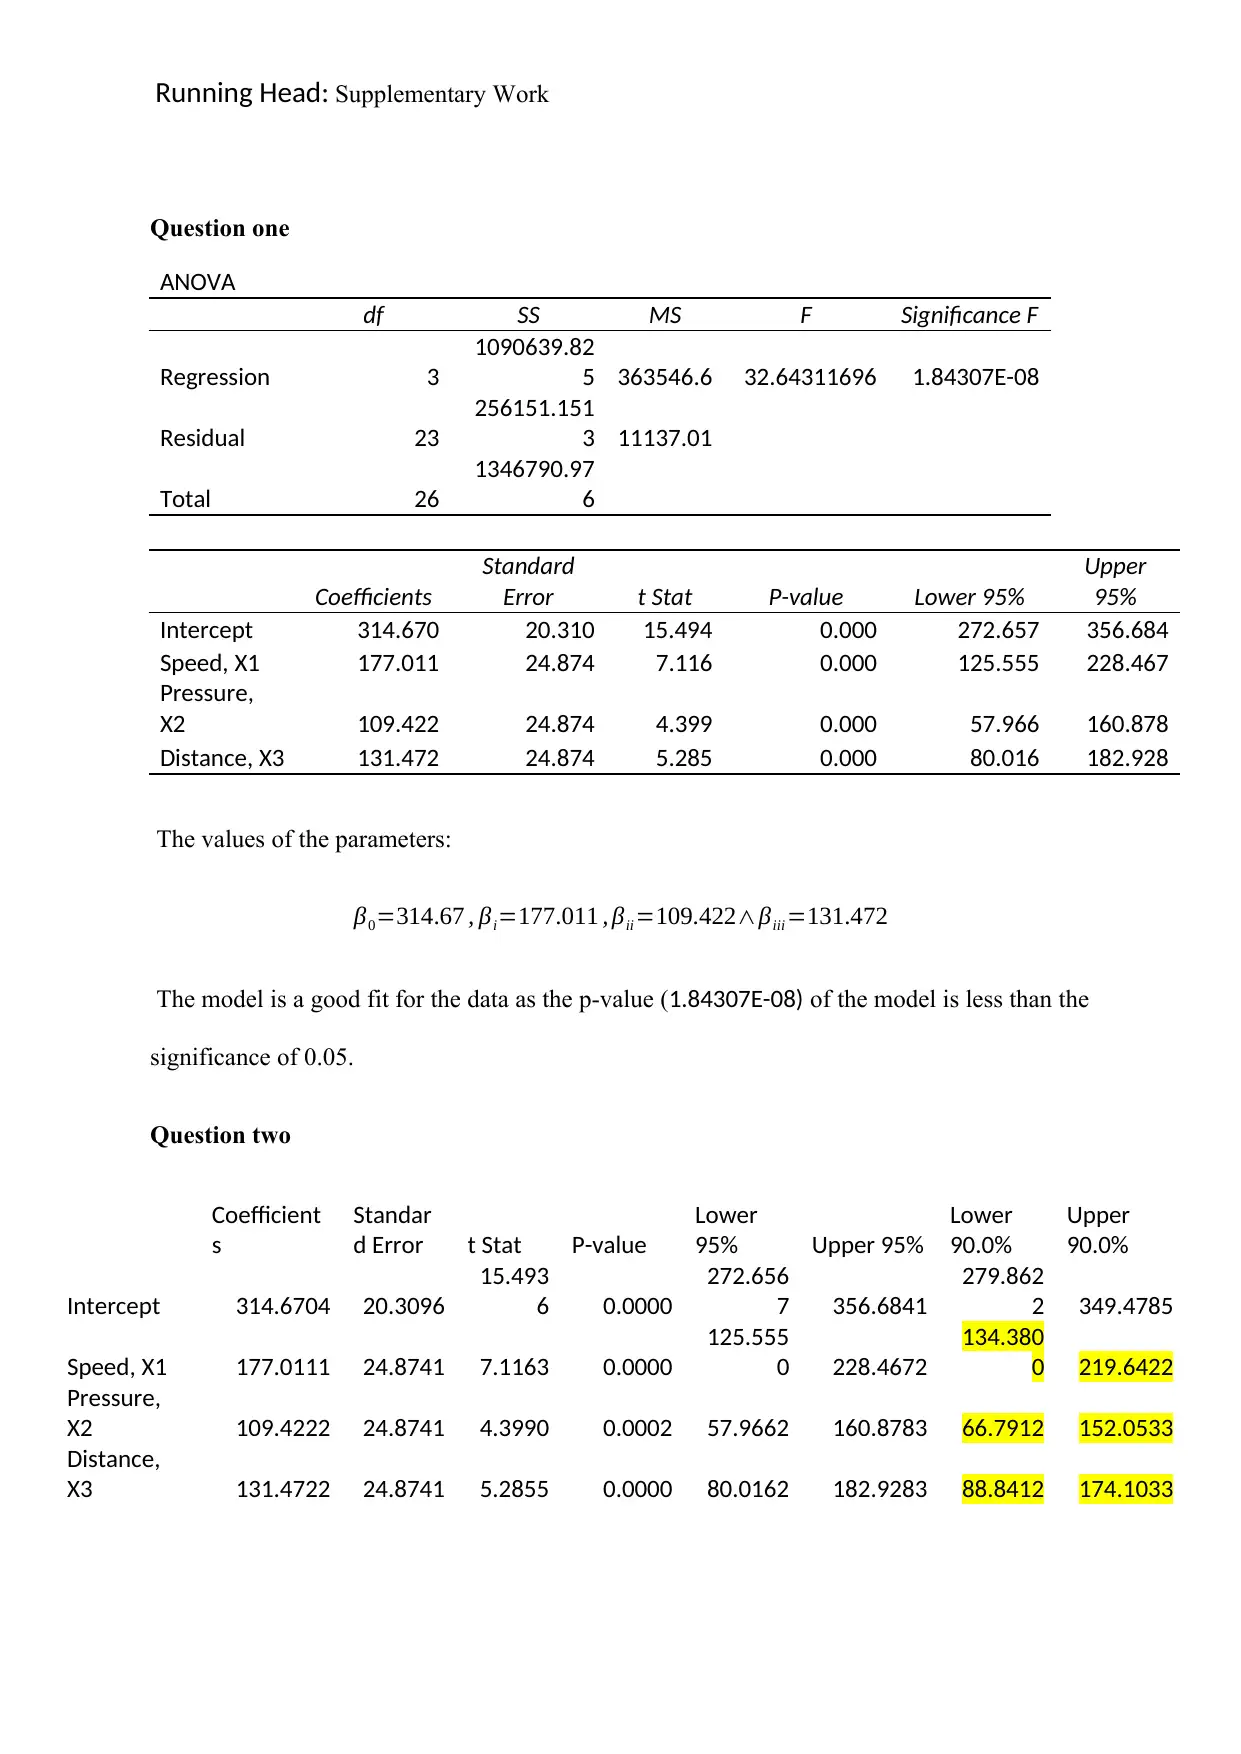
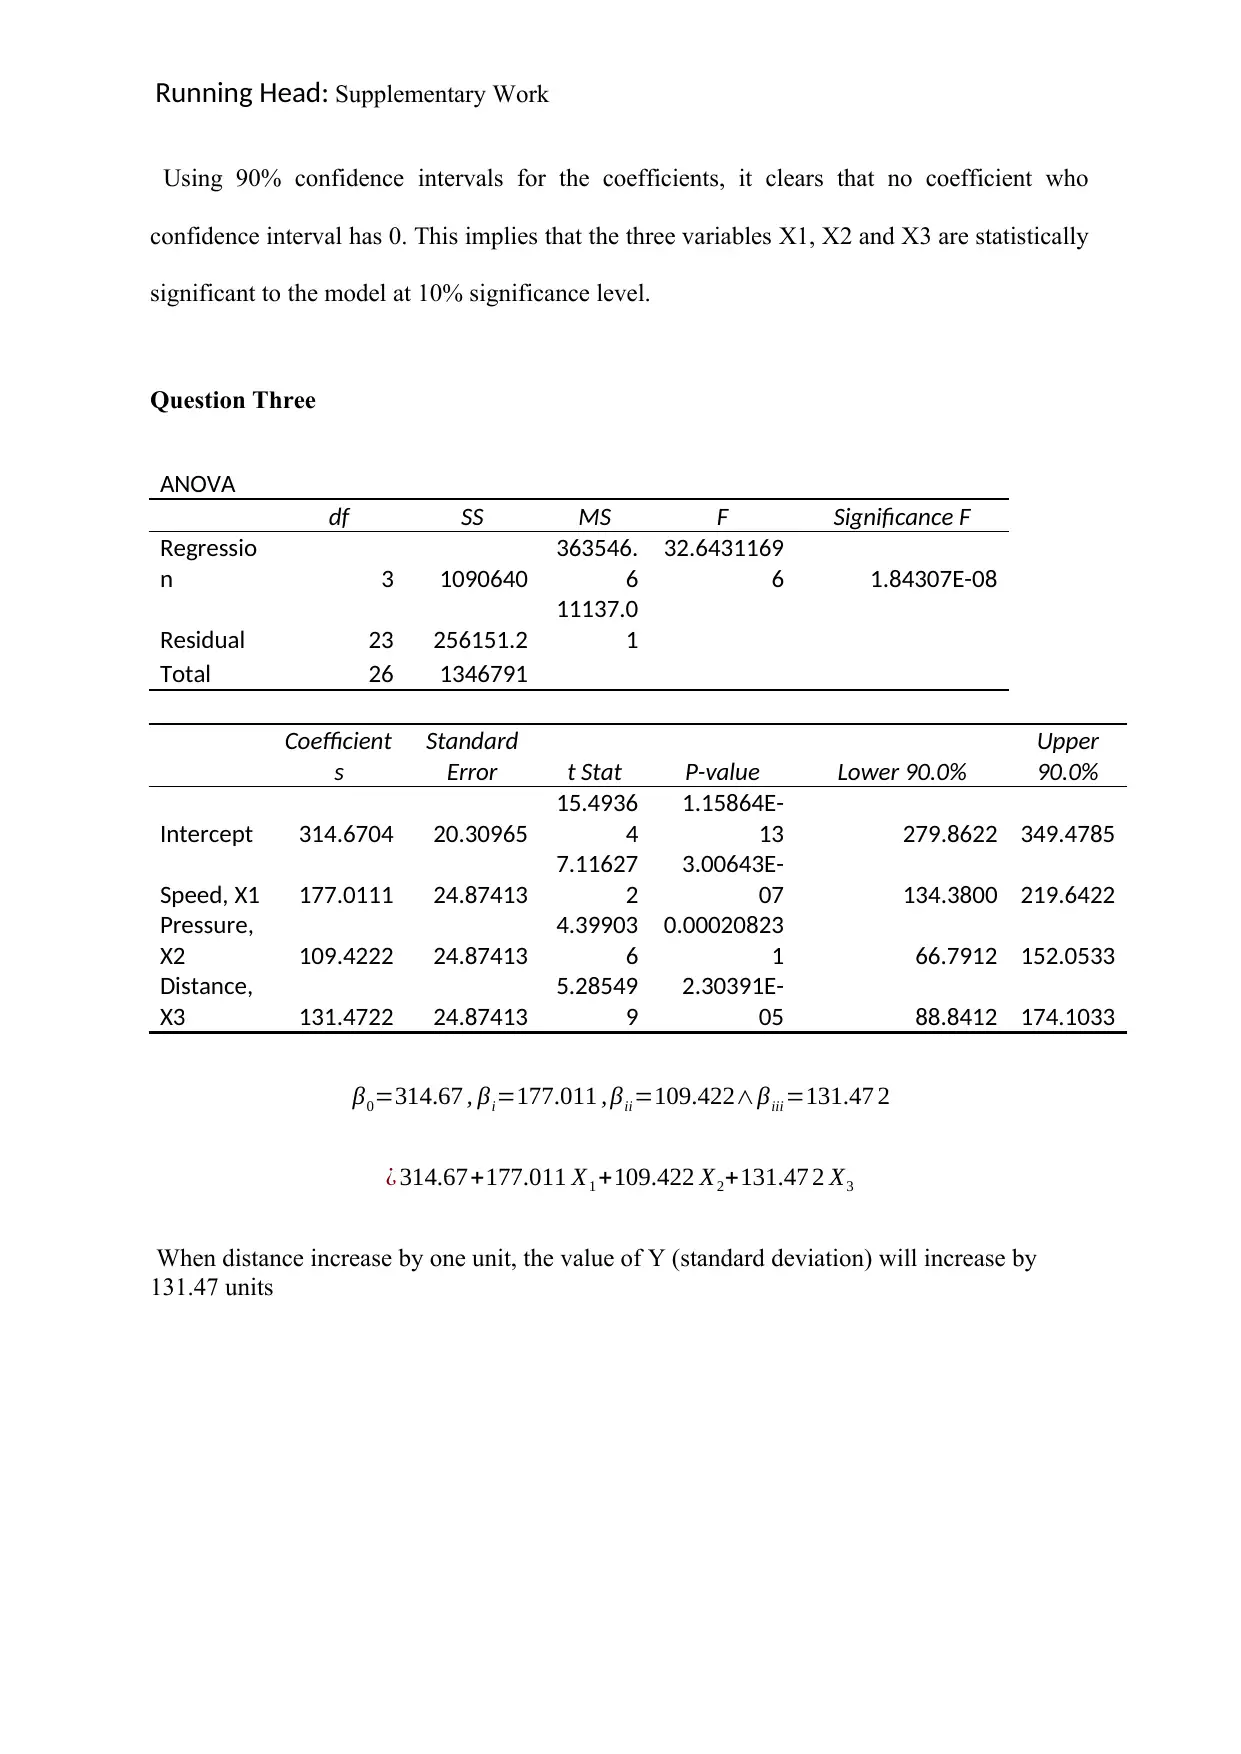
This document provides solutions to the EG-285 supplementary work assignment, focusing on data analysis and statistical methods. The assignment analyzes two datasets: the first examines the times between failures of air conditioning equipment, exploring distributions (Poisson, Weibull, and exponential) and confidence intervals. The second dataset investigates semiconductor wafer yield, utilizing ANOVA to assess the impact of speed, pressure, and distance on yield, and interpreting regression coefficients and confidence intervals to determine the significance of various factors. The solution includes detailed analysis, calculations, and interpretations of the results, providing a comprehensive understanding of the data and statistical techniques used.
Document Page
Running Head: Supplementary Work
EG-285: Supplementary Work
Student’s Name
Institution Affiliation
tabler-icon-diamond-filled.svg

Secure Best Marks with AI Grader

Need help grading? Try our AI Grader for instant feedback on your assignments.
Document Page
Running Head: Supplementary Work
Questions on Data Set 1.
Question one
Actual Times to failures need to have a Poisson distribution.
Question Two
a. less than 1.07 years,
P ( x<1.07 ) =1e0.935(1.07)=0.632
b. more than 1.34 years
P ( x>1.34 ) =e0.935 ( 1.07 )
¿ 0.8 6
c. Between 0.5 and 0.75 years.
P ( 0.5< x <0.75 )= ( 1e0.935 (0.75 ) ) ( 1e0.935 ( 0.5 ) )
¿ 0.13 1
Question Three
Weibull probability plot
-0.600 -0.400 -0.200 0.000 0.200 0.400 0.600 0.800
-4
-3.5
-3
-2.5
-2
-1.5
-1
-0.5
0
Weibull Probability Plot
X
Y(pdf)
Document Page
Running Head: Supplementary Work
Exponential probability plot
0.4 0.6 0.8 1 1.2 1.4 1.6 1.8 2
0.000
0.100
0.200
0.300
0.400
0.500
0.600 Exponetial probability plot
X
Y (pdf)
From the two charts, it’s evident that the exponential probability plot forms a linear
pattern as opposed to Weibull that forms a non-linear pattern. This suggests that the
times between failures are exponentially distributed as opposed to Weibull.
Question Four
i. The 63rd quantile of the times between failure s
The 63rd quantile of the times between failures is 1.19
ii. ii. the value for .
Question Five
The confidence interval is given by
CI =Q63 ± z0.95S
n , where s=standard deviation , n=smaple ¿ ¿
Q=quantile , z0.95=zscore at 95 % , n=smaple ¿ ¿
Q63=1.19 years
Document Page
Running Head: Supplementary Work
S=0.27 years z0.95=1.96
n=20
Therefore, the CI
¿ 1.19 ± 1.960.27
20
Thus CI will be (1.071, 1.309)
From the CI it’s clear that the Q63 is different from 0, 0 is not within CI range;
between 1.071 and 1.309.
Question Six
Other distribution that Weibull distribution approximates is exponential distribution
especially when the failure rate is a constant value.
Questions on Data Set 2.
tabler-icon-diamond-filled.svg

Secure Best Marks with AI Grader

Need help grading? Try our AI Grader for instant feedback on your assignments.
Document Page
Running Head: Supplementary Work
Question one
ANOVA
df SS MS F Significance F
Regression 3
1090639.82
5 363546.6 32.64311696 1.84307E-08
Residual 23
256151.151
3 11137.01
Total 26
1346790.97
6
Coefficients
Standard
Error t Stat P-value Lower 95%
Upper
95%
Intercept 314.670 20.310 15.494 0.000 272.657 356.684
Speed, X1 177.011 24.874 7.116 0.000 125.555 228.467
Pressure,
X2 109.422 24.874 4.399 0.000 57.966 160.878
Distance, X3 131.472 24.874 5.285 0.000 80.016 182.928
The values of the parameters:
β0=314.67 , βi=177.011 , βii=109.422βiii =131.472
The model is a good fit for the data as the p-value (1.84307E-08) of the model is less than the
significance of 0.05.
Question two
Coefficient
s
Standar
d Error t Stat P-value
Lower
95% Upper 95%
Lower
90.0%
Upper
90.0%
Intercept 314.6704 20.3096
15.493
6 0.0000
272.656
7 356.6841
279.862
2 349.4785
Speed, X1 177.0111 24.8741 7.1163 0.0000
125.555
0 228.4672
134.380
0 219.6422
Pressure,
X2 109.4222 24.8741 4.3990 0.0002 57.9662 160.8783 66.7912 152.0533
Distance,
X3 131.4722 24.8741 5.2855 0.0000 80.0162 182.9283 88.8412 174.1033
Document Page
Running Head: Supplementary Work
Using 90% confidence intervals for the coefficients, it clears that no coefficient who
confidence interval has 0. This implies that the three variables X1, X2 and X3 are statistically
significant to the model at 10% significance level.
Question Three
ANOVA
df SS MS F Significance F
Regressio
n 3 1090640
363546.
6
32.6431169
6 1.84307E-08
Residual 23 256151.2
11137.0
1
Total 26 1346791
Coefficient
s
Standard
Error t Stat P-value Lower 90.0%
Upper
90.0%
Intercept 314.6704 20.30965
15.4936
4
1.15864E-
13 279.8622 349.4785
Speed, X1 177.0111 24.87413
7.11627
2
3.00643E-
07 134.3800 219.6422
Pressure,
X2 109.4222 24.87413
4.39903
6
0.00020823
1 66.7912 152.0533
Distance,
X3 131.4722 24.87413
5.28549
9
2.30391E-
05 88.8412 174.1033
β0=314.67 , βi=177.011 , βii=109.422βiii =131.47 2
¿ 314.67+177.011 X1 +109.422 X2+131.47 2 X3
When distance increase by one unit, the value of Y (standard deviation) will increase by
131.47 units
Document Page
Running Head: Supplementary Work
Question Four
-1.5 -1 -0.5 0 0.5 1 1.5
0
200
400
600
800
1000
1200
f(x) = 177.011111111111 x + 314.67037037037
Standard Deviation in coating
thickness, Y Against Speed(X1)
Speed(X1)
Standard deviation
-1.5 -1 -0.5 0 0.5 1 1.5
0
200
400
600
800
1000
1200
f(x) = 109.422222222222 x + 314.67037037037
Standard Deviation in coating
thickness, Y Against Pressure(X2)
Pressure(X2)
Standard Deviation
tabler-icon-diamond-filled.svg

Paraphrase This Document

Need a fresh take? Get an instant paraphrase of this document with our AI Paraphraser
Document Page
Running Head: Supplementary Work
-1.5 -1 -0.5 0 0.5 1 1.5
0
200
400
600
800
1000
1200
f(x) = 131.472222222222 x + 314.67037037037
Standard Deviation in coating
thickness, Y Against Distance
Distance
Standard deviation
From the three charts, it’s clear that the test conditions whose linear model will maximise the
yield of the process are Speed and Distance when pressure is held constant.
chevron_up_icon
1 out of 8
circle_padding
hide_on_mobile
zoom_out_icon
logo.png

Your All-in-One AI-Powered Toolkit for Academic Success.

Available 24*7 on WhatsApp / Email

[object Object]