Tensile Testing Laboratory Report: Analysis of Material Strengths
VerifiedAdded on 2021/06/14
|23
|2944
|265
Report
AI Summary
This report details a tensile testing laboratory experiment conducted on six different materials: Annealed steel, Poly vinyl chloride (PVC), copper, polymethylmethacrylate (PMMA), tempered steel, and plywood. The experiment utilized a load frame to subject the materials to tensile stress, and data was collected to determine key mechanical properties, including ultimate tensile strength. The methodology involved measuring samples, scribing gage lengths, and performing tests according to ASTM standards. Results were presented in stress-strain curves, and the ultimate tensile strength for each material was calculated. The findings showed that Annealed steel exhibited the highest tensile strength, followed by tempered steel, copper, PMMA, PVC, and plywood. The report includes data tables, graphical representations, and a discussion of the results, including comparisons of true and engineering stress-strain.
Tensile Testing Laboratory
Abstract
Tensile tests are central for understanding properties of various materials, and how they will
carry on under load. This lab tested six unique materials, including Annealed steel, Poly vinyl
chloride (PVC), copper, polymethylmethacrylate (PMMA) and tempered steel. Every material
were tested three times using a load frame. The information from each test was used to determine
important material properties of extreme elasticity. This material property was utilized for
contrasting the materials with each other, and to characterize the material as brittle or malleable.
The result of the tensile tests demonstrated that the Annealed steel was the strongest material. It
had the most ultimate tensile strength (520 MPa), followed by tempered steel which had 470
MPa, copper having 365 MPa, PMMA had 80 MPa, PVC had 60 MPa and finally plywood
which had 50 MPa.
Contents
Abstract.......................................................................................................................................................1
Paraphrase This Document
Need a fresh take? Get an instant paraphrase of this document with our AI Paraphraser
Introduction.................................................................................................................................................3
Methodology...............................................................................................................................................4
Procedure................................................................................................................................................4
Results.....................................................................................................................................................6
Data and calculation............................................................................................................................6
Material Properties...................................................................................................................................18
True Stress and True Strain....................................................................................................................18
Discussion..................................................................................................................................................19
Appendix A................................................................................................................................................20
Appendix B................................................................................................................................................21
Introduction
Tensile testing is a standout amongst the most key tests for building, and gives valuable data
about a material and its related properties. These properties can be utilized for plan and
examination of designing structures and for developing new materials that better suit a
predefined use.
The tensile testing laboratory was conducted using a load frame and the six distinct materials
were tested, including Annealed steel, Poly vinyl chloride (PVC), copper,
polymethylmethacrylate (PMMA) and tempered steel. The examples were rectangular in cross
segment, with a decreased gage area. The reduce gage segment guaranteed that the most elevated
burdens happened inside the gage, and not close to the grasps of the heap outline, avoiding strain
and crack of the example close or in the holds. The examples were at that point machined to the
correct measurements required for the test, as indicated by ASTM gauges.
Three examples of every material were tried in the load frame, and the information accumulated
into an Excel spreadsheet. The information was utilized to compute tensile property of every
material. The data was then plotted on engineering stress-strain curves to compare the samples.
The reason for this investigation was to assemble data about every material so imperative
mechanical properties could be resolved. This test likewise acclimated the understudies with the
load frame that was utilized and the general strides to playing out a malleable test on a
diminished gage area example.
⊘ This is a preview!⊘
Do you want full access?
Subscribe today to unlock all pages.
Trusted by 1+ million students worldwide
Methodology
Procedure
Every example was estimated with the calipers to decide the measurement of the cross segment.
A gage length was resolved (50.00 mm) and scribed into the example with the goal that the
separation between the two imprints could be estimated after the elastic test was finished.
Normal lessened gage segment examples are appeared in Figure 1. The Lab see information
procurement programming was begun, and the right material was picked. The heap cell was
focused to guarantee that the product just estimated the malleable load connected to the example.
The samples were stacked into the jaws of the Instron load frame with the goal that it was
similarly divided between the two clasps. The hub and transverse extensometers were joined to
the decreased gage area of the example, guaranteeing that the pivotal extensometer was set
effectively while appending it to the gage and that the transverse extensometer was over the total
measurement of the example. This precautionary measure brings about better information and
forestalls harm to the extensometers.
The Instron load frame, appeared in Figure 2 was preloaded utilizing the parchment wheel to
guarantee that the sample was legitimately loaded on the frame, and that it wasn't slipping in the
jaws. The load was discharged, and the extensometers were focused utilizing the Lab view
programming. The test was begun, and the sample was loaded, bringing about a quantifiable
strain. For the steel and copper tests, the crosshead was at first set to move upward at 1.25
mm/min, at that point at 15 mm/min at a predefined state past yielding. This expansion in the
rate of strain accelerated the test, however may have likewise presented some blunder. The poly
vinyl chloride (PVC) test began at 5 mm/min and was later accelerate to 30 mm/min. The
PMMA tests were pulled at a steady rate of 10 mm/min.
The information was accumulated utilizing the product, and stacked into a spreadsheet. At a set
estimation of strain (past the yield strain), the product prevented utilizing information from the
extensometers, and began gathering the strain data utilizing the situation of the moving
crosshead. A notice message came up on the PC screen, educating the administrator to expel the
extensometers to avert harm. The test proceeded until break, where the product ceased the
moving crosshead, and completed the process of social affair information. The example was
Paraphrase This Document
Need a fresh take? Get an instant paraphrase of this document with our AI Paraphraser
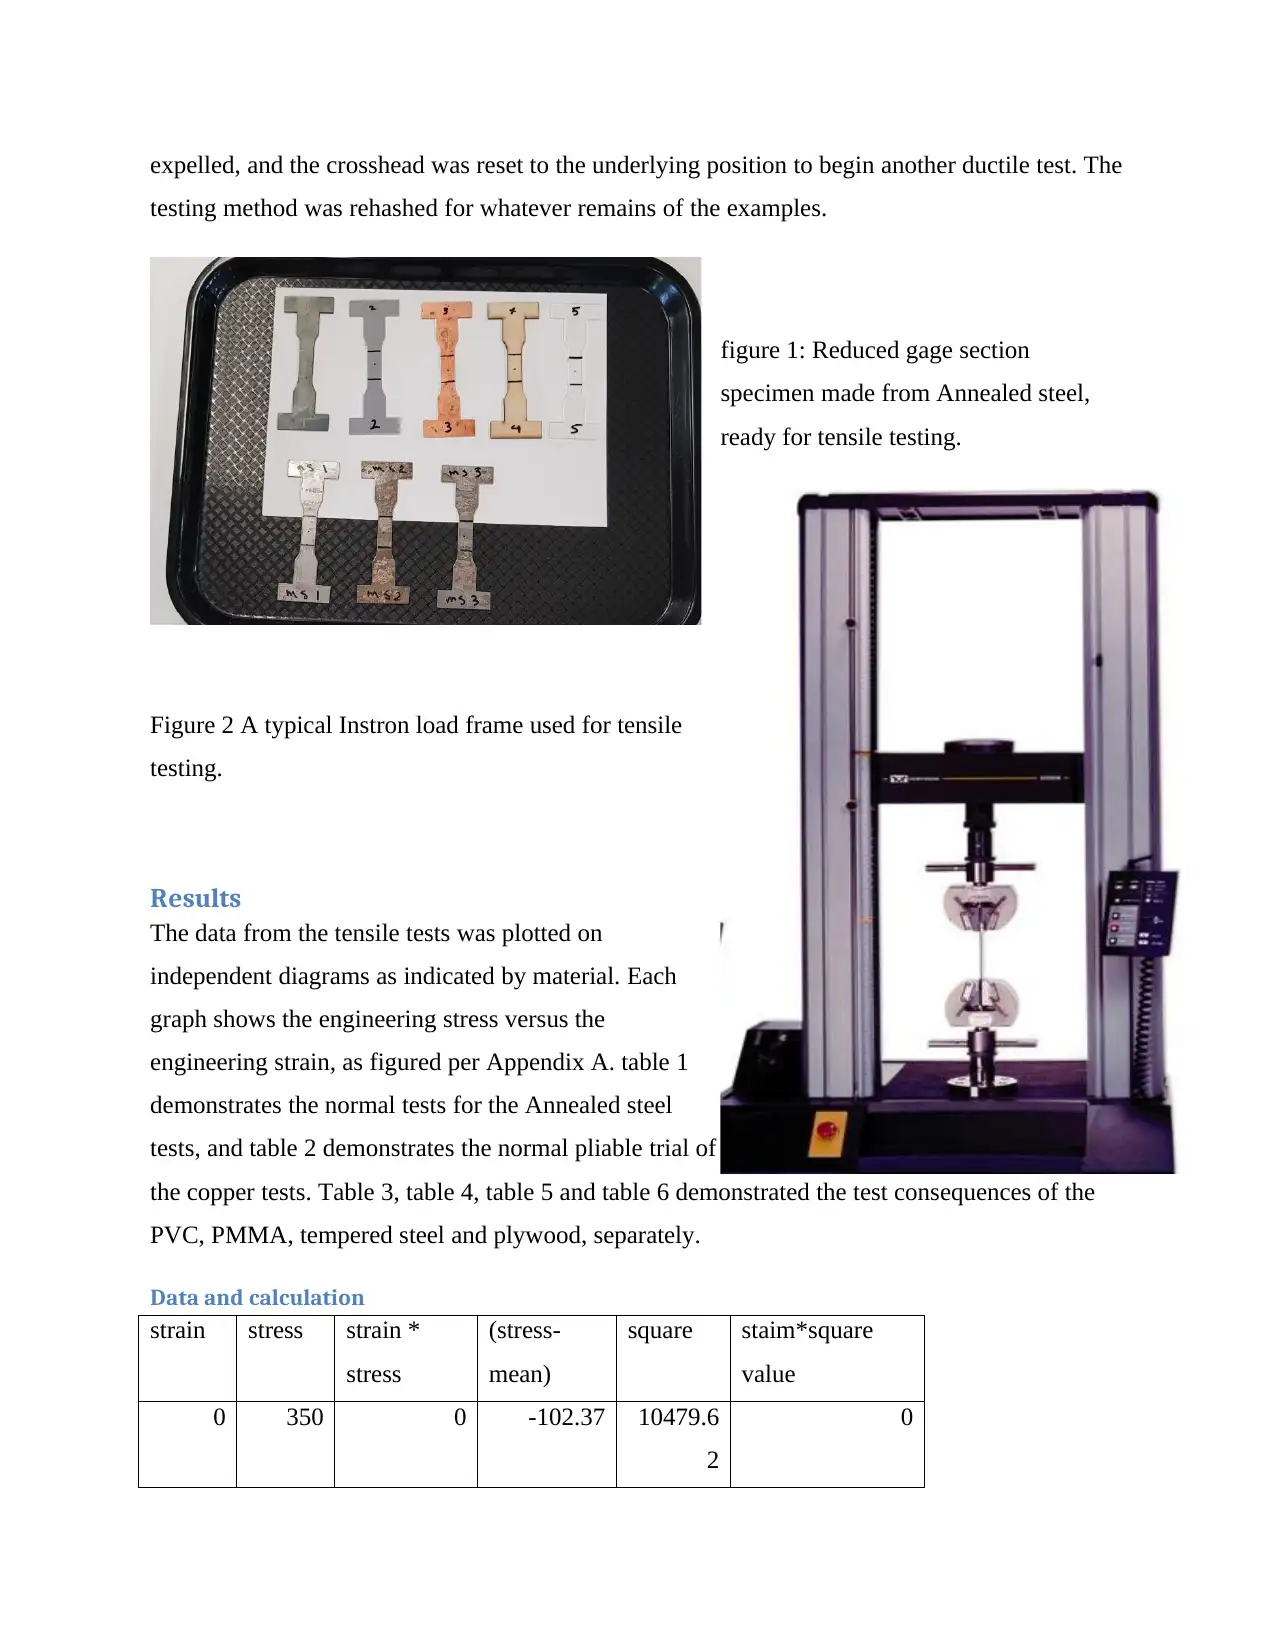
expelled, and the crosshead was reset to the underlying position to begin another ductile test. The
testing method was rehashed for whatever remains of the examples.
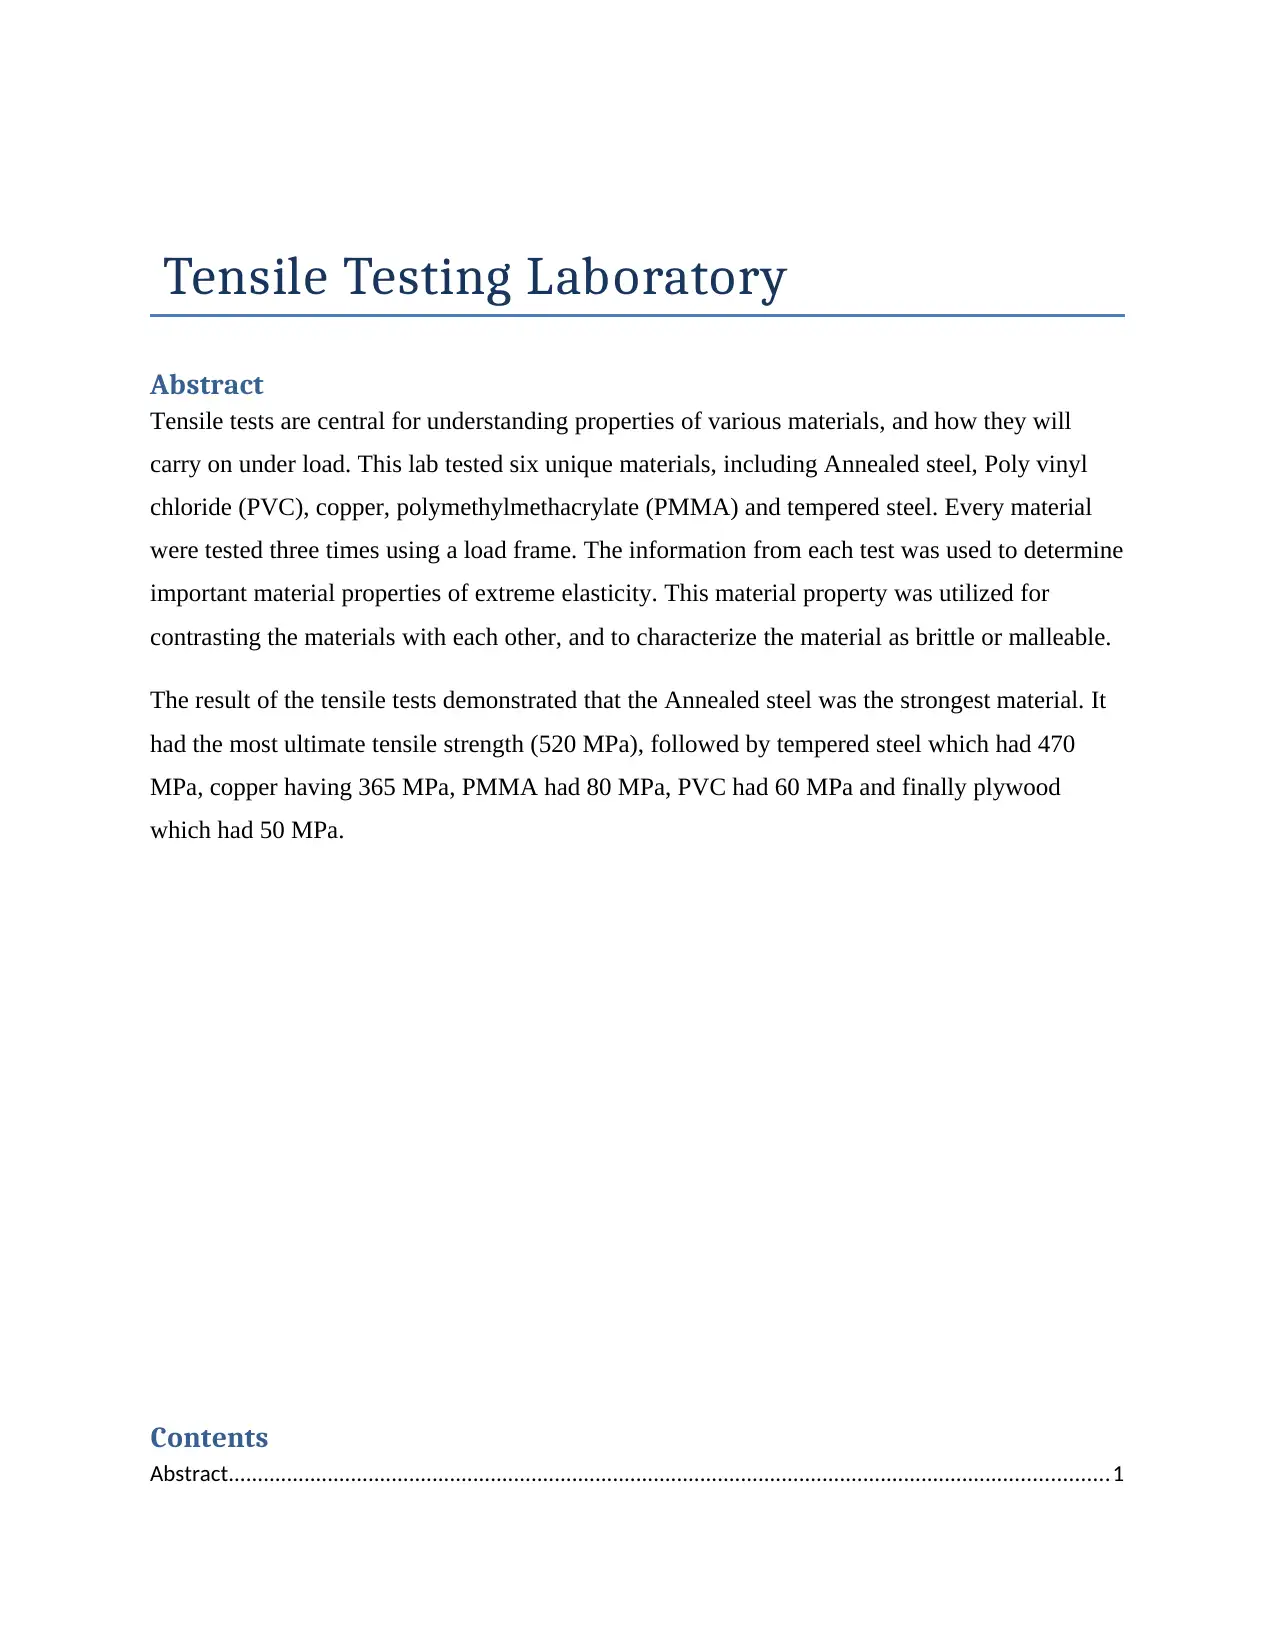
figure 1: Reduced gage section
specimen made from Annealed steel,
ready for tensile testing.
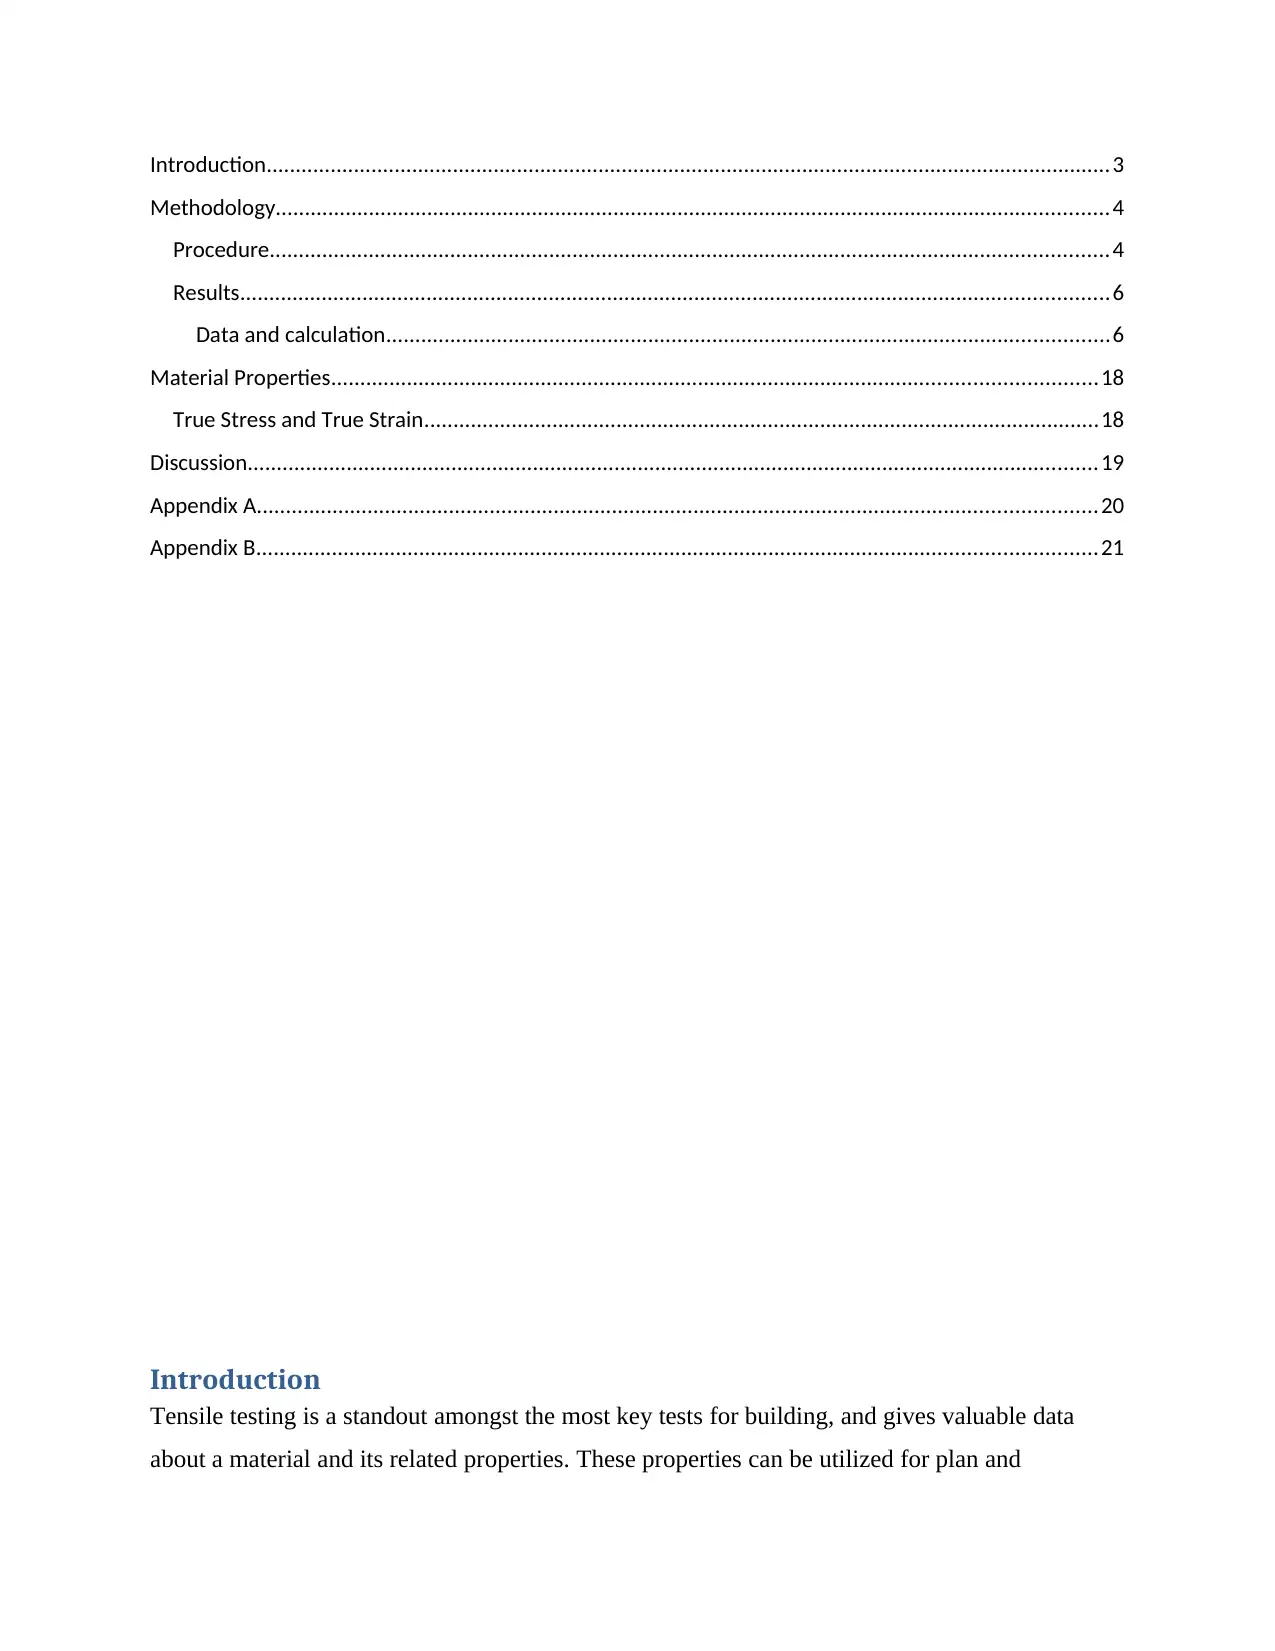
Figure 2 A typical Instron load frame used for tensile
testing.
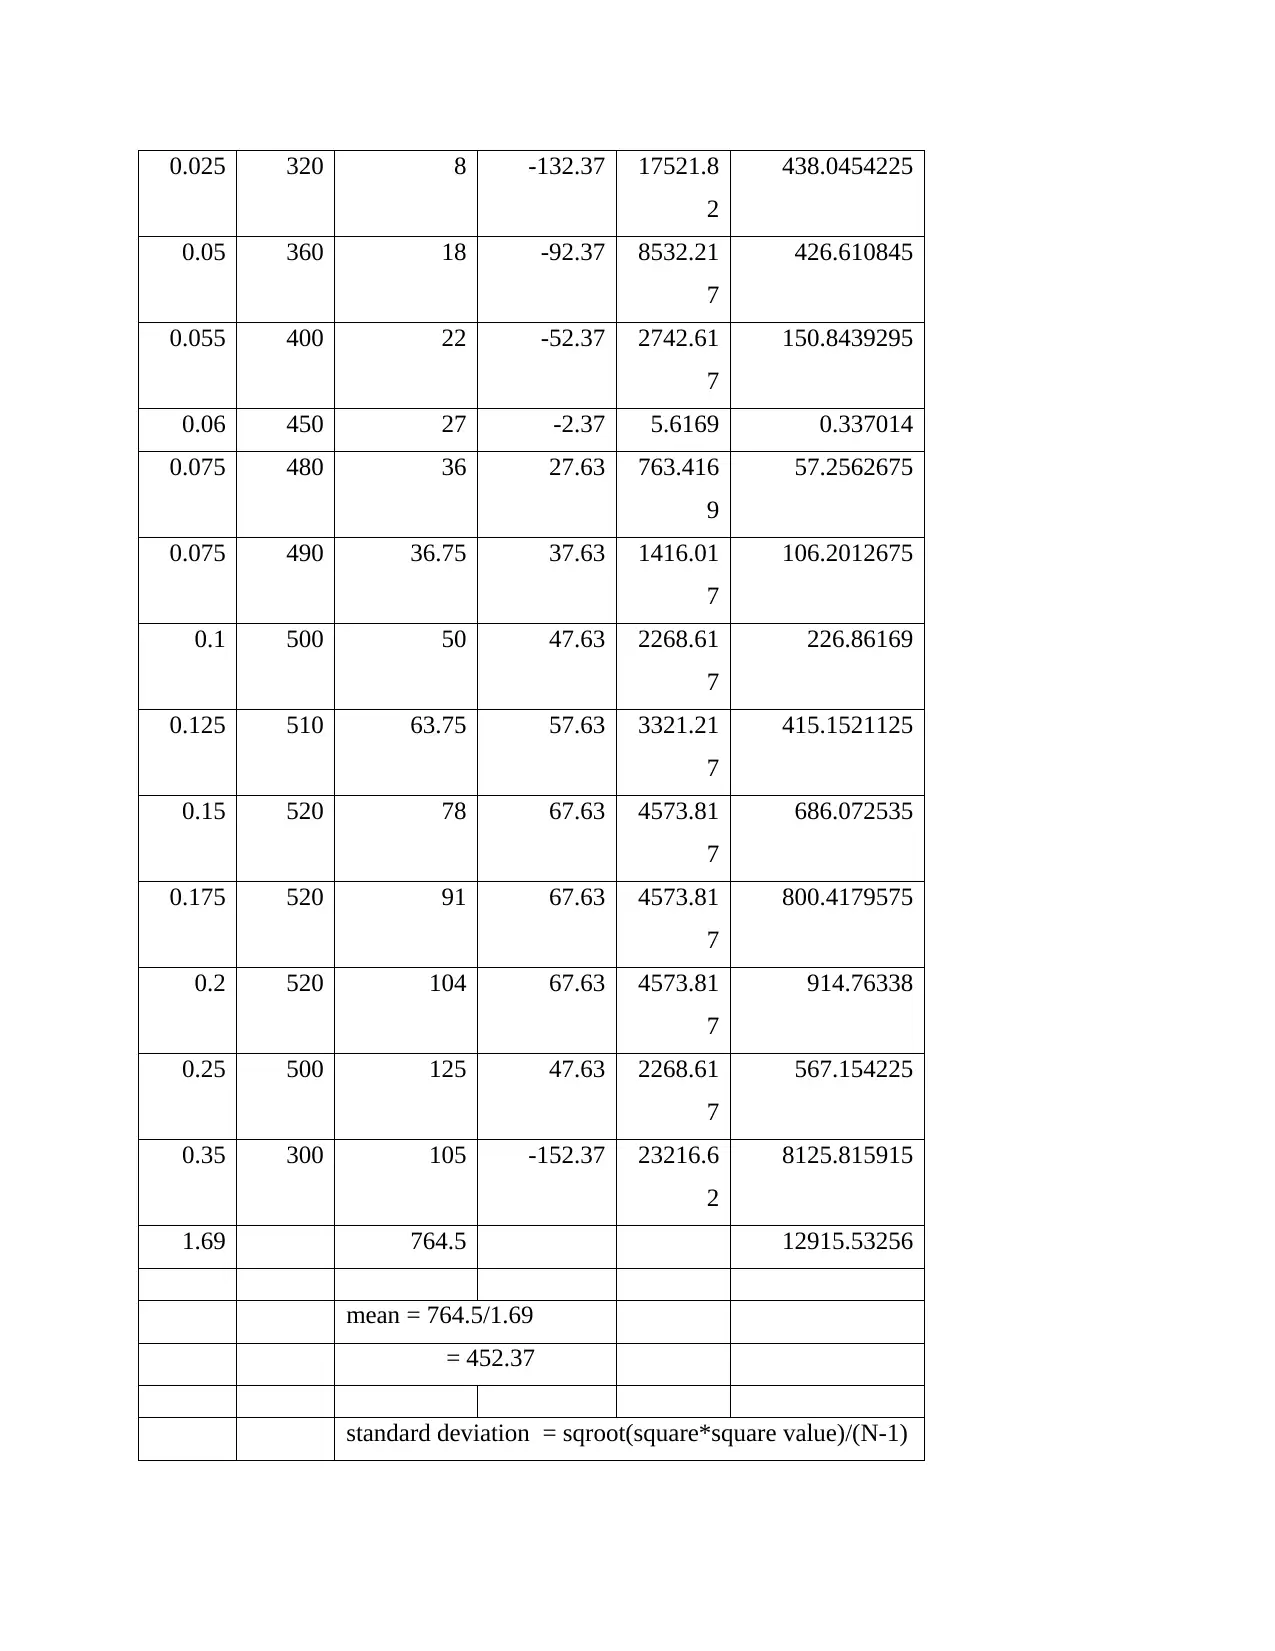
Results
The data from the tensile tests was plotted on
independent diagrams as indicated by material. Each
graph shows the engineering stress versus the
engineering strain, as figured per Appendix A. table 1
demonstrates the normal tests for the Annealed steel
tests, and table 2 demonstrates the normal pliable trial of
the copper tests. Table 3, table 4, table 5 and table 6 demonstrated the test consequences of the
PVC, PMMA, tempered steel and plywood, separately.
Data and calculation
strain stress strain *
stress
(stress-
mean)
square staim*square
value
0 350 0 -102.37 10479.6
2
0
testing method was rehashed for whatever remains of the examples.
figure 1: Reduced gage section
specimen made from Annealed steel,
ready for tensile testing.
Figure 2 A typical Instron load frame used for tensile
testing.
Results
The data from the tensile tests was plotted on
independent diagrams as indicated by material. Each
graph shows the engineering stress versus the
engineering strain, as figured per Appendix A. table 1
demonstrates the normal tests for the Annealed steel
tests, and table 2 demonstrates the normal pliable trial of
the copper tests. Table 3, table 4, table 5 and table 6 demonstrated the test consequences of the
PVC, PMMA, tempered steel and plywood, separately.
Data and calculation
strain stress strain *
stress
(stress-
mean)
square staim*square
value
0 350 0 -102.37 10479.6
2
0
0.025 320 8 -132.37 17521.8
2
438.0454225
0.05 360 18 -92.37 8532.21
7
426.610845
0.055 400 22 -52.37 2742.61
7
150.8439295
0.06 450 27 -2.37 5.6169 0.337014
0.075 480 36 27.63 763.416
9
57.2562675
0.075 490 36.75 37.63 1416.01
7
106.2012675
0.1 500 50 47.63 2268.61
7
226.86169
0.125 510 63.75 57.63 3321.21
7
415.1521125
0.15 520 78 67.63 4573.81
7
686.072535
0.175 520 91 67.63 4573.81
7
800.4179575
0.2 520 104 67.63 4573.81
7
914.76338
0.25 500 125 47.63 2268.61
7
567.154225
0.35 300 105 -152.37 23216.6
2
8125.815915
1.69 764.5 12915.53256
mean = 764.5/1.69
= 452.37
standard deviation = sqroot(square*square value)/(N-1)
2
438.0454225
0.05 360 18 -92.37 8532.21
7
426.610845
0.055 400 22 -52.37 2742.61
7
150.8439295
0.06 450 27 -2.37 5.6169 0.337014
0.075 480 36 27.63 763.416
9
57.2562675
0.075 490 36.75 37.63 1416.01
7
106.2012675
0.1 500 50 47.63 2268.61
7
226.86169
0.125 510 63.75 57.63 3321.21
7
415.1521125
0.15 520 78 67.63 4573.81
7
686.072535
0.175 520 91 67.63 4573.81
7
800.4179575
0.2 520 104 67.63 4573.81
7
914.76338
0.25 500 125 47.63 2268.61
7
567.154225
0.35 300 105 -152.37 23216.6
2
8125.815915
1.69 764.5 12915.53256
mean = 764.5/1.69
= 452.37
standard deviation = sqroot(square*square value)/(N-1)
⊘ This is a preview!⊘
Do you want full access?
Subscribe today to unlock all pages.
Trusted by 1+ million students worldwide
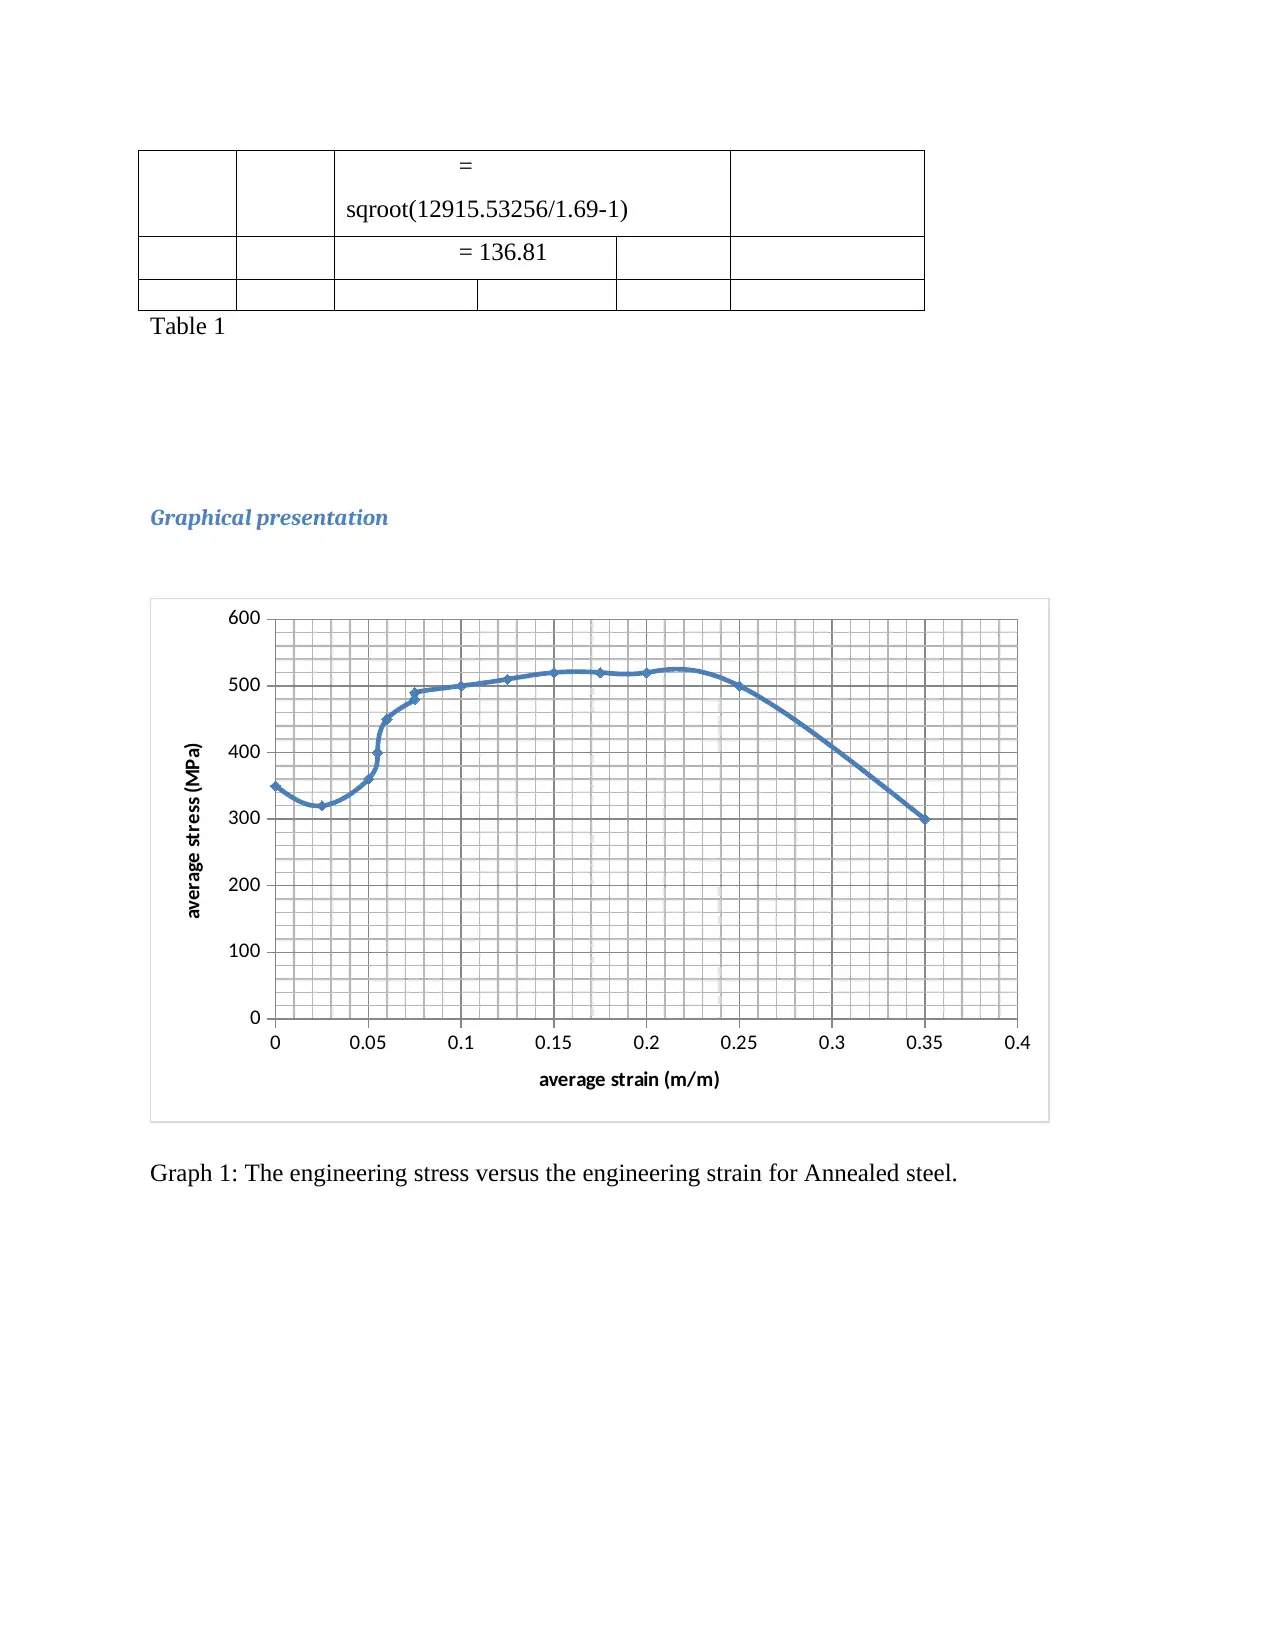
=
sqroot(12915.53256/1.69-1)
= 136.81
Table 1
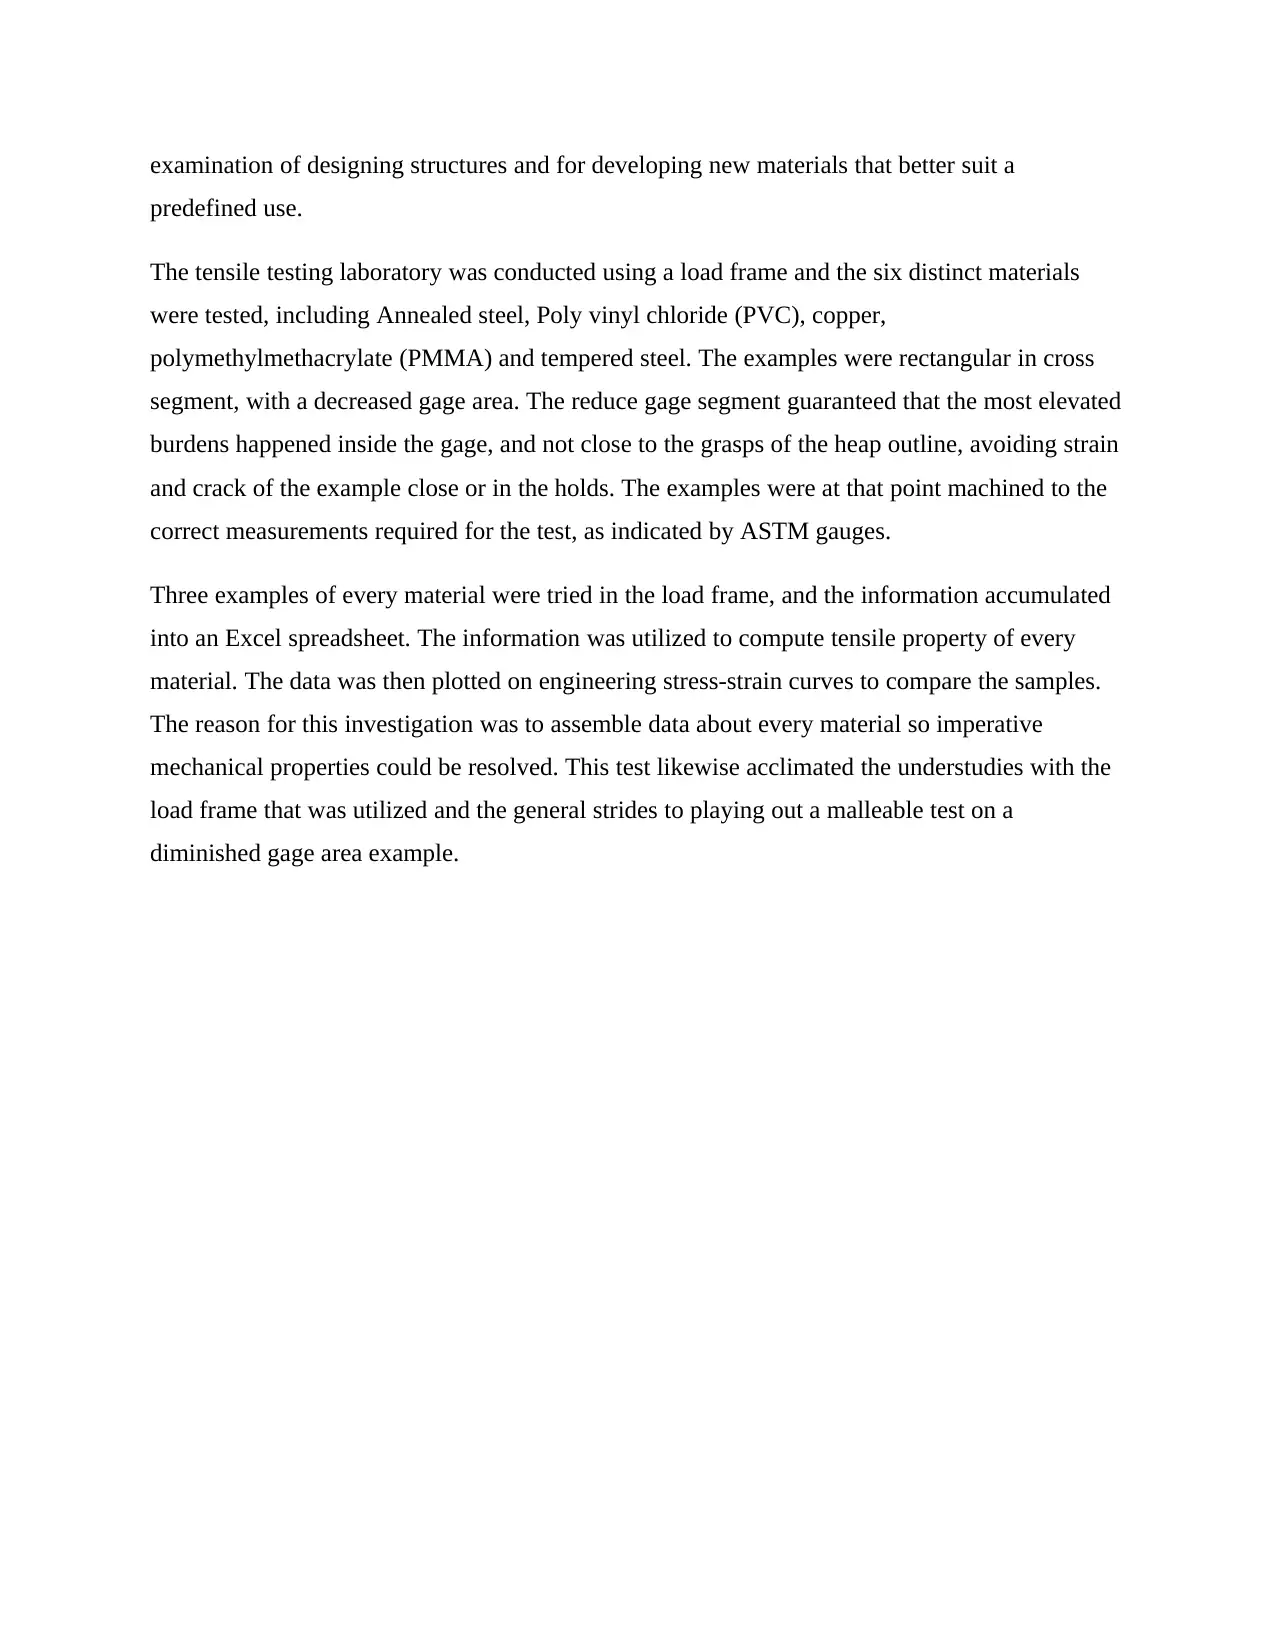
Graphical presentation
0 0.05 0.1 0.15 0.2 0.25 0.3 0.35 0.4
0
100
200
300
400
500
600
average strain (m/m)
average stress (MPa)
Graph 1: The engineering stress versus the engineering strain for Annealed steel.
sqroot(12915.53256/1.69-1)
= 136.81
Table 1
Graphical presentation
0 0.05 0.1 0.15 0.2 0.25 0.3 0.35 0.4
0
100
200
300
400
500
600
average strain (m/m)
average stress (MPa)
Graph 1: The engineering stress versus the engineering strain for Annealed steel.
Paraphrase This Document
Need a fresh take? Get an instant paraphrase of this document with our AI Paraphraser
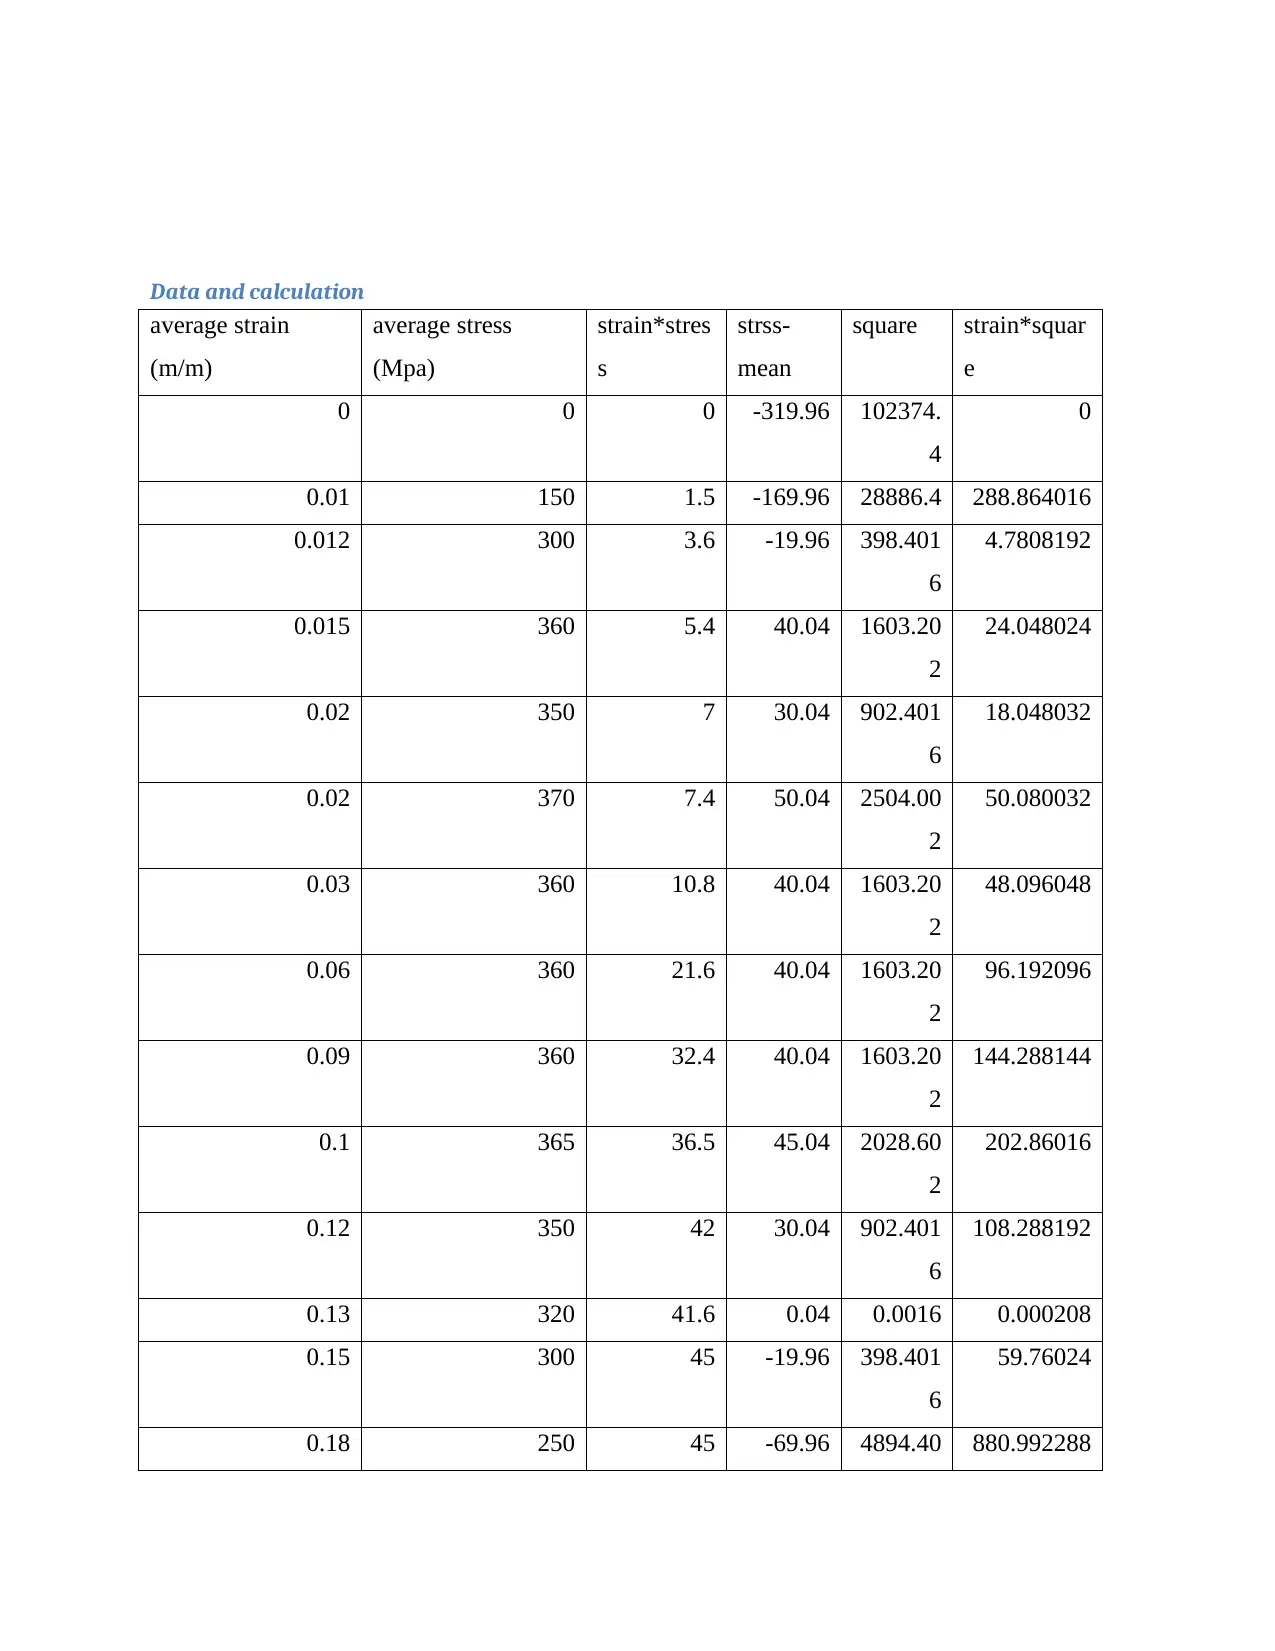
Data and calculation
average strain
(m/m)
average stress
(Mpa)
strain*stres
s
strss-
mean
square strain*squar
e
0 0 0 -319.96 102374.
4
0
0.01 150 1.5 -169.96 28886.4 288.864016
0.012 300 3.6 -19.96 398.401
6
4.7808192
0.015 360 5.4 40.04 1603.20
2
24.048024
0.02 350 7 30.04 902.401
6
18.048032
0.02 370 7.4 50.04 2504.00
2
50.080032
0.03 360 10.8 40.04 1603.20
2
48.096048
0.06 360 21.6 40.04 1603.20
2
96.192096
0.09 360 32.4 40.04 1603.20
2
144.288144
0.1 365 36.5 45.04 2028.60
2
202.86016
0.12 350 42 30.04 902.401
6
108.288192
0.13 320 41.6 0.04 0.0016 0.000208
0.15 300 45 -19.96 398.401
6
59.76024
0.18 250 45 -69.96 4894.40 880.992288
2
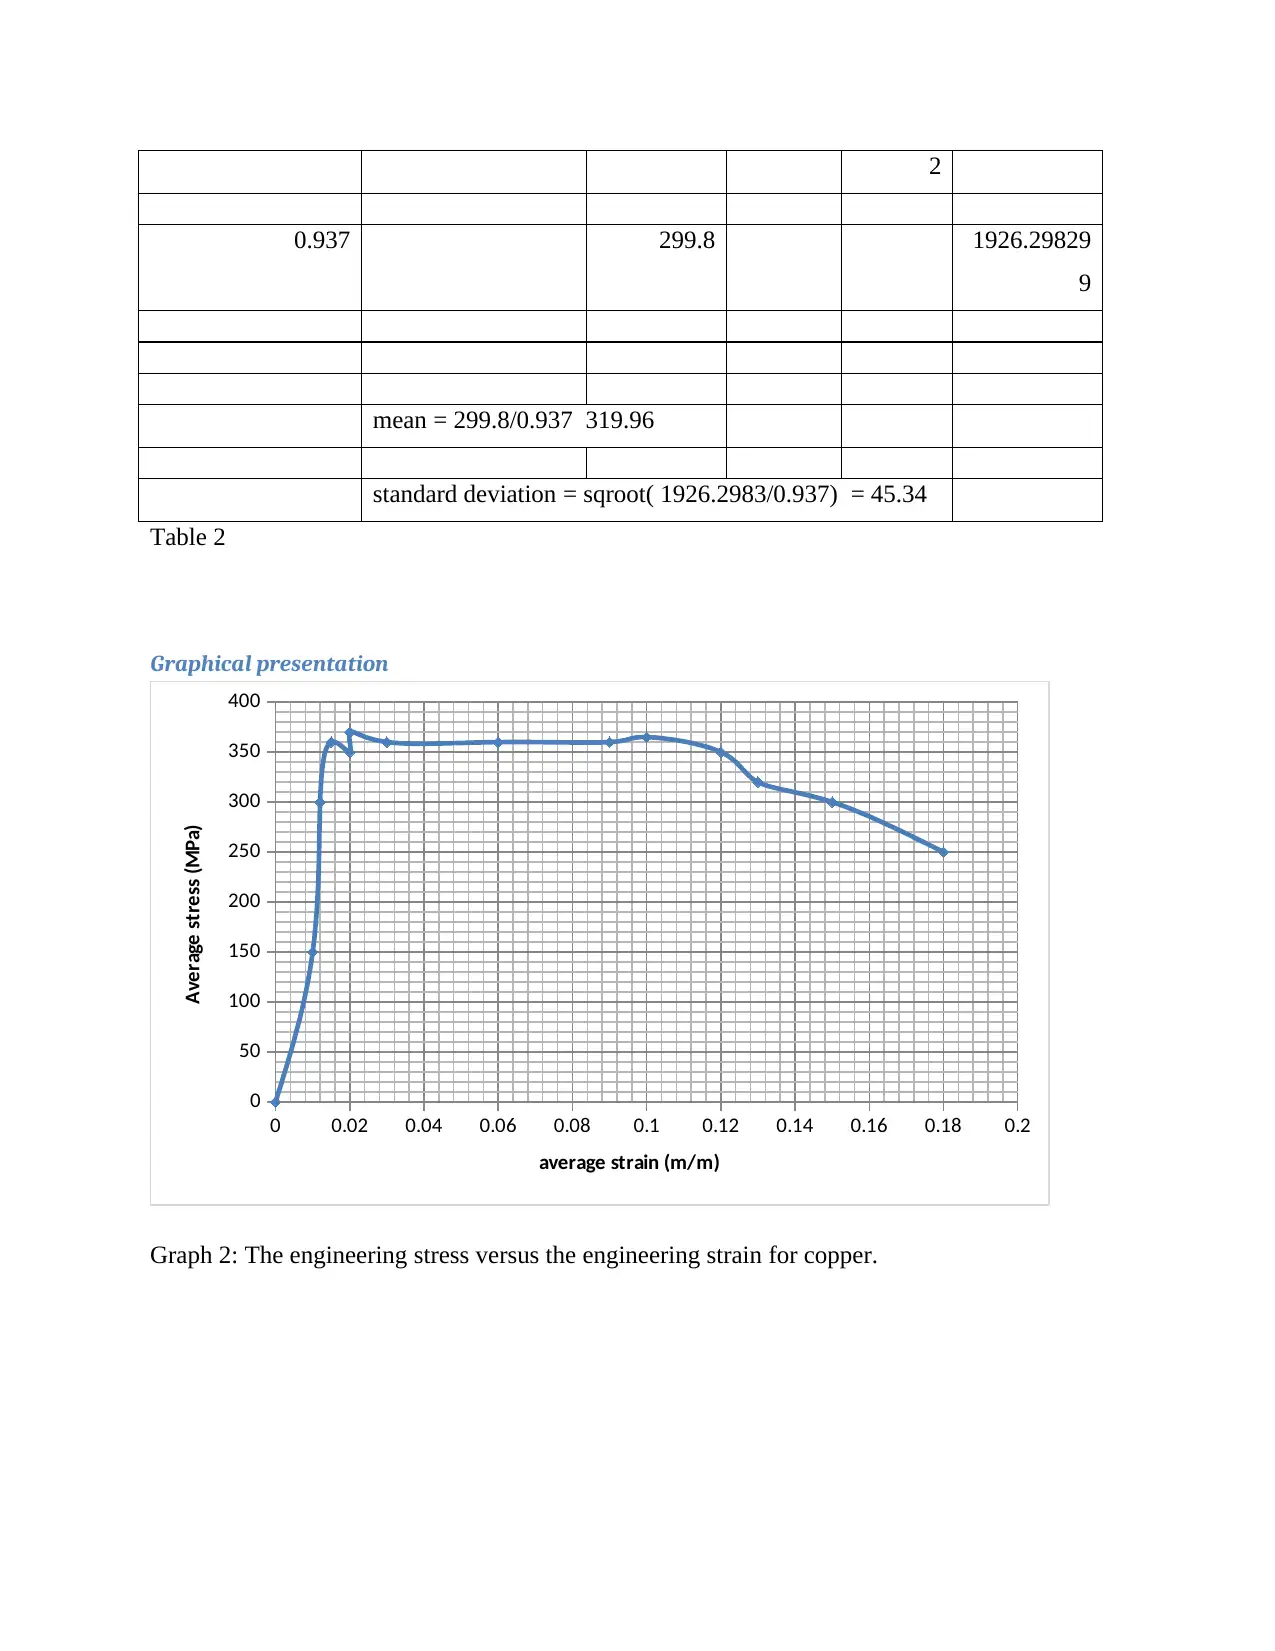
0.937 299.8 1926.29829
9
mean = 299.8/0.937 319.96
standard deviation = sqroot( 1926.2983/0.937) = 45.34
Table 2
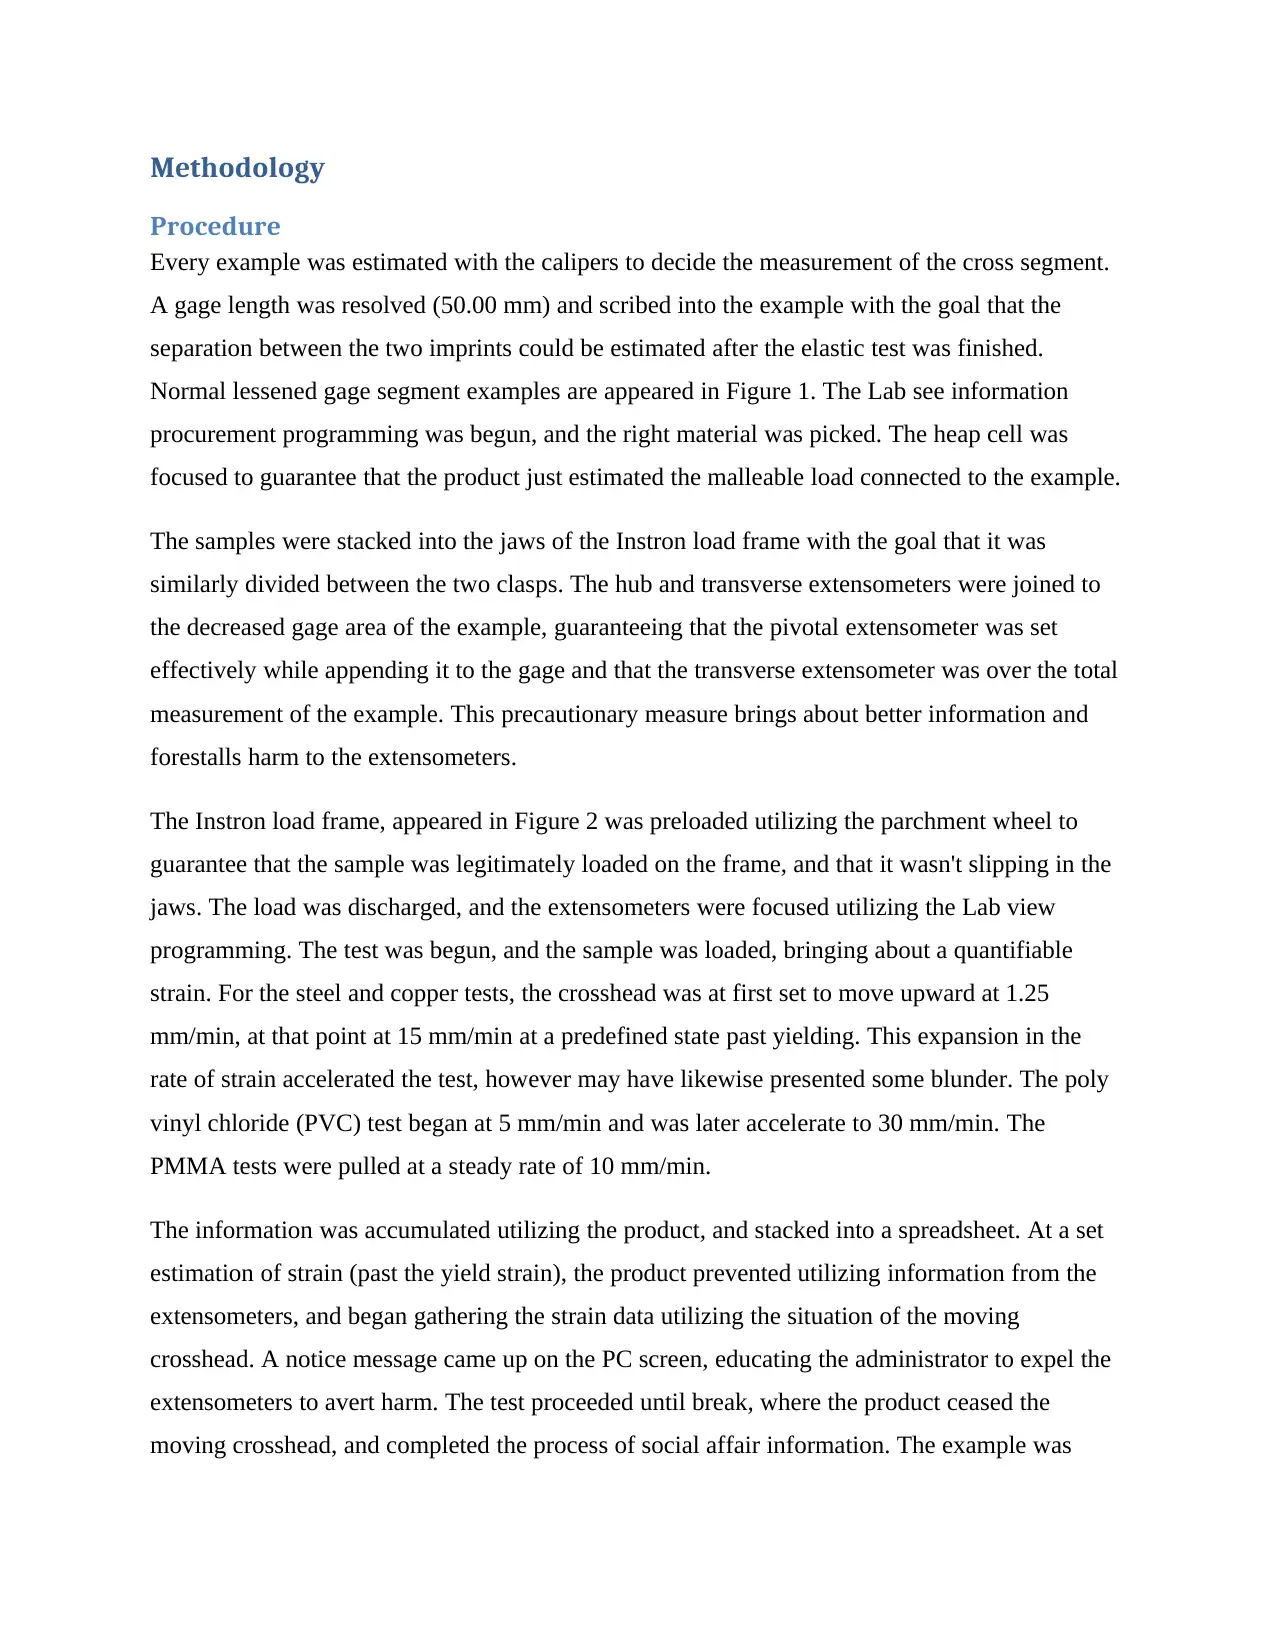
Graphical presentation
0 0.02 0.04 0.06 0.08 0.1 0.12 0.14 0.16 0.18 0.2
0
50
100
150
200
250
300
350
400
average strain (m/m)
Average stress (MPa)
Graph 2: The engineering stress versus the engineering strain for copper.
0.937 299.8 1926.29829
9
mean = 299.8/0.937 319.96
standard deviation = sqroot( 1926.2983/0.937) = 45.34
Table 2
Graphical presentation
0 0.02 0.04 0.06 0.08 0.1 0.12 0.14 0.16 0.18 0.2
0
50
100
150
200
250
300
350
400
average strain (m/m)
Average stress (MPa)
Graph 2: The engineering stress versus the engineering strain for copper.
⊘ This is a preview!⊘
Do you want full access?
Subscribe today to unlock all pages.
Trusted by 1+ million students worldwide
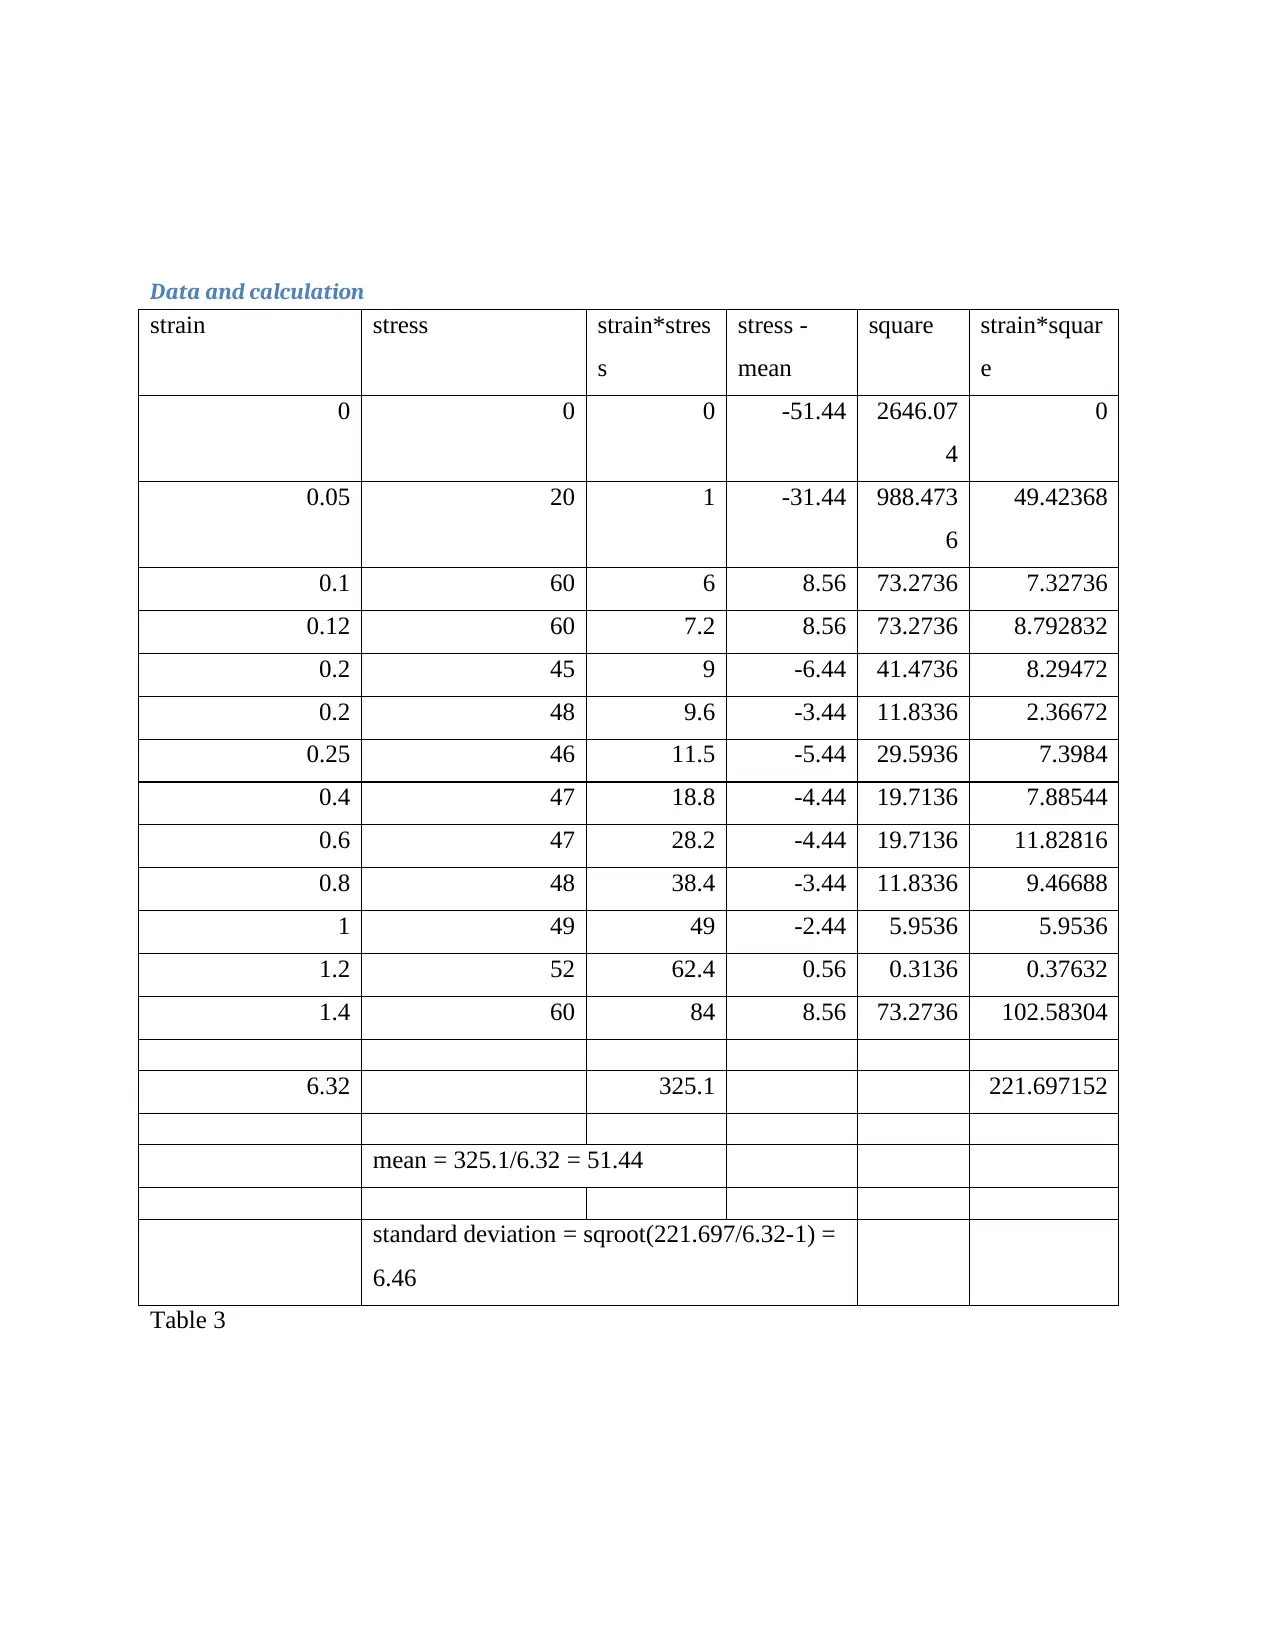
Data and calculation
strain stress strain*stres
s
stress -
mean
square strain*squar
e
0 0 0 -51.44 2646.07
4
0
0.05 20 1 -31.44 988.473
6
49.42368
0.1 60 6 8.56 73.2736 7.32736
0.12 60 7.2 8.56 73.2736 8.792832
0.2 45 9 -6.44 41.4736 8.29472
0.2 48 9.6 -3.44 11.8336 2.36672
0.25 46 11.5 -5.44 29.5936 7.3984
0.4 47 18.8 -4.44 19.7136 7.88544
0.6 47 28.2 -4.44 19.7136 11.82816
0.8 48 38.4 -3.44 11.8336 9.46688
1 49 49 -2.44 5.9536 5.9536
1.2 52 62.4 0.56 0.3136 0.37632
1.4 60 84 8.56 73.2736 102.58304
6.32 325.1 221.697152
mean = 325.1/6.32 = 51.44
standard deviation = sqroot(221.697/6.32-1) =
6.46
Table 3
Paraphrase This Document
Need a fresh take? Get an instant paraphrase of this document with our AI Paraphraser
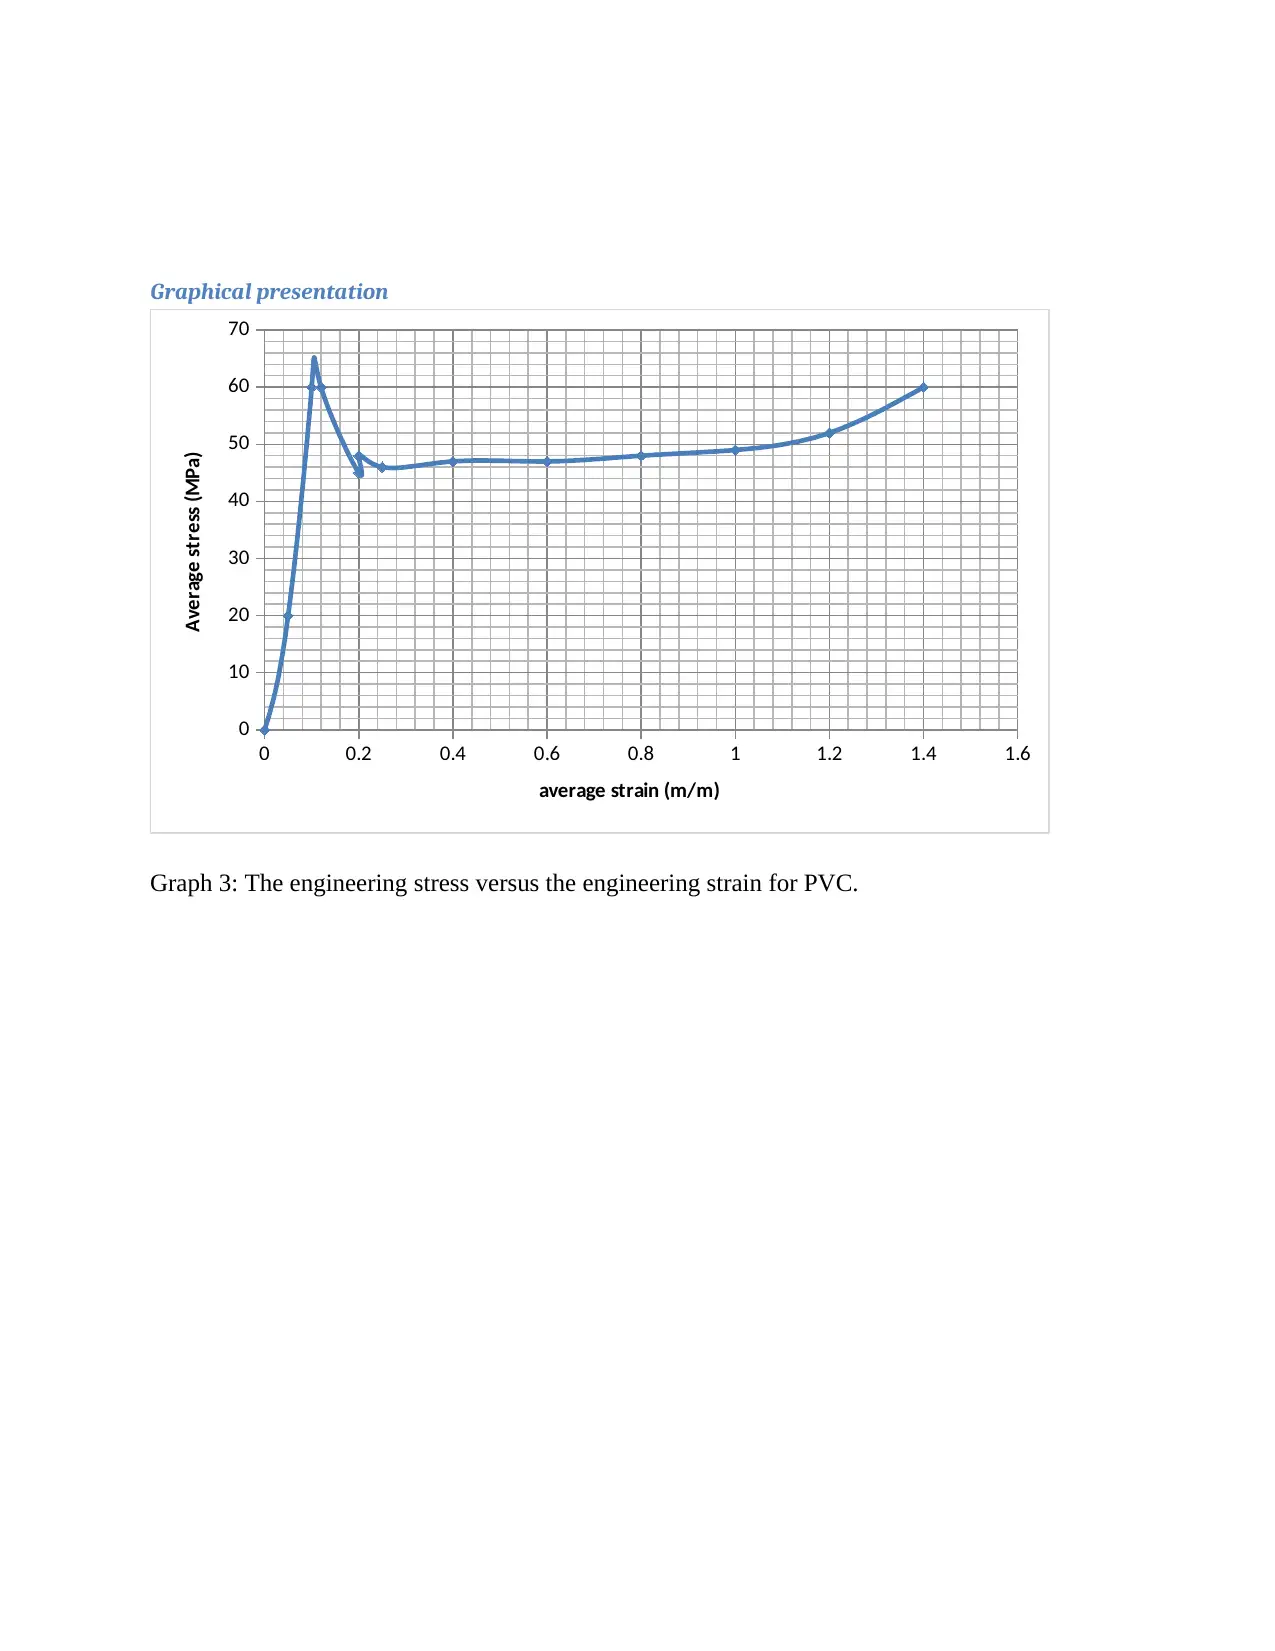
Graphical presentation
0 0.2 0.4 0.6 0.8 1 1.2 1.4 1.6
0
10
20
30
40
50
60
70
average strain (m/m)
Average stress (MPa)
Graph 3: The engineering stress versus the engineering strain for PVC.
0 0.2 0.4 0.6 0.8 1 1.2 1.4 1.6
0
10
20
30
40
50
60
70
average strain (m/m)
Average stress (MPa)
Graph 3: The engineering stress versus the engineering strain for PVC.
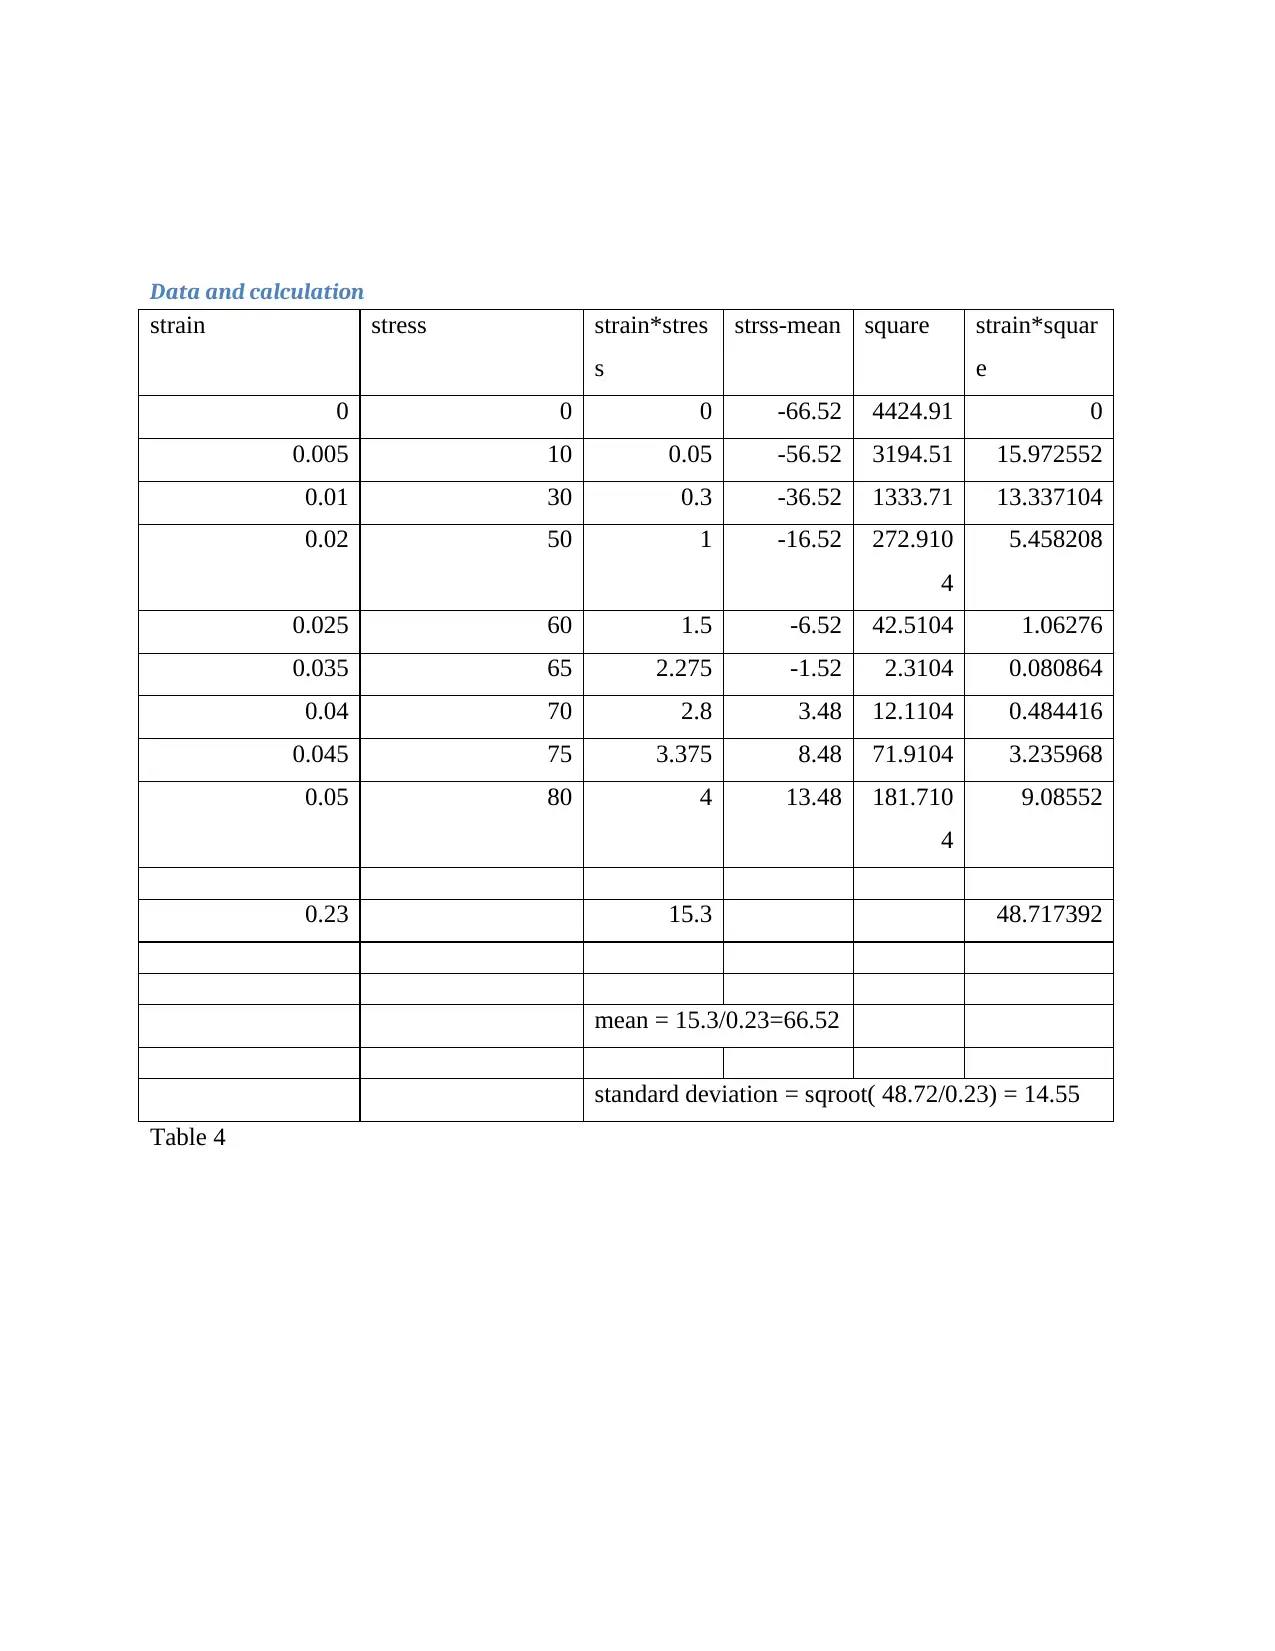
Data and calculation
strain stress strain*stres
s
strss-mean square strain*squar
e
0 0 0 -66.52 4424.91 0
0.005 10 0.05 -56.52 3194.51 15.972552
0.01 30 0.3 -36.52 1333.71 13.337104
0.02 50 1 -16.52 272.910
4
5.458208
0.025 60 1.5 -6.52 42.5104 1.06276
0.035 65 2.275 -1.52 2.3104 0.080864
0.04 70 2.8 3.48 12.1104 0.484416
0.045 75 3.375 8.48 71.9104 3.235968
0.05 80 4 13.48 181.710
4
9.08552
0.23 15.3 48.717392
mean = 15.3/0.23=66.52
standard deviation = sqroot( 48.72/0.23) = 14.55
Table 4
⊘ This is a preview!⊘
Do you want full access?
Subscribe today to unlock all pages.
Trusted by 1+ million students worldwide
1 out of 23


Your All-in-One AI-Powered Toolkit for Academic Success.
+13062052269
info@desklib.com
Available 24*7 on WhatsApp / Email
![[object Object]](/_next/static/media/star-bottom.7253800d.svg)
Unlock your academic potential
Copyright © 2020–2026 A2Z Services. All Rights Reserved. Developed and managed by ZUCOL.