Gearbox Efficiency Analysis Lab Report - Mechanical Engineering

Verified

Added on  2023/06/03

|14
|1638
|110
Report
AI Summary
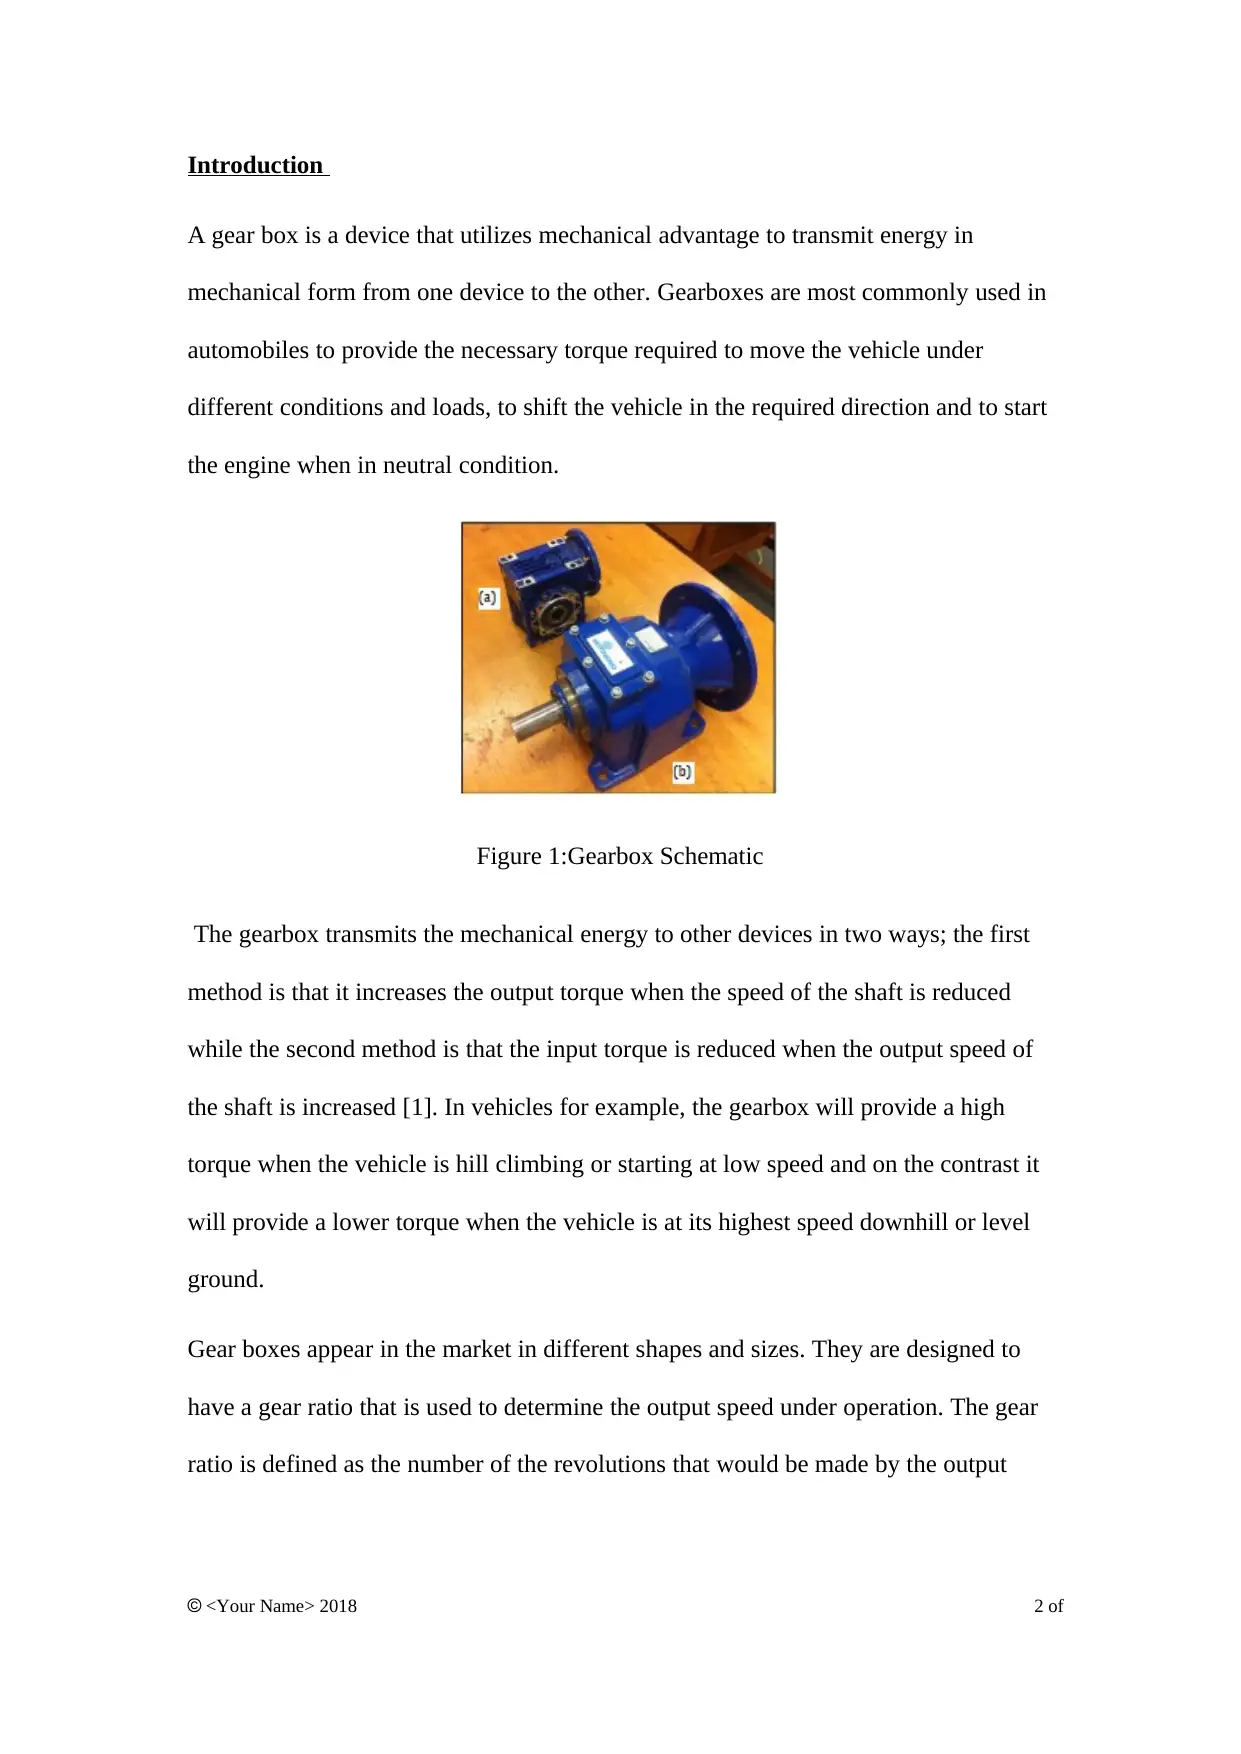
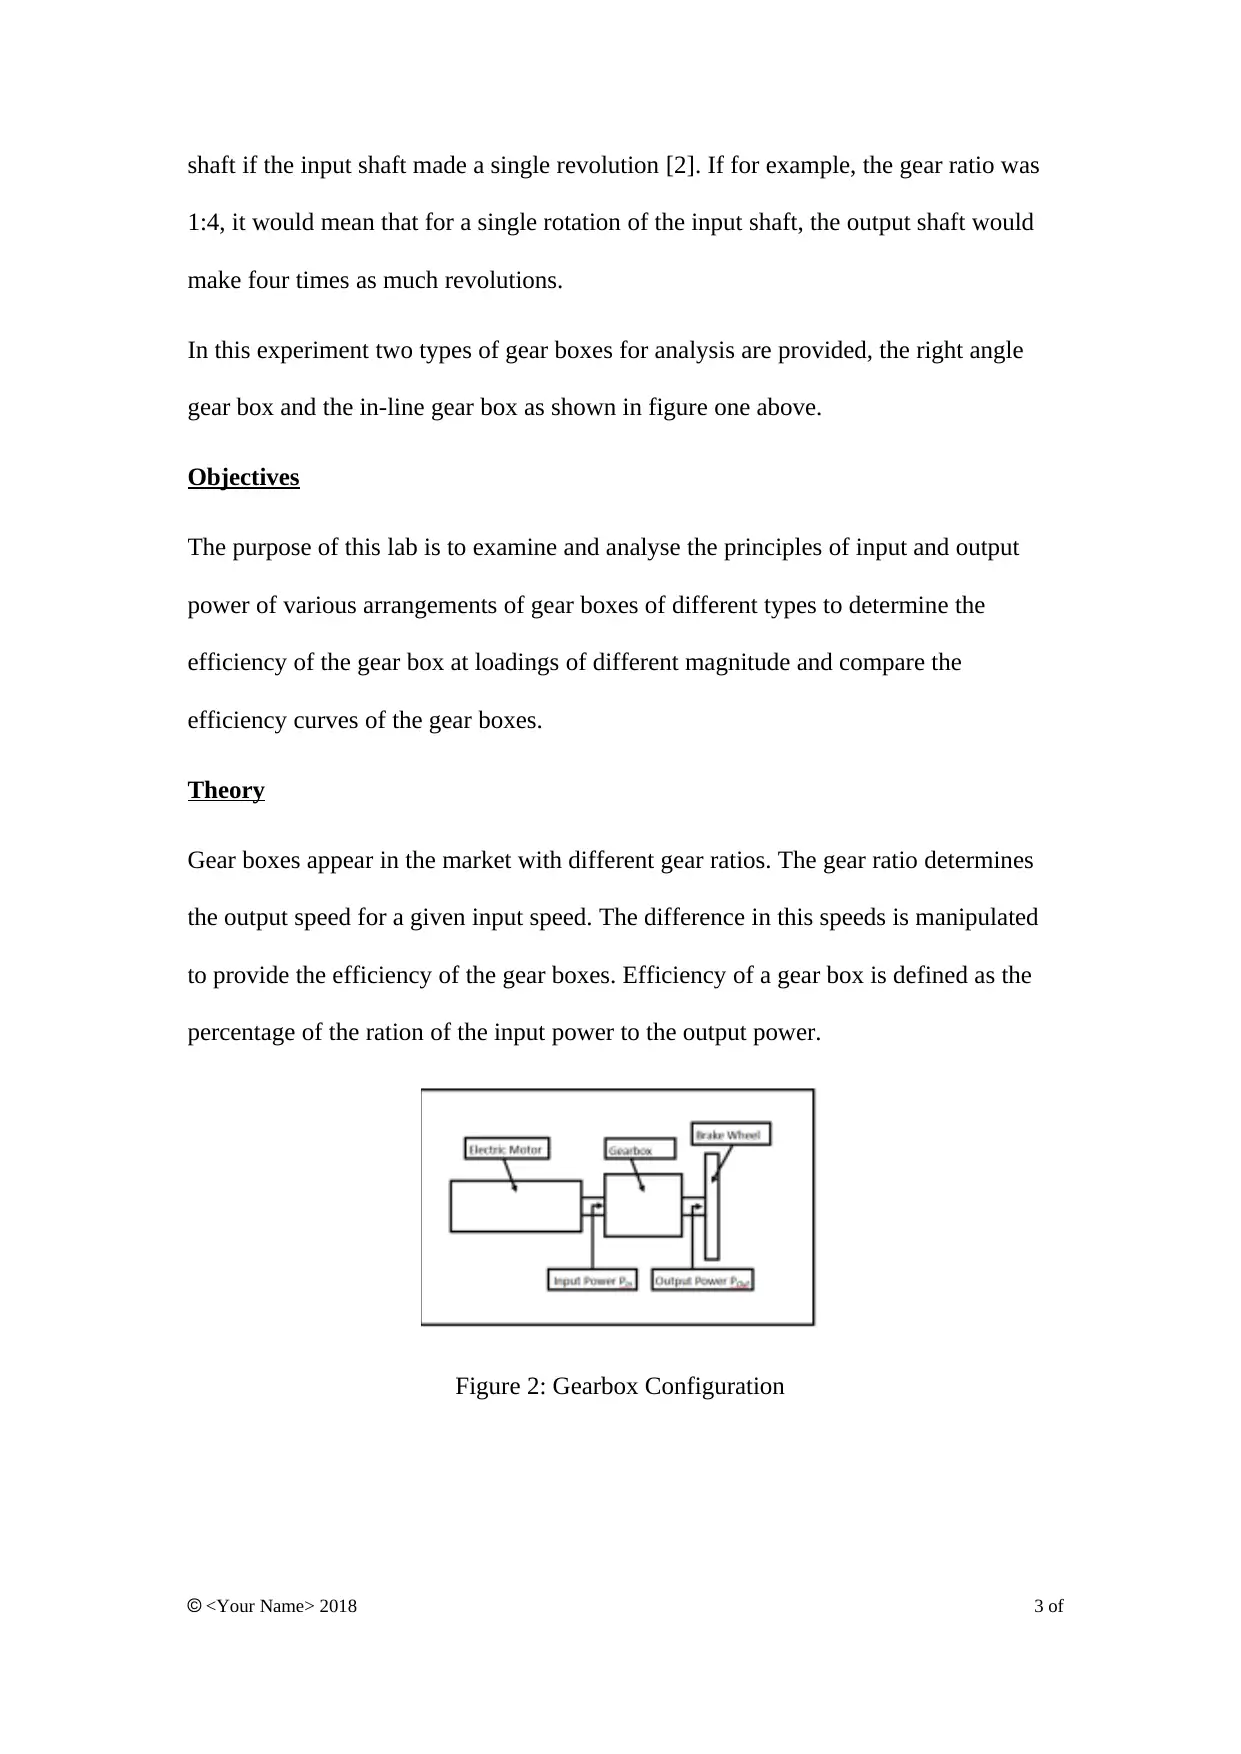
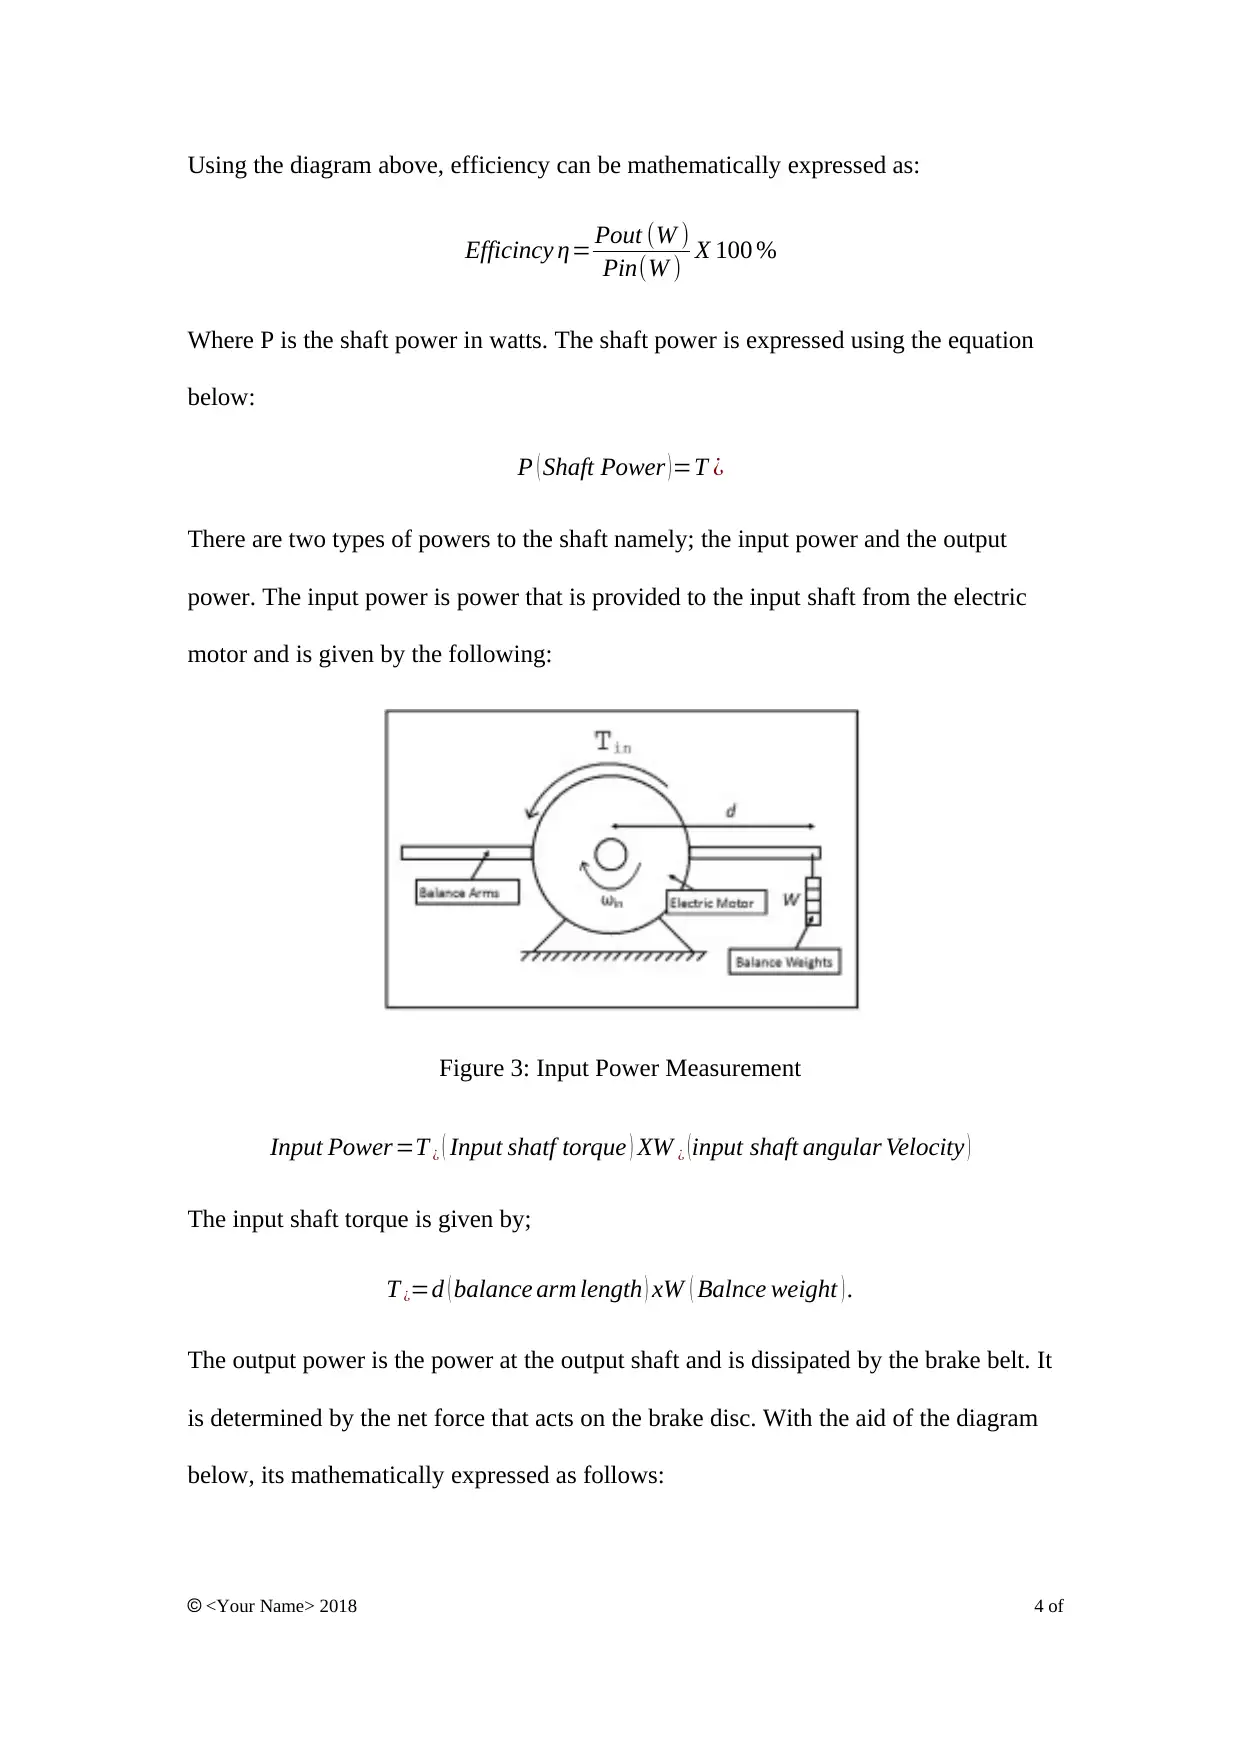
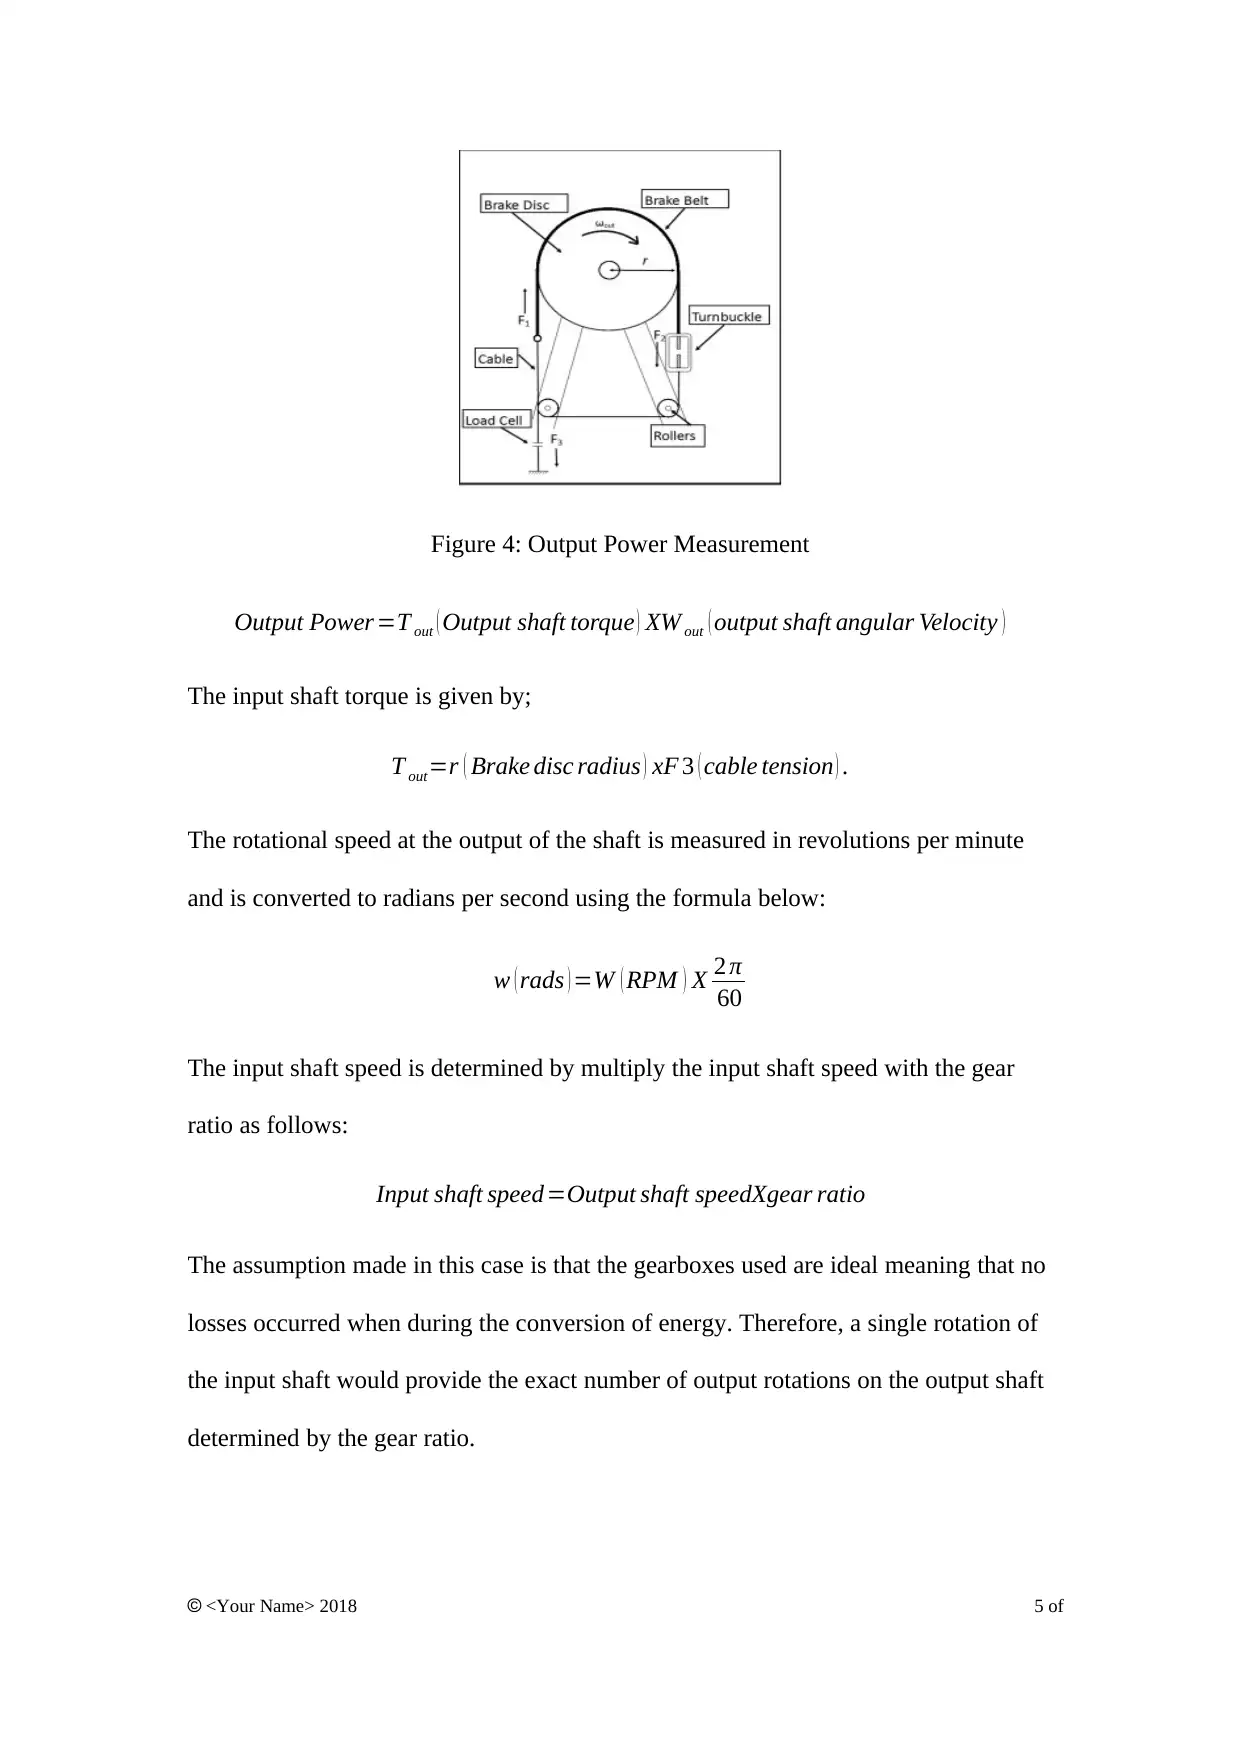
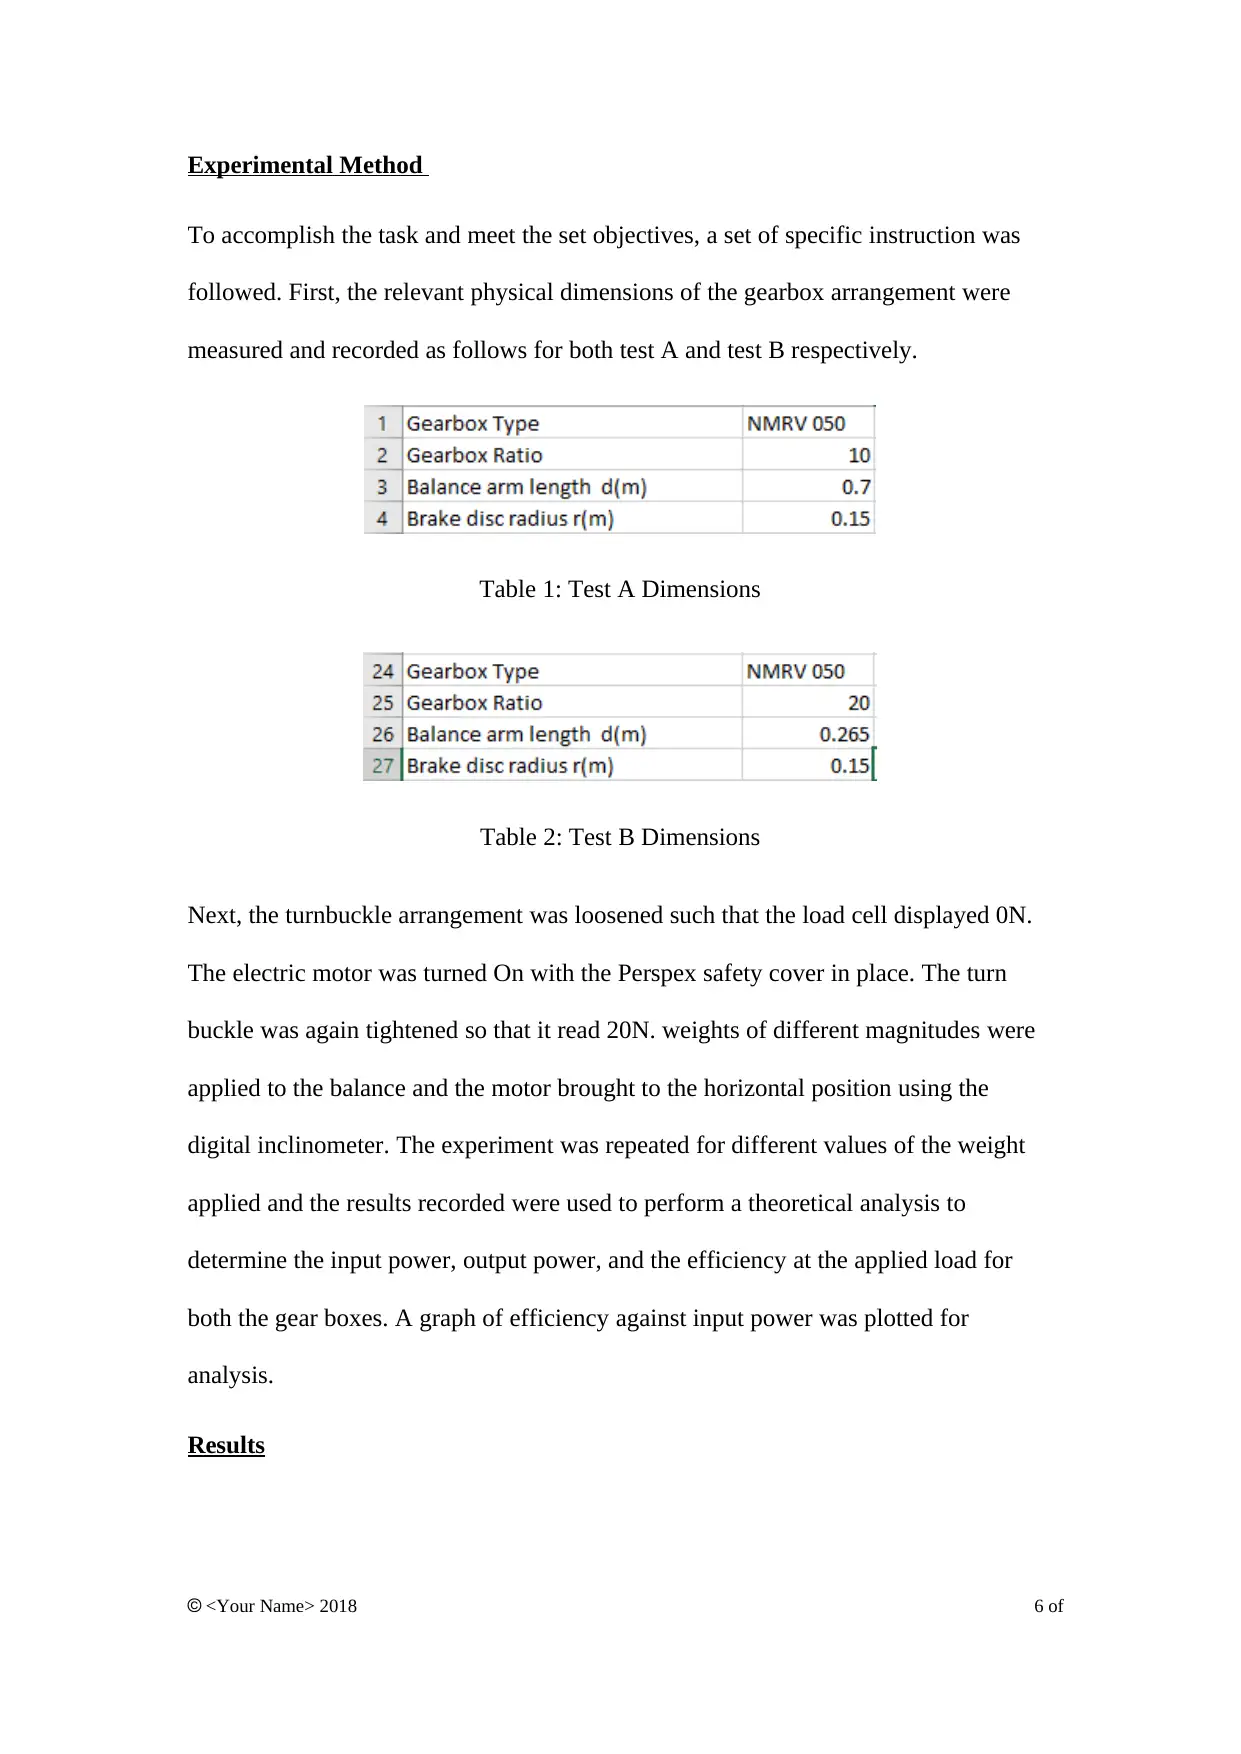
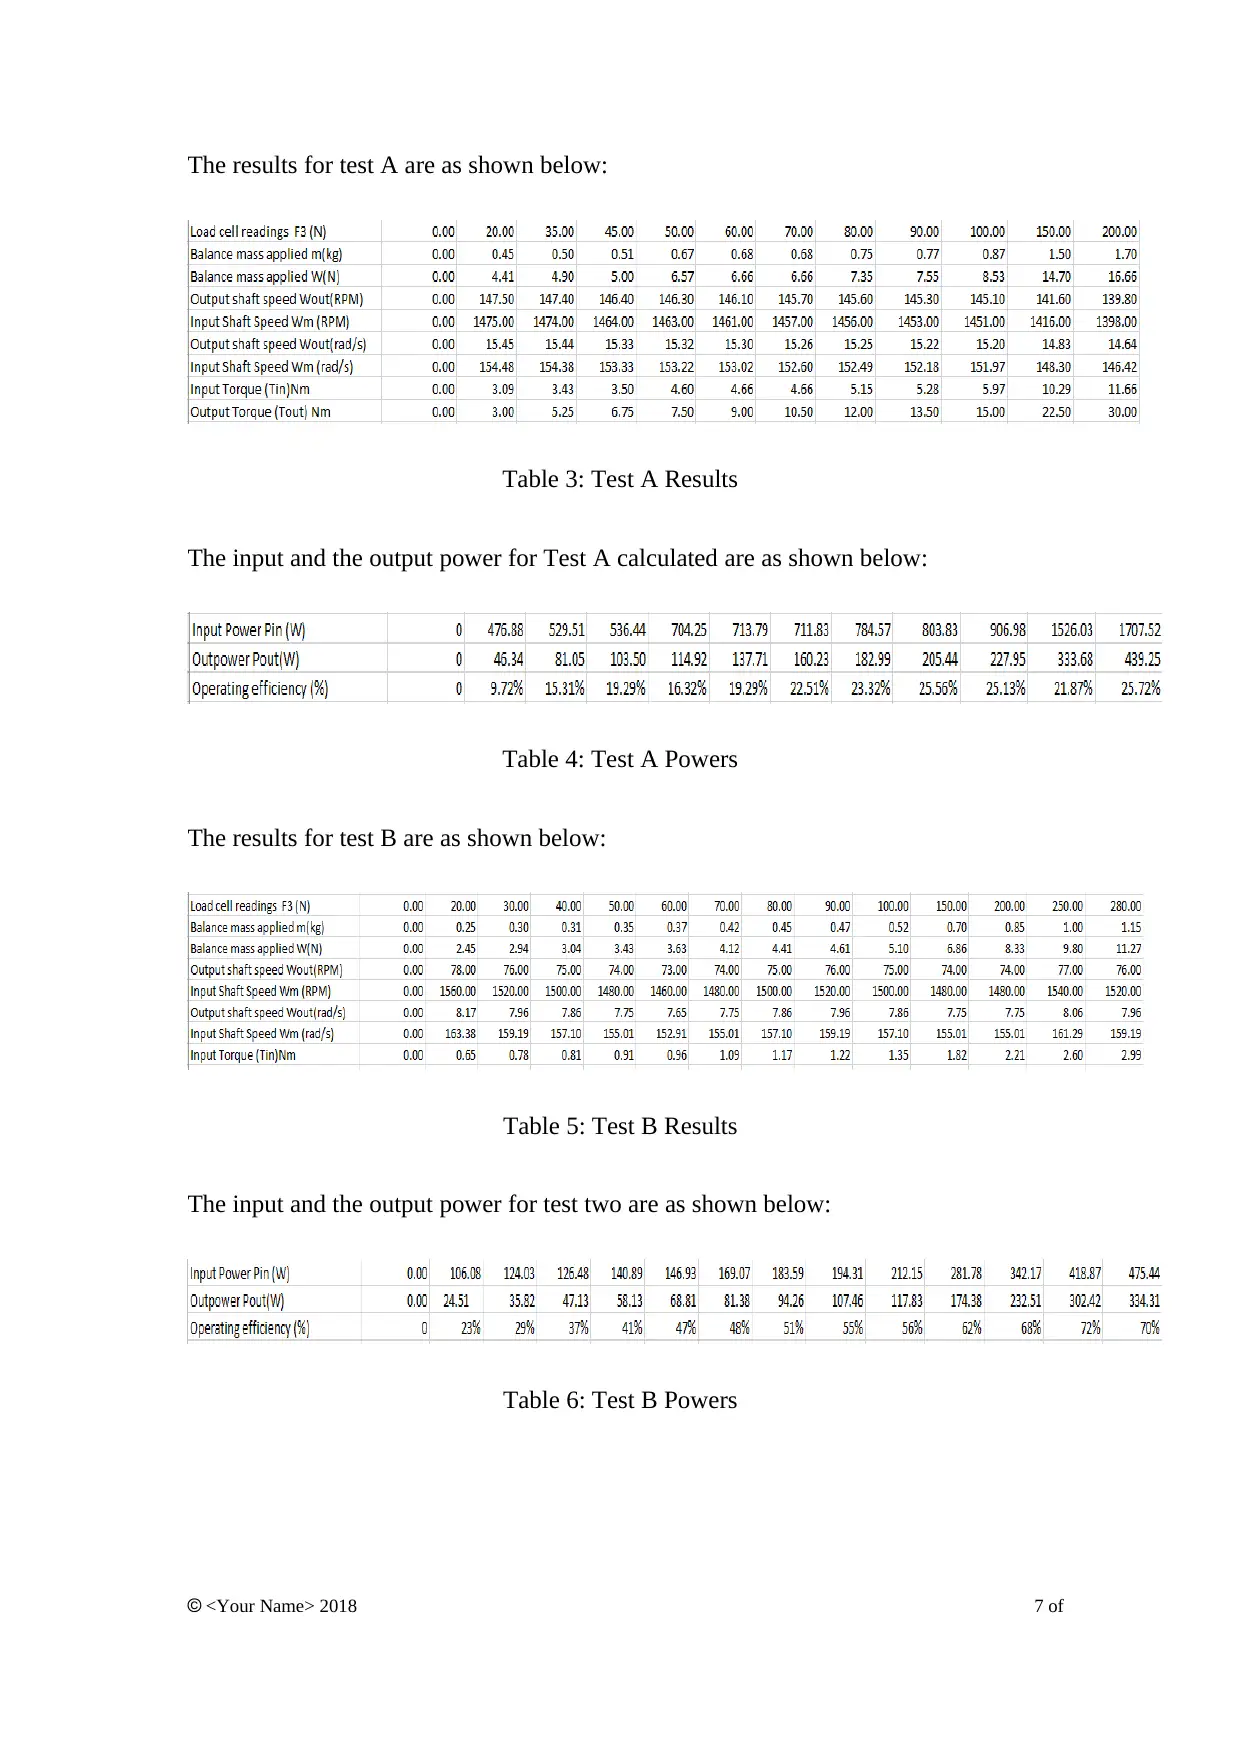
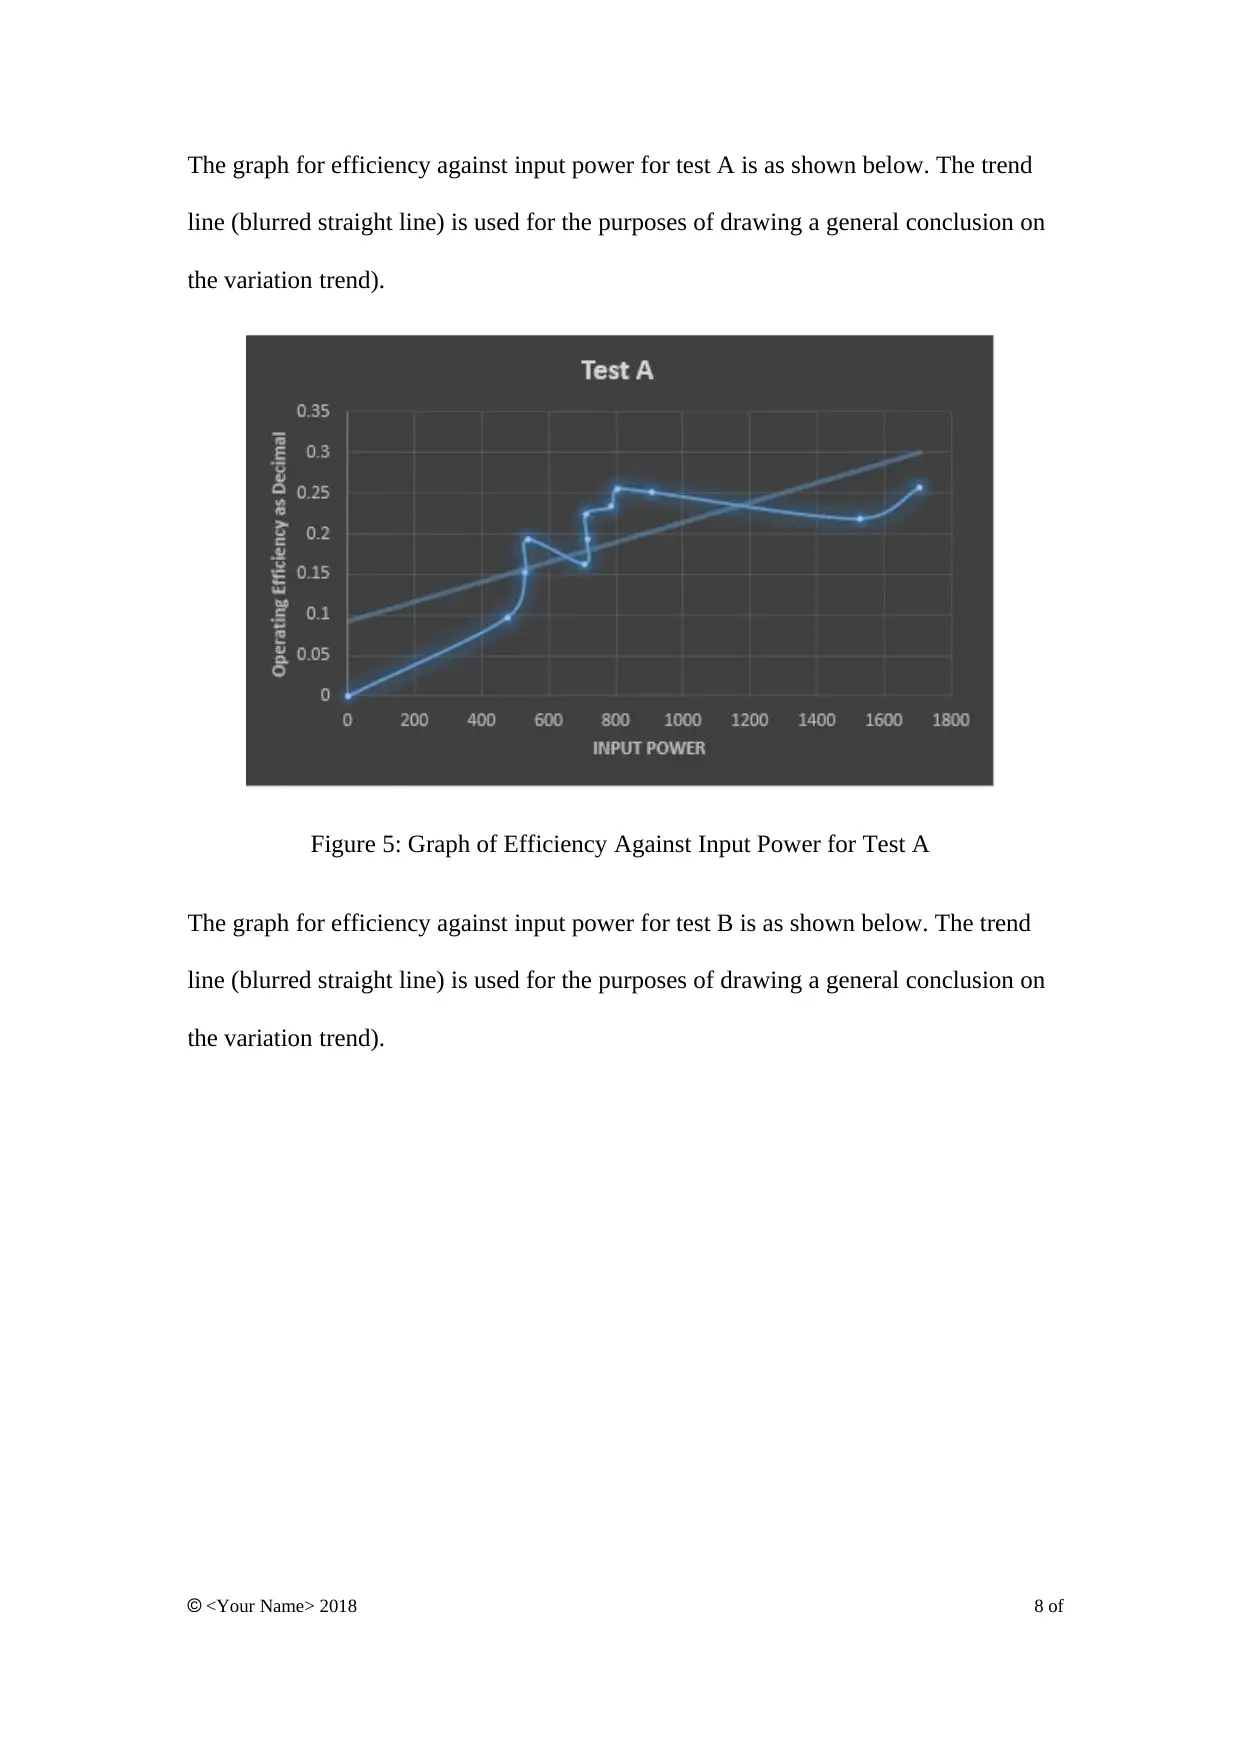
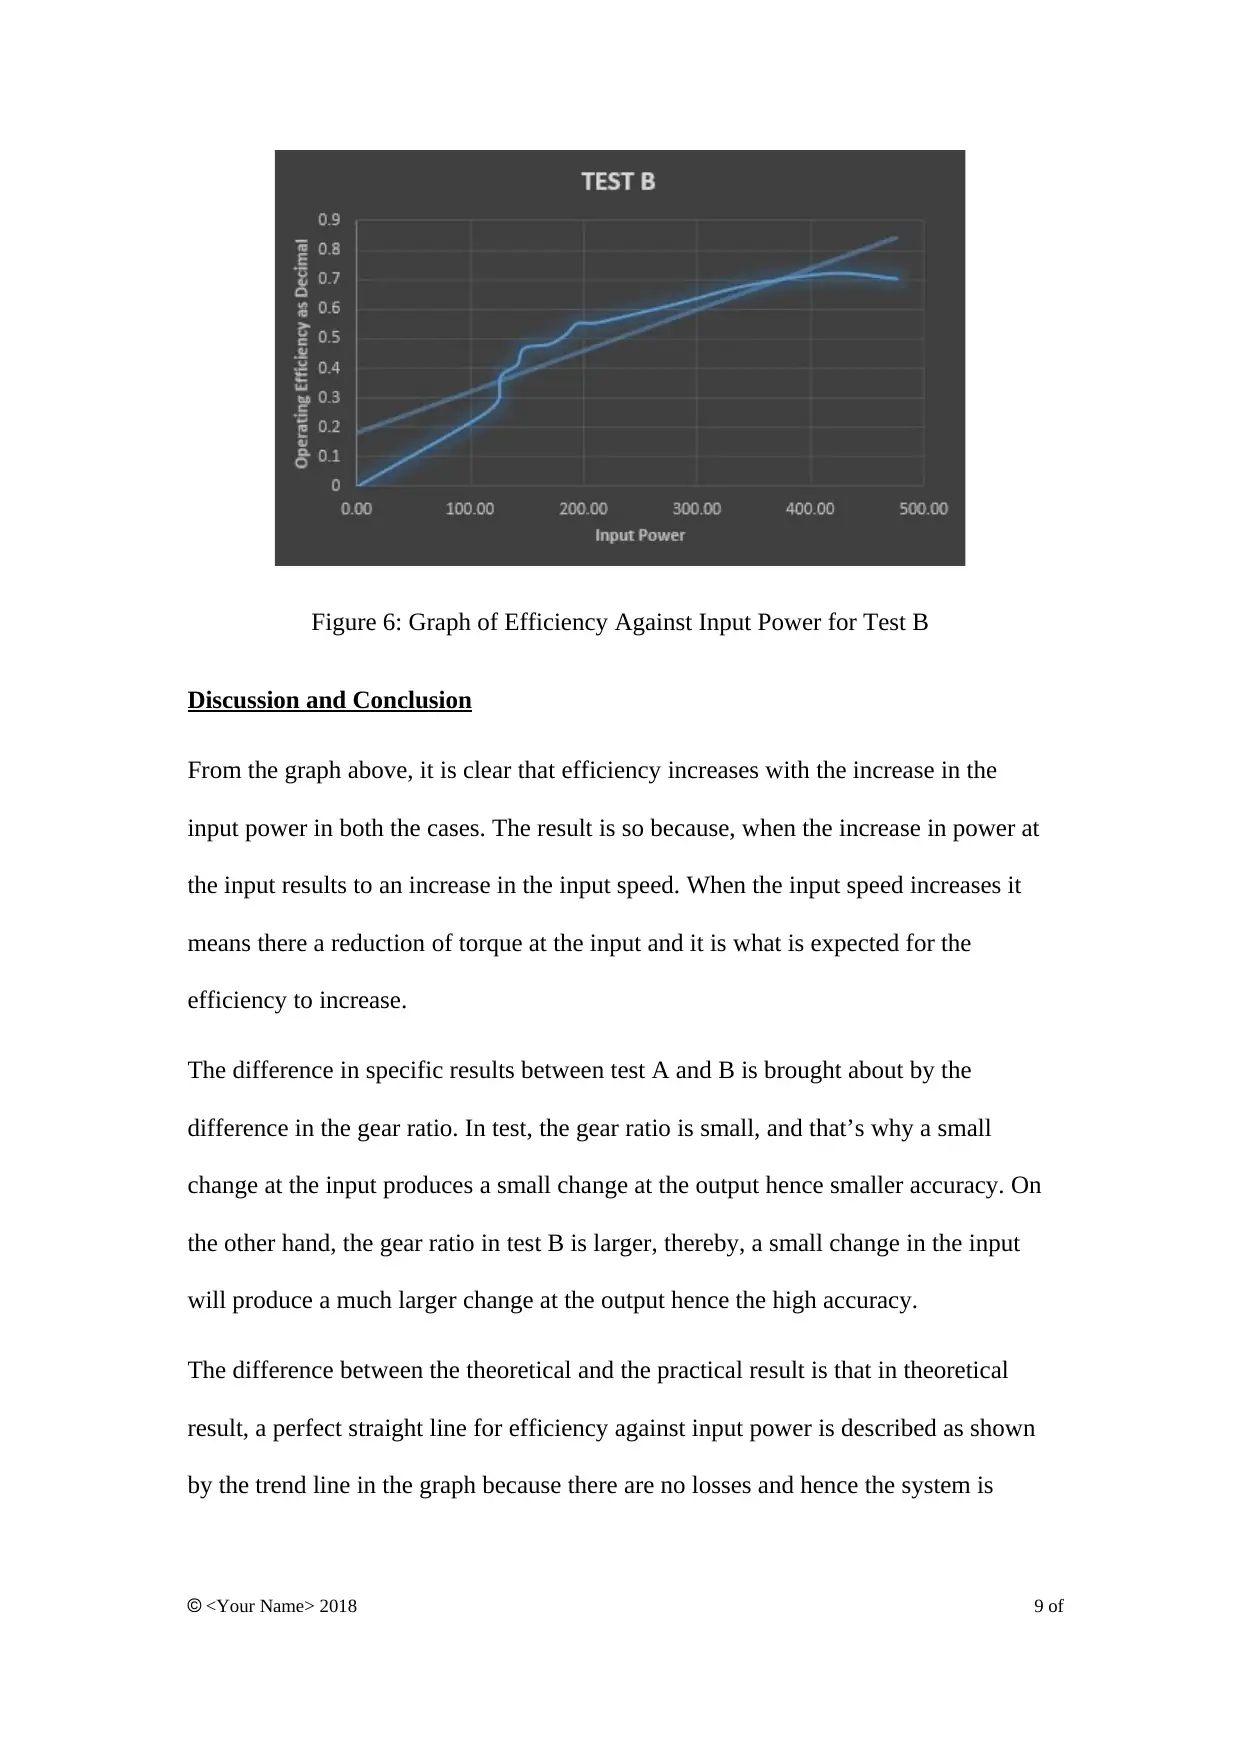
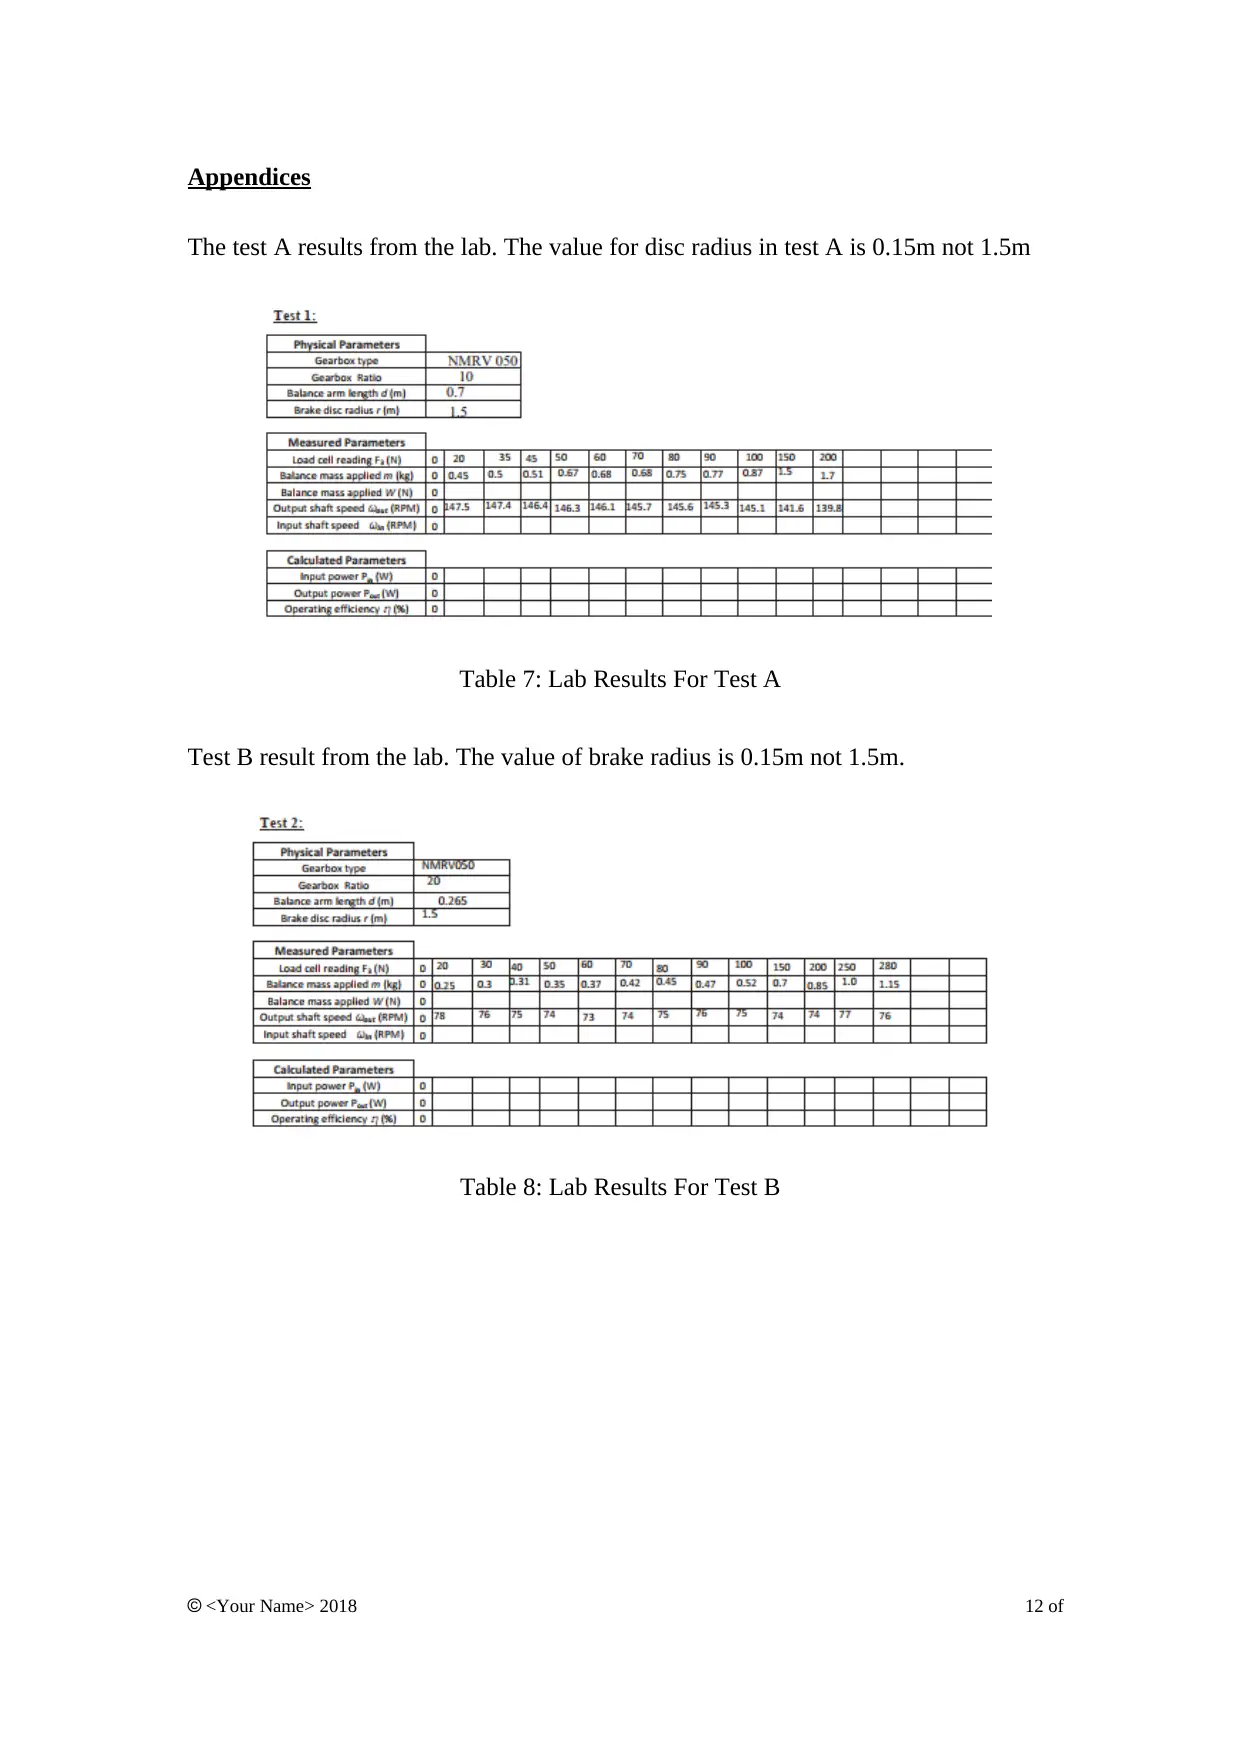
This lab report details an experiment analyzing the principles of input and output power in various gearbox configurations to determine their efficiency at different loads. The report includes an introduction explaining the function of gearboxes and their real-world applications, such as in automobiles. The objectives are clearly stated, followed by a theoretical background explaining efficiency calculations, including formulas for input and output power, torque, and angular velocity. The experimental method section describes the procedure, including measurements of physical dimensions and the application of varying loads. The results section presents data in tables and graphs, comparing the efficiency of different gearboxes. The discussion and conclusion analyze the findings, relating efficiency to input power and gear ratios, and comparing theoretical and practical results. The report also includes references, appendices with raw data, and lab handouts.
Document Page
University
Lab Report
by
Your Name
Your ID
Lecturer
Date
<Your Name> 2018 1 of
tabler-icon-diamond-filled.svg

Paraphrase This Document

Need a fresh take? Get an instant paraphrase of this document with our AI Paraphraser
Document Page
Introduction
A gear box is a device that utilizes mechanical advantage to transmit energy in
mechanical form from one device to the other. Gearboxes are most commonly used in
automobiles to provide the necessary torque required to move the vehicle under
different conditions and loads, to shift the vehicle in the required direction and to start
the engine when in neutral condition.
Figure 1:Gearbox Schematic
The gearbox transmits the mechanical energy to other devices in two ways; the first
method is that it increases the output torque when the speed of the shaft is reduced
while the second method is that the input torque is reduced when the output speed of
the shaft is increased [1]. In vehicles for example, the gearbox will provide a high
torque when the vehicle is hill climbing or starting at low speed and on the contrast it
will provide a lower torque when the vehicle is at its highest speed downhill or level
ground.
Gear boxes appear in the market in different shapes and sizes. They are designed to
have a gear ratio that is used to determine the output speed under operation. The gear
ratio is defined as the number of the revolutions that would be made by the output
<Your Name> 2018 2 of
Document Page
shaft if the input shaft made a single revolution [2]. If for example, the gear ratio was
1:4, it would mean that for a single rotation of the input shaft, the output shaft would
make four times as much revolutions.
In this experiment two types of gear boxes for analysis are provided, the right angle
gear box and the in-line gear box as shown in figure one above.
Objectives
The purpose of this lab is to examine and analyse the principles of input and output
power of various arrangements of gear boxes of different types to determine the
efficiency of the gear box at loadings of different magnitude and compare the
efficiency curves of the gear boxes.
Theory
Gear boxes appear in the market with different gear ratios. The gear ratio determines
the output speed for a given input speed. The difference in this speeds is manipulated
to provide the efficiency of the gear boxes. Efficiency of a gear box is defined as the
percentage of the ration of the input power to the output power.
Figure 2: Gearbox Configuration
<Your Name> 2018 3 of
Document Page
Using the diagram above, efficiency can be mathematically expressed as:
Efficincy η= Pout (W )
Pin(W ) X 100 %
Where P is the shaft power in watts. The shaft power is expressed using the equation
below:
P ( Shaft Power ) =T ¿
There are two types of powers to the shaft namely; the input power and the output
power. The input power is power that is provided to the input shaft from the electric
motor and is given by the following:
Figure 3: Input Power Measurement
Input Power=T ¿ ( Input shatf torque ) XW ¿ (input shaft angular Velocity )
The input shaft torque is given by;
T ¿=d ( balance arm length ) xW ( Balnce weight ) .
The output power is the power at the output shaft and is dissipated by the brake belt. It
is determined by the net force that acts on the brake disc. With the aid of the diagram
below, its mathematically expressed as follows:
<Your Name> 2018 4 of
tabler-icon-diamond-filled.svg

Paraphrase This Document

Need a fresh take? Get an instant paraphrase of this document with our AI Paraphraser
Document Page
Figure 4: Output Power Measurement
Output Power=T out ( Output shaft torque ) XW out ( output shaft angular Velocity )
The input shaft torque is given by;
T out=r ( Brake disc radius ) xF 3 ( cable tension ) .
The rotational speed at the output of the shaft is measured in revolutions per minute
and is converted to radians per second using the formula below:
w ( rads ) =W ( RPM ) X 2 π
60
The input shaft speed is determined by multiply the input shaft speed with the gear
ratio as follows:
Input shaft speed =Output shaft speedXgear ratio
The assumption made in this case is that the gearboxes used are ideal meaning that no
losses occurred when during the conversion of energy. Therefore, a single rotation of
the input shaft would provide the exact number of output rotations on the output shaft
determined by the gear ratio.
<Your Name> 2018 5 of
Document Page
Experimental Method
To accomplish the task and meet the set objectives, a set of specific instruction was
followed. First, the relevant physical dimensions of the gearbox arrangement were
measured and recorded as follows for both test A and test B respectively.
Table 1: Test A Dimensions
Table 2: Test B Dimensions
Next, the turnbuckle arrangement was loosened such that the load cell displayed 0N.
The electric motor was turned On with the Perspex safety cover in place. The turn
buckle was again tightened so that it read 20N. weights of different magnitudes were
applied to the balance and the motor brought to the horizontal position using the
digital inclinometer. The experiment was repeated for different values of the weight
applied and the results recorded were used to perform a theoretical analysis to
determine the input power, output power, and the efficiency at the applied load for
both the gear boxes. A graph of efficiency against input power was plotted for
analysis.
Results
<Your Name> 2018 6 of
Document Page
The results for test A are as shown below:
Table 3: Test A Results
The input and the output power for Test A calculated are as shown below:
Table 4: Test A Powers
The results for test B are as shown below:
Table 5: Test B Results
The input and the output power for test two are as shown below:
Table 6: Test B Powers
<Your Name> 2018 7 of
tabler-icon-diamond-filled.svg

Paraphrase This Document

Need a fresh take? Get an instant paraphrase of this document with our AI Paraphraser
Document Page
The graph for efficiency against input power for test A is as shown below. The trend
line (blurred straight line) is used for the purposes of drawing a general conclusion on
the variation trend).
Figure 5: Graph of Efficiency Against Input Power for Test A
The graph for efficiency against input power for test B is as shown below. The trend
line (blurred straight line) is used for the purposes of drawing a general conclusion on
the variation trend).
<Your Name> 2018 8 of
Document Page
Figure 6: Graph of Efficiency Against Input Power for Test B
Discussion and Conclusion
From the graph above, it is clear that efficiency increases with the increase in the
input power in both the cases. The result is so because, when the increase in power at
the input results to an increase in the input speed. When the input speed increases it
means there a reduction of torque at the input and it is what is expected for the
efficiency to increase.
The difference in specific results between test A and B is brought about by the
difference in the gear ratio. In test, the gear ratio is small, and that’s why a small
change at the input produces a small change at the output hence smaller accuracy. On
the other hand, the gear ratio in test B is larger, thereby, a small change in the input
will produce a much larger change at the output hence the high accuracy.
The difference between the theoretical and the practical result is that in theoretical
result, a perfect straight line for efficiency against input power is described as shown
by the trend line in the graph because there are no losses and hence the system is
<Your Name> 2018 9 of
Document Page
assumed to be perfect. On the other hand, losses in the practical system, both
electrical and mechanical losses occur in the system hence a perfect curve cannot be
achieved. However, the expected objectives have been met, efficiency of the system
is expected to increase with increase in input due to increase in speed and a reduction
in torque as observed and also the efficiency increase with increase in gear ratio.
<Your Name> 2018 10 of
tabler-icon-diamond-filled.svg

Paraphrase This Document

Need a fresh take? Get an instant paraphrase of this document with our AI Paraphraser
Document Page
References
[1] A. Stokes, "Manual Gearbox Design", New York: Knovel, 2002.
[2] L. Kapelevich and M. T. McNamara, "Direct Gear Design for Optimal Gear
Performance", Dearborn: Society of Manufacturing Engineers, 2000.
<Your Name> 2018 11 of
Document Page
Appendices
The test A results from the lab. The value for disc radius in test A is 0.15m not 1.5m
Table 7: Lab Results For Test A
Test B result from the lab. The value of brake radius is 0.15m not 1.5m.
Table 8: Lab Results For Test B
<Your Name> 2018 12 of
chevron_up_icon
1 out of 14
circle_padding
hide_on_mobile
zoom_out_icon
[object Object]