Strain Gauge Experiment and Analysis Report: Mechanical Engineering

Verified

Added on  2023/05/28

|19
|2337
|490
Report
AI Summary
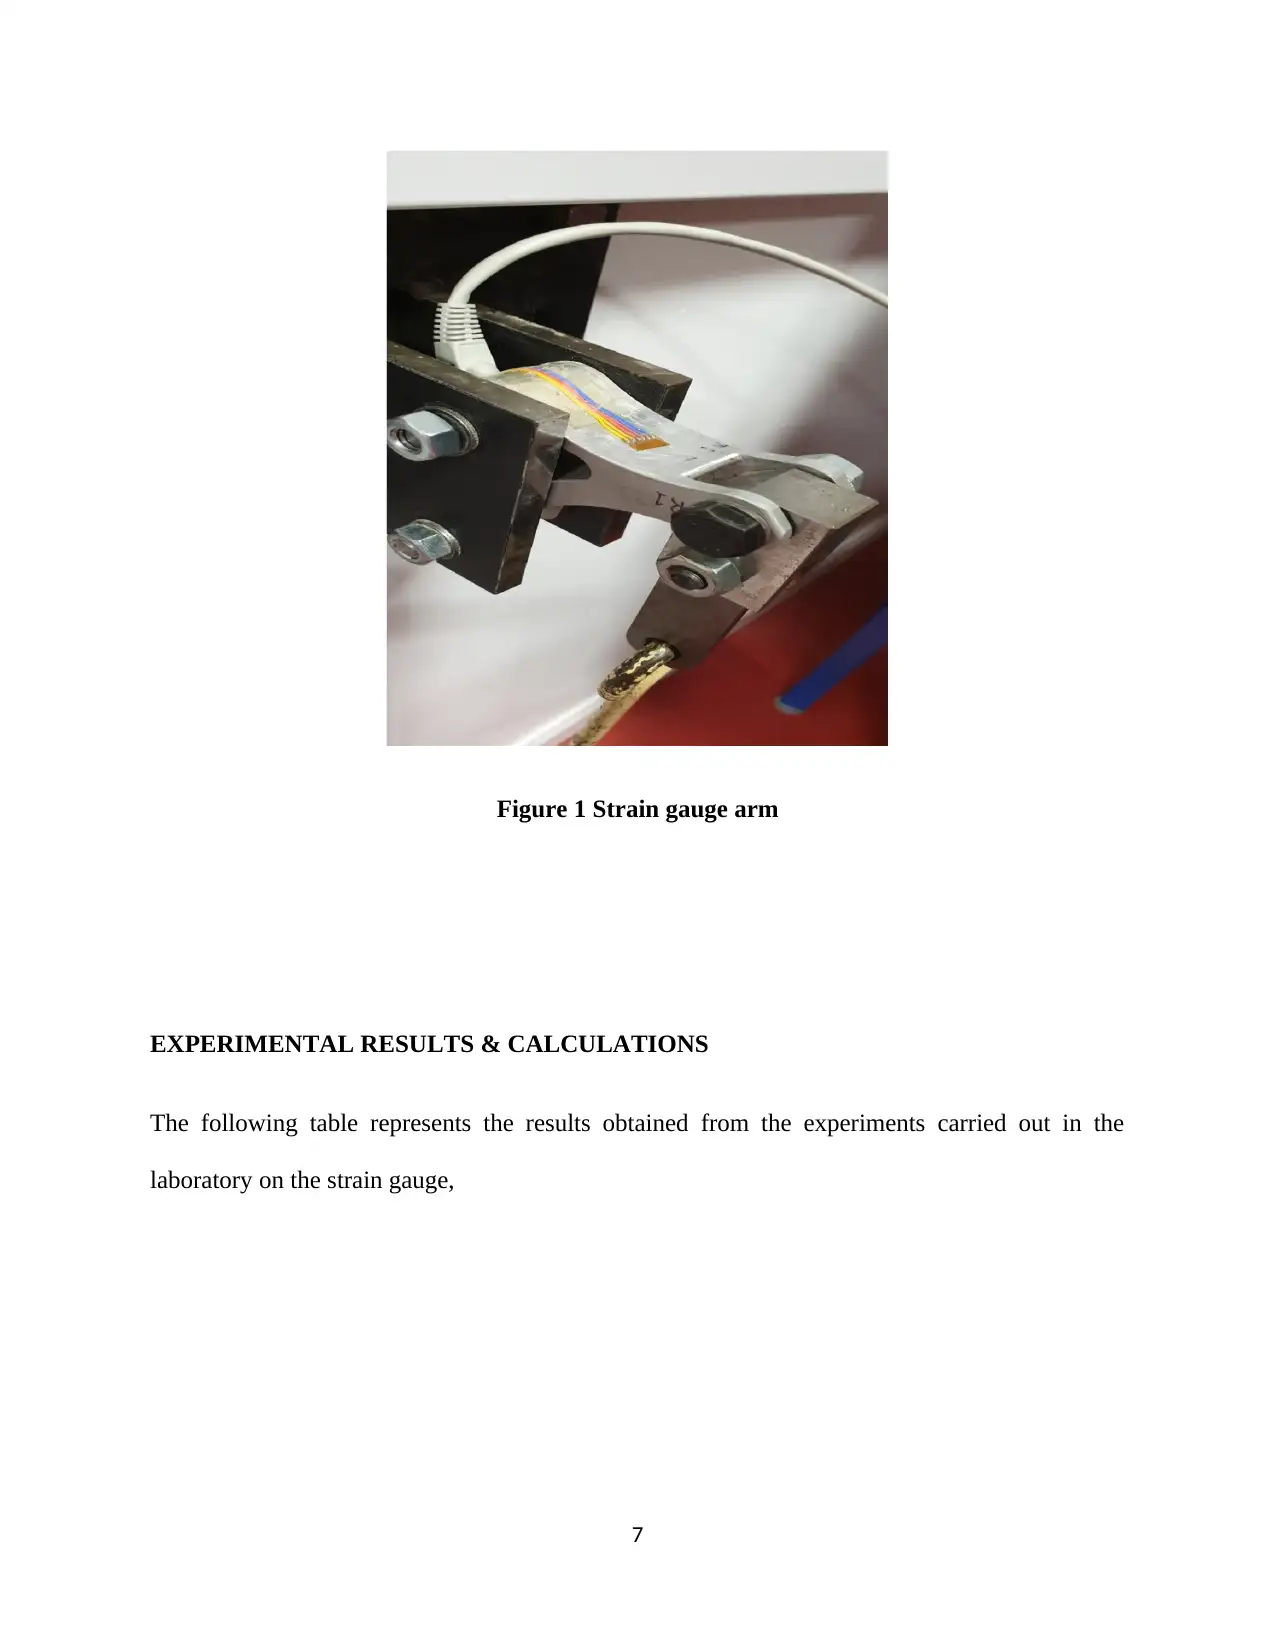
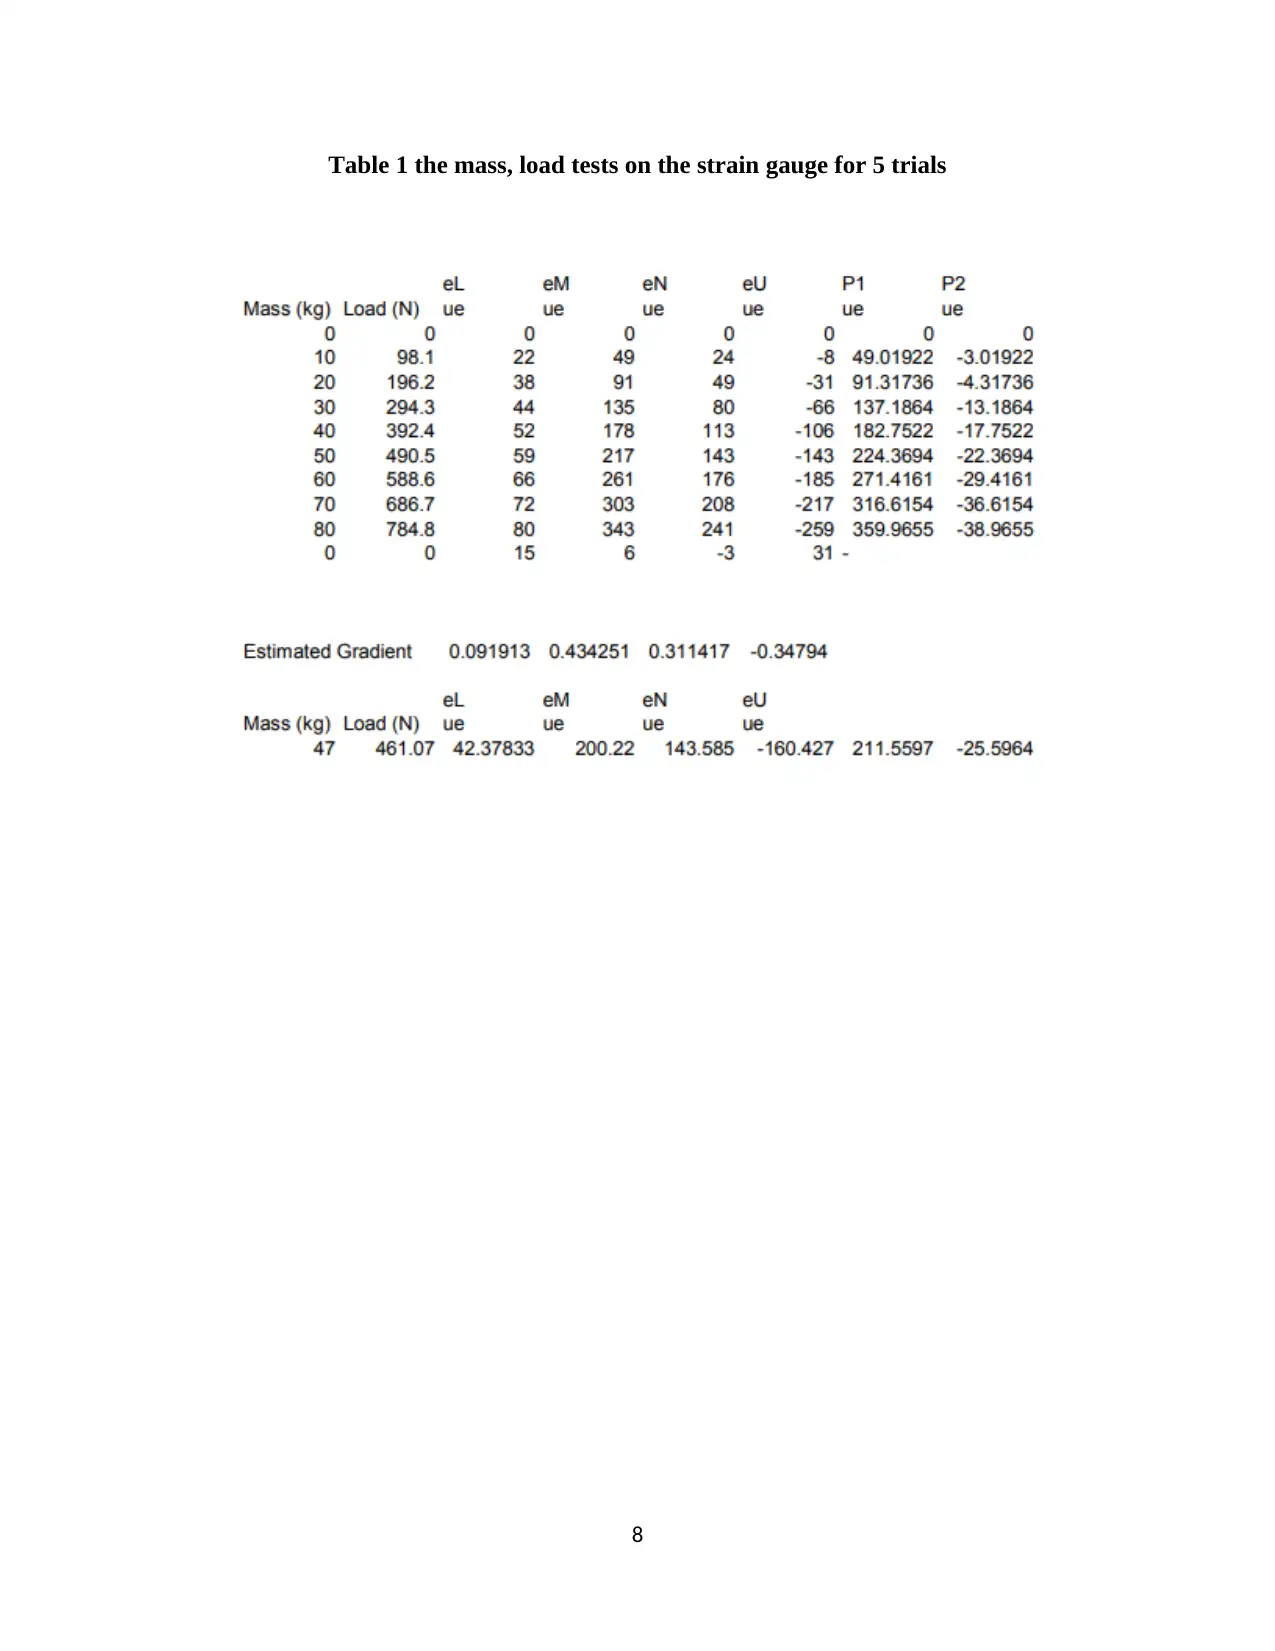
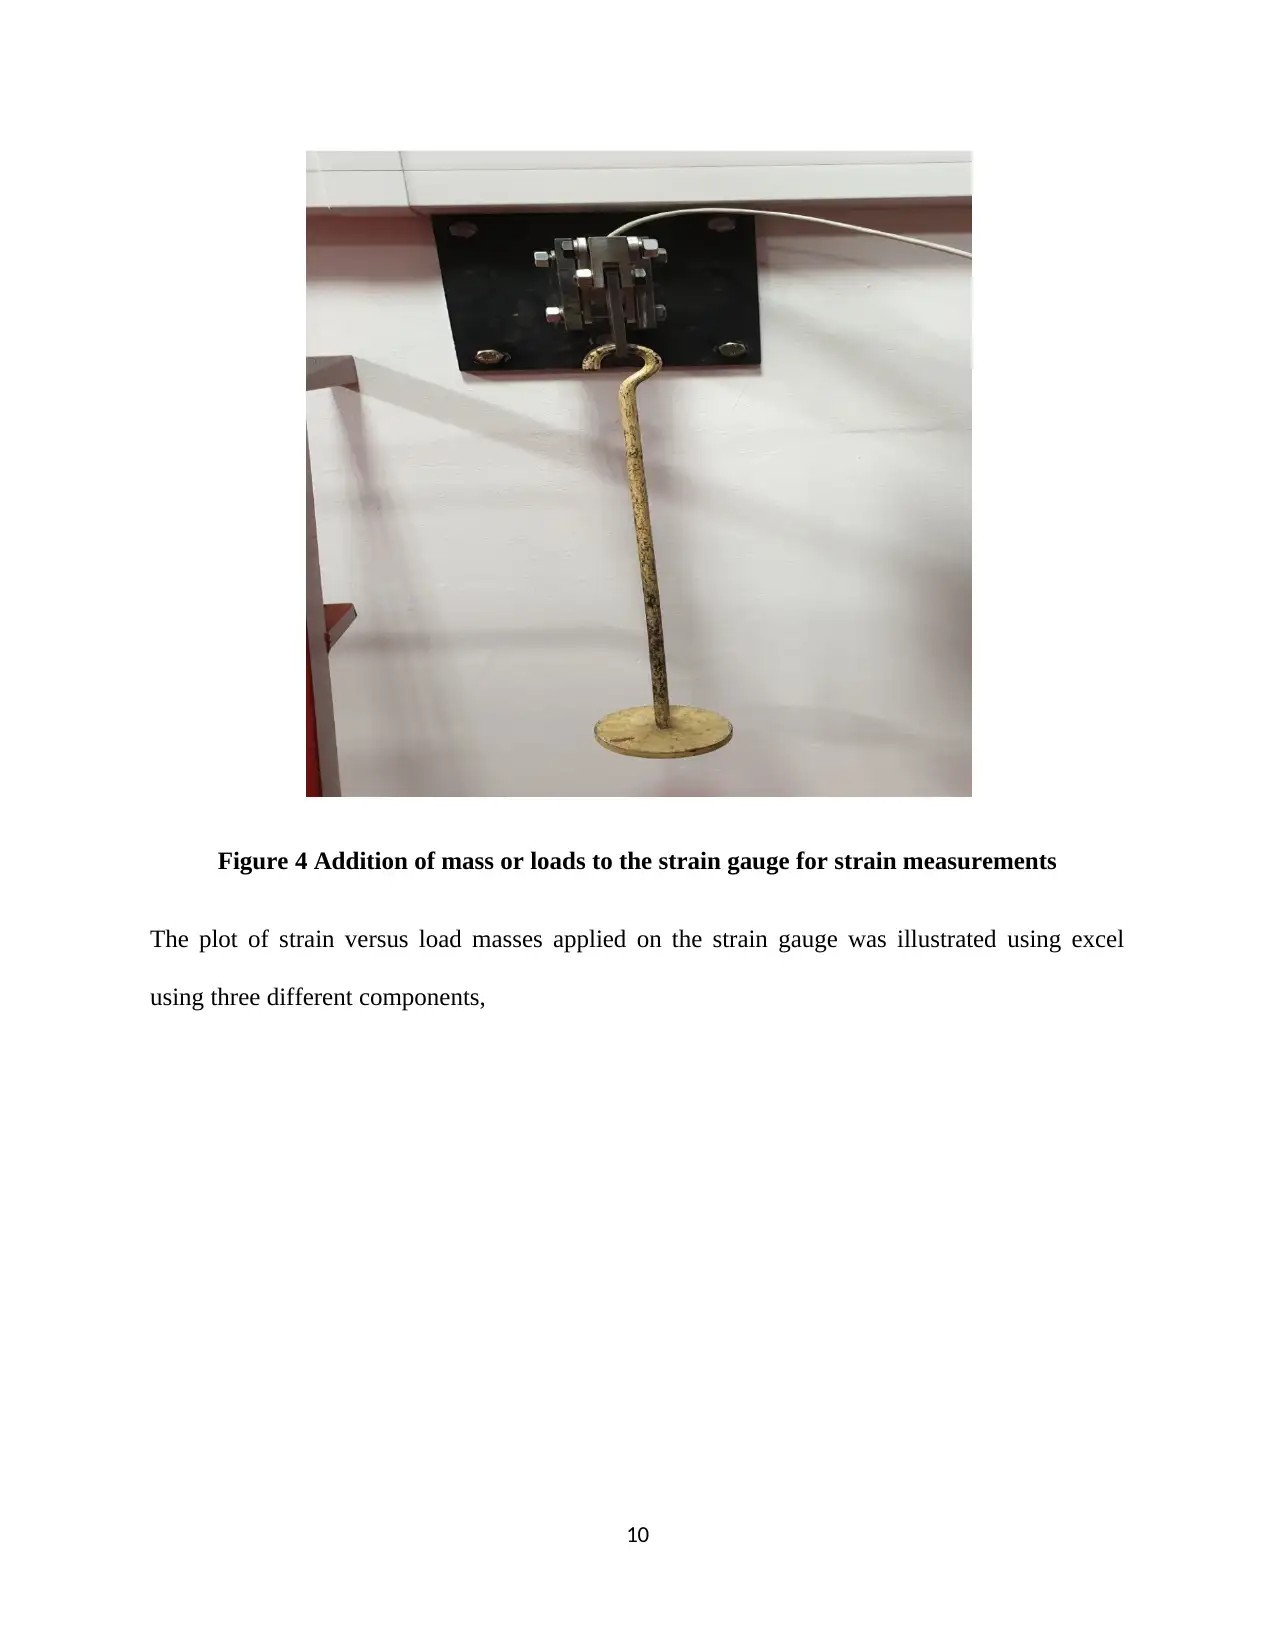
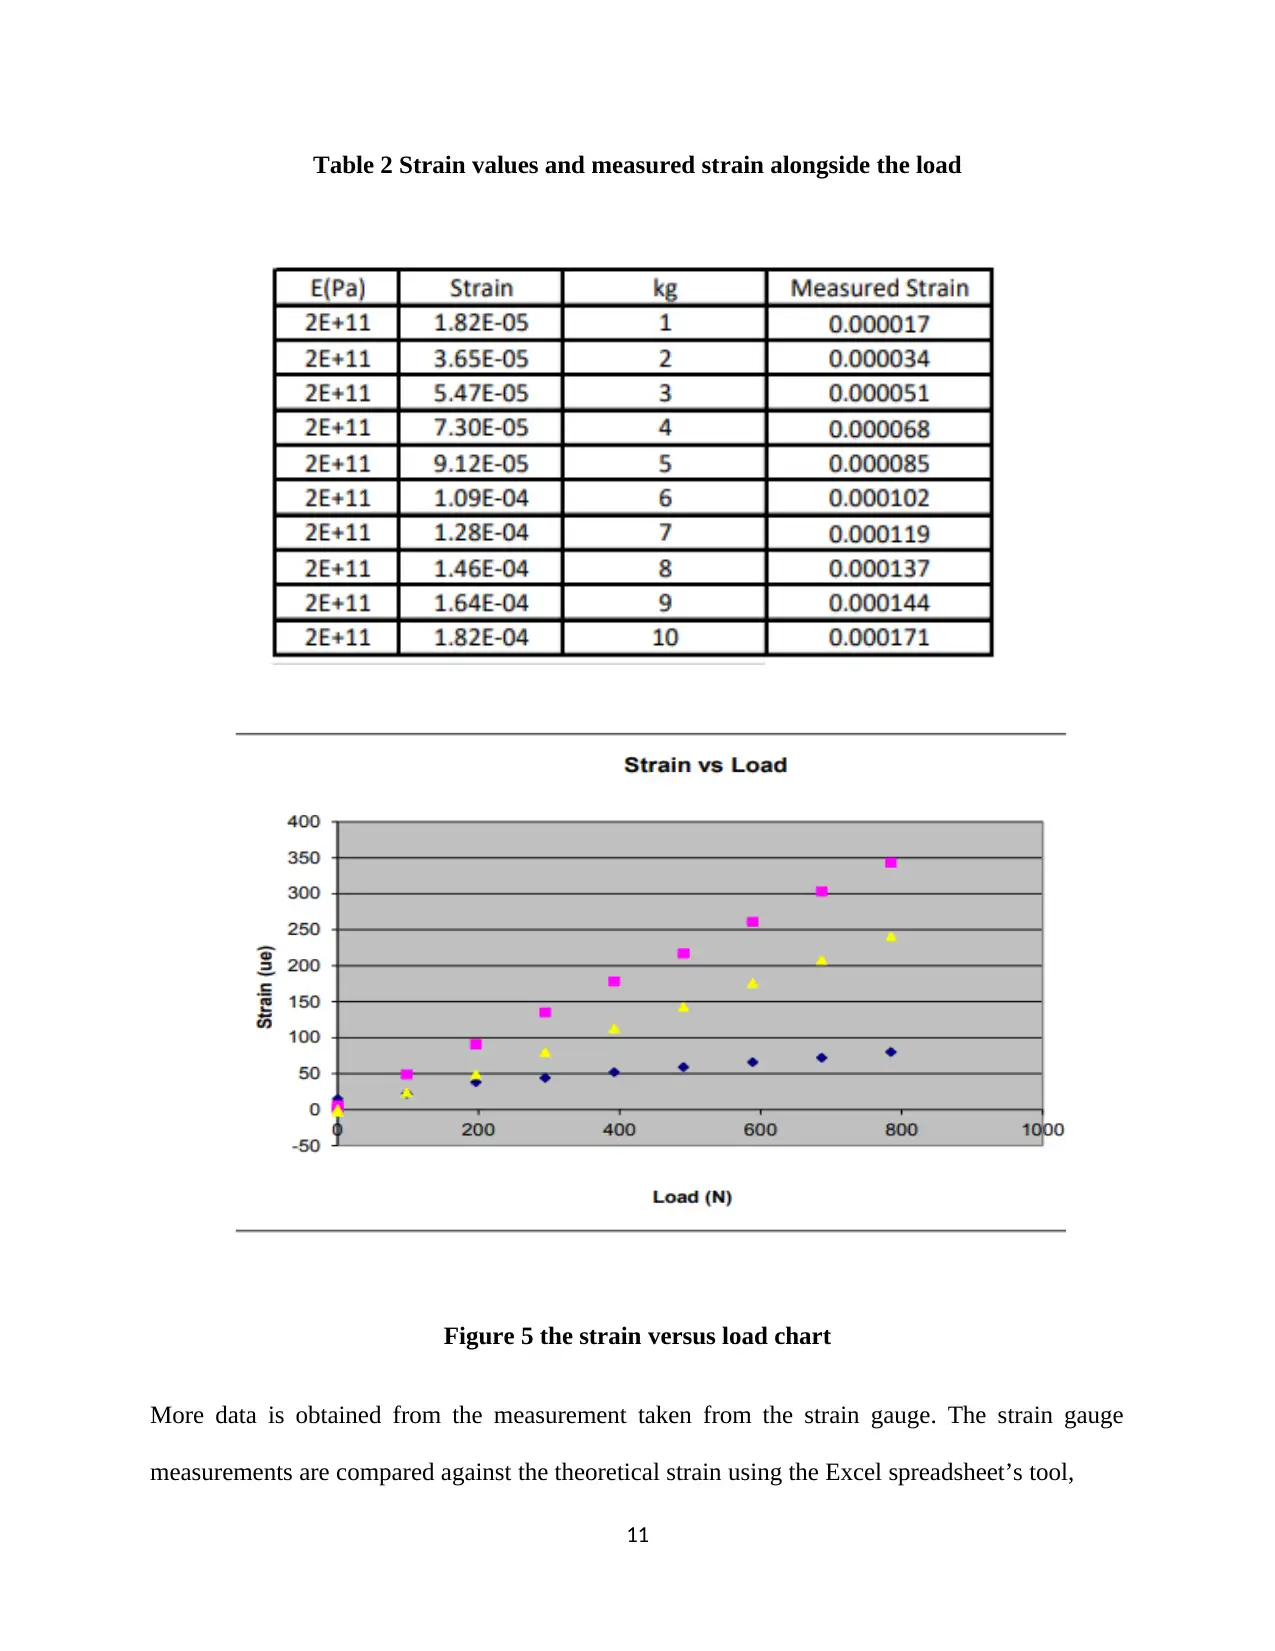
This report details a mechanical engineering experiment utilizing strain gauges to measure the strain exerted on a material under varying loads. The report outlines the experimental setup, including the apparatus used such as a single-seat racing car suspension rocker arm, strain gauge data acquisition unit, and various masses. The experimental procedure involved setting up the Wheatstone bridge, zeroing the channels, and recording data as loads were applied. The results section presents tables and graphs illustrating the relationship between applied load and measured strain, comparing theoretical and experimental values. The discussion analyzes the linear relationship observed, demonstrating the material's elasticity, and explores the concepts of Poisson's ratio and gauge factor. Additionally, the report discusses the construction of Mohr's circle for plane strain to determine stress components and includes future work and recommendations. Finally, the report concludes by summarizing the experiment's findings, emphasizing the strain gauge's role in determining strain and inferring stress through mathematical computations and the application of Young's modulus and Poisson's ratio.
Document Page
Strain Gauge Measurements
Student Name
Student registration Number
Instructor
Date of submission
tabler-icon-diamond-filled.svg

Paraphrase This Document

Need a fresh take? Get an instant paraphrase of this document with our AI Paraphraser
Document Page
INTRODUCTION
Material science studies the strength of materials using the strain and stress
measurements. The strain describes the amount of deformation that a body undergoes as a result
of an applied force. The strain is a fractional change in length. An external force is applied to a
structure and the internal components of the material structure vary slightly along the grain
resulting in a change in dimension. For instance, a rod may tend to elongate when an external
force pulls it apart and the components of the structure are said to be strained (Wieringa, 2012).
The strain gauge is used to measure the changes in dimension for the strain when
different masses are used as external forces. Sensors are used to measure the strain using the
electrical resistance. The sensors should have a good spatial resolution and the strain is measured
at a given point. The environmental conditions should not affect the electrical resistance of a
material (Riley, 2011). The sensor needs to have a high-frequency response for the dynamic
strain measurements.
The strain gauge is measured for its initial electrical resistance while no external force is
applied and the system varies in proportion to the amount of strain in the device. The metallic
strain gauge is commonly used in various laboratory experiments. The strain gauge measures
strain in different material structures. The laboratory setup includes a sensor based on
transducers to measure the force, acceleration, and pressure. These gauges are economically
feasible hence can be used for experimentation purposes. The figure below shows a supported
beam that has lateral forces. The force is applied at the middle and the beam elongates towards
the bottom surfaces and shortens the top surface (Meer, 2011).
1
Document Page
Considering a common engineering design process and there are necessary procedures
carried out to determine the strain and stress of a material structure to determine if a given
structure is sound or fit for use in the construction industry. Unfortunately, it is quite difficult to
determine the stress of a material or measure the stress directly. The strain gauge measures the
stress and the Hooke’s law is used to compute the stress.
Strain gauge devices are constructed and designed to make their resistance vary
whenever they are strained (when the physical dimension decrease or increase). In most cases
this is basically made to occur if the body that they are bound varies hence the strain gauge
resistance can be employed to measure and record the amount of strain that is experience in the
body (Jindal, 2012). To optimize this effect there are some major considerations which are taken
into account while using strain gauge. The first consideration is to construct a strain gauge in
which the resistance varies appreciably with strain. The second consideration is that the strain is
attached to a system in a way that they are affected by the strain.
2
Document Page
The normal stress is directly proportional to the strain. The material property that distinguishes
the strain from the stress is the modulus of elasticity, E. It is commonly known as the Young’s
Modulus. It is important to determine the change in resistance and the strain of a given material.
The resistance of the wire is given as,
R=ρ L
A . . . . . . . . . . . . . . . . . . . . . . . . . . . . . . . . . . . . . . . . . . . . . . . . . . . . . . . . . . . . . . . .1
Where R is the resistance, L is the length of the conducting wire, A is the cross sectional area of
the wire and ρ is the resistivity of the conducting wire.
Obtaining the logarithm of the differentiated resistance of the wire, we obtain,
dR
R =
ρ + dL
L dA
A . . . . . . . . . . . . . . . . . . . . . . . . . . . . . . . . . . . . . . . . . . . . . . . . . . . . . . . 2
dL
L axial strain
dA
A =2 dD
D ,
dD
D transverse strain , ε t
The relationship between the axial and transverse strain is given as,
ε t=v εa ( v poisso n' s ratio)
The strain gauge equation is therefore obtained as,
dR
R =
ρ +εa (1+2 v) . . . . . . . . . . . . . . . . . . . . . . . . . . . . . . . . . . . . . . . . . . . . . . . . . . . 3
3
tabler-icon-diamond-filled.svg

Paraphrase This Document

Need a fresh take? Get an instant paraphrase of this document with our AI Paraphraser
Document Page
The strain gauge factor is obtained as,
S=
dR
R
εa
. . . . . . . . . . . . . . . . . . . . . . . . . . . . . . . . . . . . . . . . . . . . . . . . . . . . . . . . . . . . . . . . . 4
Combining equations 3 and 4, gives the strain gauge factor in the equation 5 as given below,
S=1+ 2 v+

ρ
εa
. . . . . . . . . . . . . . . . . . . . . . . . . . . . . . . . . . . . . . . . . . . . . . . . . . . . . . . . .5
It is important to note that the strain gauge measurements are taken considering the
temperature is held constant and the resistivity is considered to be proportional to the strain. The
strain gauge factor is constant and may be sensitive to the changes in temperature (Metcalf,
2016). the construction of the strain gauge includes the design of straight wires compacted to
each other by etching them from the thin foil metal sheets which are bound to a plastic backing.
Some strain gauges are made of semiconductor material used for sensor application such as the
pressure and acceleration transducers. The transverse sensitivity effects are neglected in strain
measurements.
The strain on the surface is used to specify two orthogonal linear strains alongside the
shear strain and the change in angle between the solid under strain. The strain rosette is used to
determine the linear orthogonal strains and the shear strain when placed in the given
arrangements. The strain gauge rosettes come in two forms: rectangular and equiangular rosette.
The variation is based on the angles in which they are placed. The gauges angles are 0, 45, and
90 degrees for the rectangular rosette. The gauges vary as 0, 60, and 120 degrees for the
equiangular rosette (Cetinkunt, 2015).
4
Document Page
EXPERIMENTAL APPARATUS
(i) Single seat racing car suspension rocker arm (alloy 1060 in H16 temper).
(ii) P3 strain gauge data acquisition unit and PC to record the strain data
5
Document Page
(iii) The strain gauge has a rectangular 450 strain gauge rosette and a single linear strain
gauge attached to one of the webs
(iv) 10kg masses
EXPERIMENTAL PROCEDURE
(i) The Wheatstone bridge is set to quarter bridge gauge factors at 2.05 for the rosette
limbs and 2.1 for the linear gauge.
(ii) The balance on the screen control of P3 strain indicator is selected and it opens the
balance mode window.
(iii) The channels 1 to 4 were set to auto and to the zero point. The set gauges were
recorded to read initial zero values.
(iv) The balance mode window was closed and the record window was clicked to open up
a sub-window that allowed one to define how the measurements were to be recorded.
(v) The manual recording radio button was selected and several additional options
appeared.
(vi) The radio buttons for the channels 1 to 4 were selected.
(vii) The saving data settings were set to save information on the computer where the data
capture equipment to record and saved the data on the computer.
6
tabler-icon-diamond-filled.svg

Paraphrase This Document

Need a fresh take? Get an instant paraphrase of this document with our AI Paraphraser
Document Page
Figure 1 Strain gauge arm
EXPERIMENTAL RESULTS & CALCULATIONS
The following table represents the results obtained from the experiments carried out in the
laboratory on the strain gauge,
7
Document Page
Table 1 the mass, load tests on the strain gauge for 5 trials
8
Document Page
Figure 2 the strain indication and recorder system connected to the strain gauge P3 system
Figure 3 Excel data records from the P3 strain indicator and recorder output
9
tabler-icon-diamond-filled.svg

Paraphrase This Document

Need a fresh take? Get an instant paraphrase of this document with our AI Paraphraser
Document Page
Figure 4 Addition of mass or loads to the strain gauge for strain measurements
The plot of strain versus load masses applied on the strain gauge was illustrated using excel
using three different components,
10
Document Page
Table 2 Strain values and measured strain alongside the load
Figure 5 the strain versus load chart
More data is obtained from the measurement taken from the strain gauge. The strain gauge
measurements are compared against the theoretical strain using the Excel spreadsheet’s tool,
11
chevron_up_icon
1 out of 19
circle_padding
hide_on_mobile
zoom_out_icon
[object Object]