Performance Analysis of a PV System at UCLan Media Building, Preston
VerifiedAdded on 2022/08/15
|13
|2763
|13
Report
AI Summary
This report presents an analysis of a photovoltaic (PV) system installed on the roof of the Media Building at the University of Central Lancashire (UCLan) campus in Preston. The study investigates the system's design, including panel inclination, panel type, and equipment such as inverters and storage facilities. The report analyzes data collected in 2013, including DC and AC voltage readings, system yield, and solar irradiance to determine the system's efficiency and performance ratio. The analysis covers monthly voltage recordings, system yield calculations, and solar irradiance data to evaluate the overall performance of the PV system. The report also discusses the performance ratio (PR) and the simulation of the system using PVSYST software. The findings provide insights into the effectiveness of the PV system in generating electricity and its overall efficiency.
1Running head: A PHOTOVOLTAIC (PV) SYSTEM ANALYSIS
A photovoltaic (PV) system Analysis
[Name]
[Institutional Affiliation]
A photovoltaic (PV) system Analysis
[Name]
[Institutional Affiliation]
Paraphrase This Document
Need a fresh take? Get an instant paraphrase of this document with our AI Paraphraser
2A PHOTOVOLTAIC (PV) SYSTEM ANALYSIS
Introduction
The cost of electricity and energy at large is becoming high as times goes by and in the future this
trend will increase, because the cost of living is also becoming high as well. solar power is the best bet
for curbing this by using solar energy to generate electricity and boil water. solar energy has various
advantages, among them the fact that it cannot be depleted. Like the UK, solar radiation is fair
throughout the year, with intermittency experienced during snowing times, but still with good
systems, solar energy can be harnessed. That said, anywhere in the world, a good installation practice,
which starts with a well-designed system, is the best way of getting reaping the benefits of solar. A
good installation of solar PV system, whether it is for commercial or industrial or even domestic use,
needs to consider the following: the inclination angle, the solar type (monocrystalline, or
polycrystalline solar types), and whoever installing must have a good financial backing, since solar is
very expensive.
When talking about PV system, there are two sides to it, the direct current (DC) and alternating
current (AC), where one of the sides is supportive to the end user, AC, and the other one is where
generation starts, DC. In parallel connection, the maximum input current that the inverter has is more
than or equal to the current of the PV, the combiner boxes that are connected to the arrays (whether
there’s monitoring base or not). The solar is installed, whether in parallel or in series, accompanied
with other equipment like the inverter and the storage facilities. The AC of the PV farm has cables
connection, like the Low Tension (LT) and mega voltage switchgear, power transformers, (converting
from Low voltage (LV) to Mega voltage (MV)), Metering equipment, the transmission lines and the
high tension (HT) switchyard. This paper, aims at analysing the performance of the PV system, of a
monitored data. Where the monitored data is of a PV system on the roof of the media building on
UCLan campus in Preston. The data were collected in 2013, and they are of, DC and AC sources
(where efficiency is to be determined), the yield of the system, Irradiation data (the performance ratio
calculation is to be determined).

3A PHOTOVOLTAIC (PV) SYSTEM ANALYSIS
The System Design
In this project, the solar panels shall be laid on the roof, inclined in a specified angle to receive
maximum light from the sun when the sun is a position. The angle proposed for the solar panels shall
be 10O and the area of coverage is 283m2. The solar panels shall be arranged in a string of 18, that is
around 12 modules in parallel connection, and each array has four PV panels. Each solar panel is rated
180W of power and the manufacturing company is Sharp, with the solar, which is a monocrystalline
type. The solar panels choice is because of efficiency which is needed in the premise, and
monocrystalline are more efficient compared to polycrystalline (Taylor-Parker, 2019). The solar has a
number NU180E1, which according to the company indicates the power the amount of power
produced by one panel. An array has 36 panels which has around 6 arrays, this further means that the
ultimate number of panels are 216 panels. The number of converters shall be six, which have a
parallel connection to panels.
After establishing the arrays, there shall be a connection of the junction boxes, where the arrays have
a DC connection through, this is at the DC side of the solar farm. The solar junction boxes, each of
them has two wires on them, for DC positive and the other DC negative. It allows the solar panels to
be connected in series, where the solar PV panels are connected together by a connection of the
positive lead to the negative lead of the other panel, this increases the voltage on each string. On the
other hand, for parallel connection, the wiring needs positive leads to be connected and the same case
with the negative lead (Admin Power from light, 2017).
⊘ This is a preview!⊘
Do you want full access?
Subscribe today to unlock all pages.
Trusted by 1+ million students worldwide
4A PHOTOVOLTAIC (PV) SYSTEM ANALYSIS
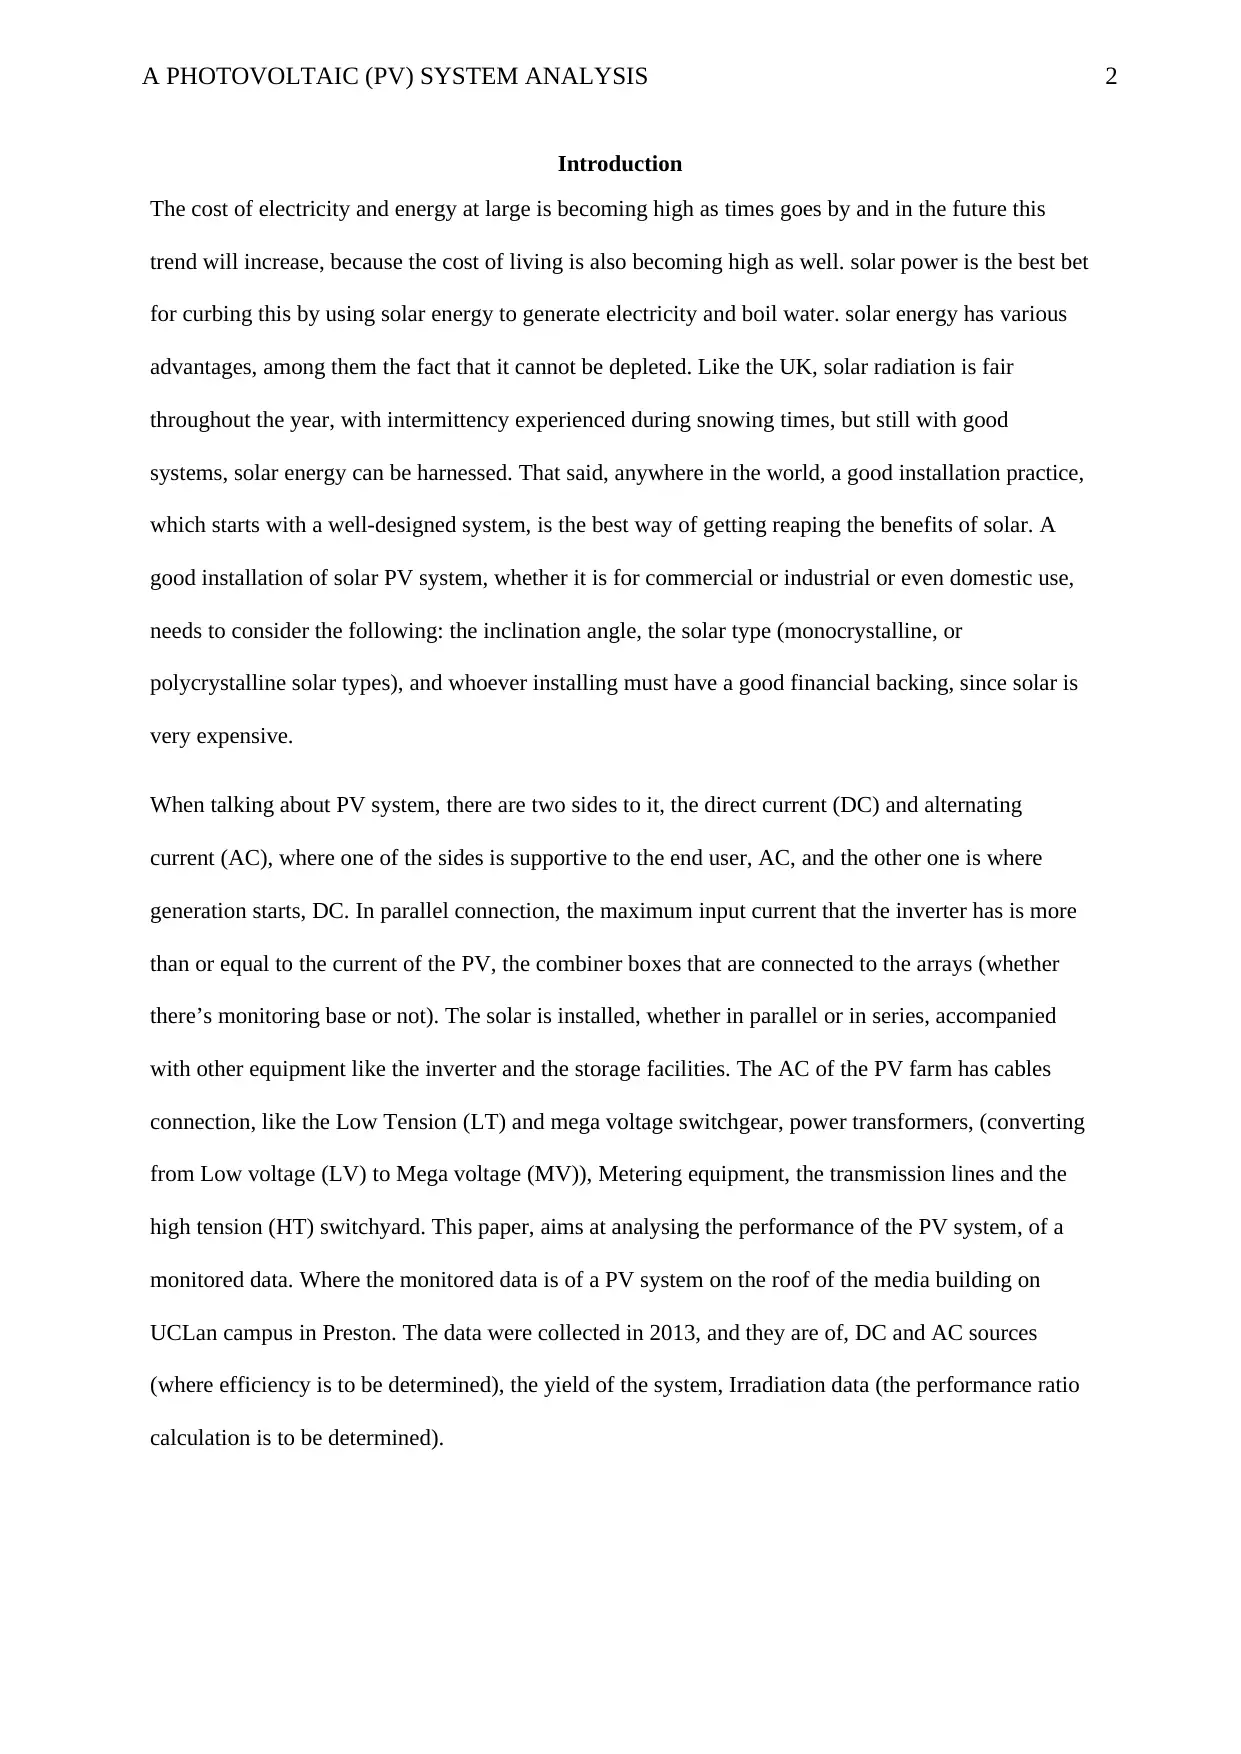
Figure 1: Solar PV arranged onto the roof of the Media Factory of UCLan
The DC isolator switch is essential in a solar installation, every technician or engineer must know this.
DC isolators manually disconnect themselves from the solar PV arrays for safety of the system. They
can also be manually operated during maintenance of the system or repairs of the system on the DC
side of the farm. At the AC side of the farm, there are the AC isolator switches, after the inverter
connection, from the grid, there are the AC isolator switches connected. These are important to isolate
or disconnect the AC component from the system just after the inverter (Sustainable Construction
Services, 2020).
For the project the isolators that shall are used are of 32A rating, the DC isolators. The centralised
inverters shall be used here since they are cheaper than the string inverters, especially for a large scale
like this, though they require a highly skilled technical support to have them maintained or repaired
(Misbrener , 2018). From the isolators, the power is not transmitted to the loads of the building or
premise. There will be the Low Voltage boards connected afterwards before the power goes to the
loads. The loads are connected through these boards, where there are other set of isolators or circuit
breakers, Mould Case Circuit Breaker (MCCB). With appropriate, and properly sized cable, the
connection of the load is managed through the circuit breaker. For the project, the appropriate one will
be of 225A rating and the main on from the solar plant is 1600A. the cable to the loads shall be
calculated and sized.
Paraphrase This Document
Need a fresh take? Get an instant paraphrase of this document with our AI Paraphraser
5A PHOTOVOLTAIC (PV) SYSTEM ANALYSIS
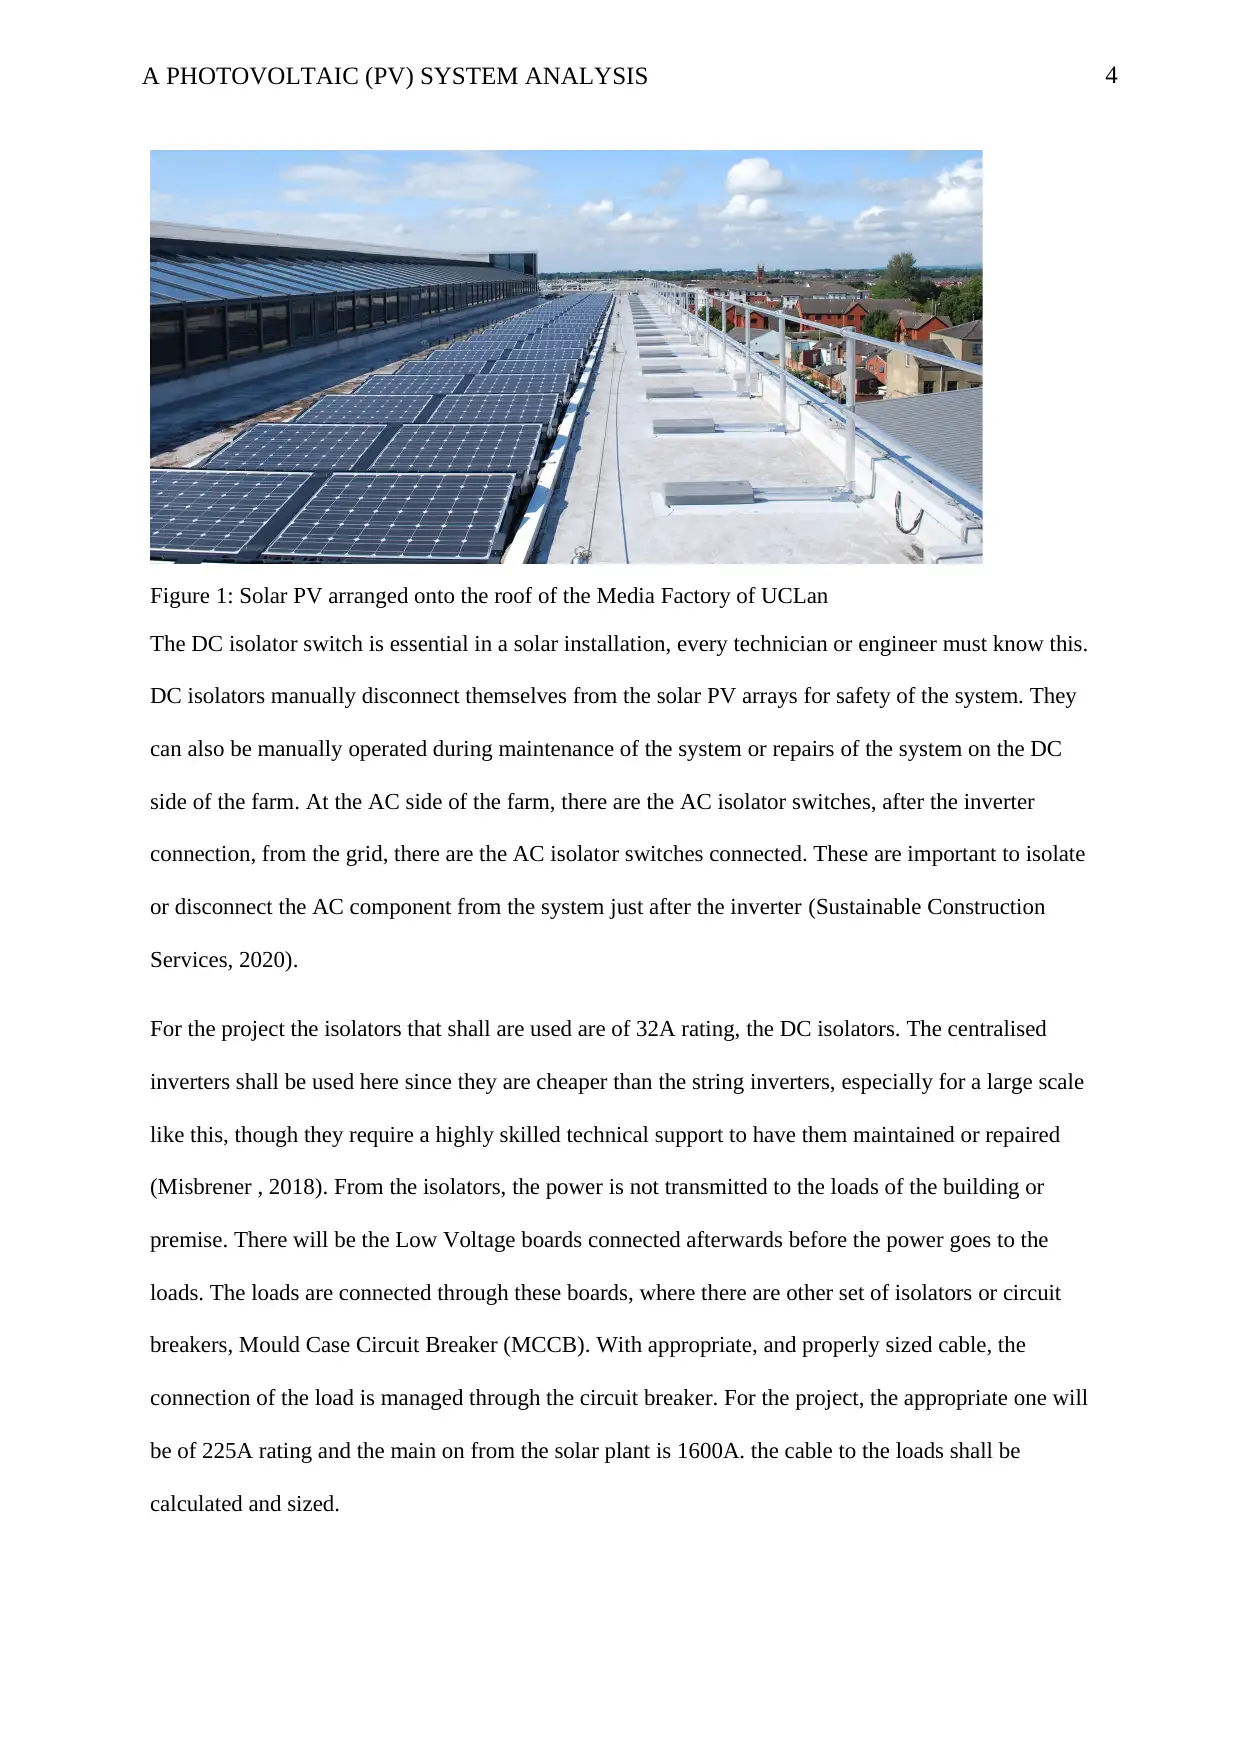
Figure 2:The parameters of the solar project at the Media Factory in UCLan, Preston
The project has specifications which are shown in figure 2, they show the specs that are important for
the installation of the project. The rating of the solar panel, the module number, the peak power etc, as
discussed before are summarised on this table.
Analysing the Data
The data presented of the shows the hourly rate of the how the solar farm was performing with the
equipment that were installed in them. The spread sheet data for instance shows the hourly rate of the
solar recorded in the year 2013, which are now compressed to show the monthly rate of the DC and
AC voltages. This will help in determining the efficiency of the system, so that it can be known what
needs to be improved and how.
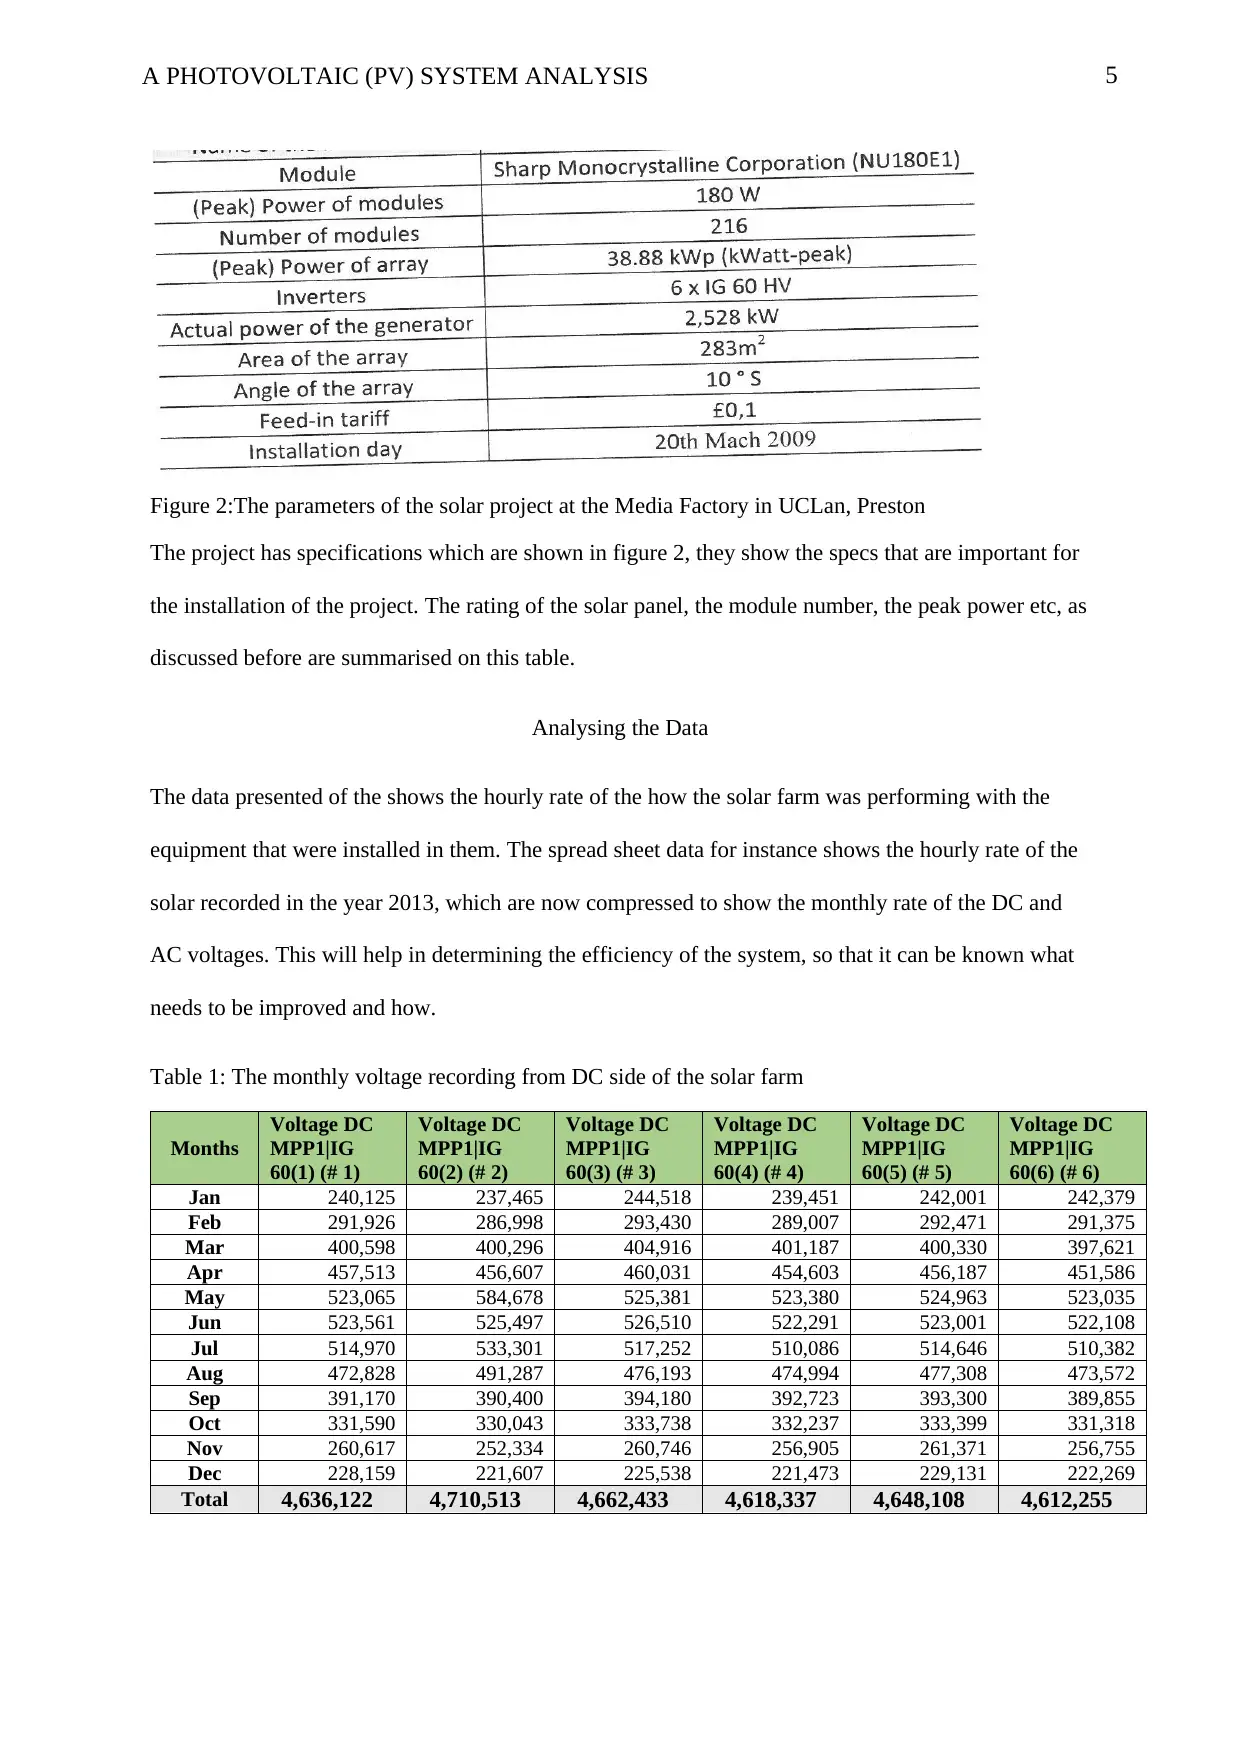
Table 1: The monthly voltage recording from DC side of the solar farm
Months
Voltage DC
MPP1|IG
60(1) (# 1)
Voltage DC
MPP1|IG
60(2) (# 2)
Voltage DC
MPP1|IG
60(3) (# 3)
Voltage DC
MPP1|IG
60(4) (# 4)
Voltage DC
MPP1|IG
60(5) (# 5)
Voltage DC
MPP1|IG
60(6) (# 6)
Jan 240,125 237,465 244,518 239,451 242,001 242,379
Feb 291,926 286,998 293,430 289,007 292,471 291,375
Mar 400,598 400,296 404,916 401,187 400,330 397,621
Apr 457,513 456,607 460,031 454,603 456,187 451,586
May 523,065 584,678 525,381 523,380 524,963 523,035
Jun 523,561 525,497 526,510 522,291 523,001 522,108
Jul 514,970 533,301 517,252 510,086 514,646 510,382
Aug 472,828 491,287 476,193 474,994 477,308 473,572
Sep 391,170 390,400 394,180 392,723 393,300 389,855
Oct 331,590 330,043 333,738 332,237 333,399 331,318
Nov 260,617 252,334 260,746 256,905 261,371 256,755
Dec 228,159 221,607 225,538 221,473 229,131 222,269
Total 4,636,122 4,710,513 4,662,433 4,618,337 4,648,108 4,612,255
Figure 2:The parameters of the solar project at the Media Factory in UCLan, Preston
The project has specifications which are shown in figure 2, they show the specs that are important for
the installation of the project. The rating of the solar panel, the module number, the peak power etc, as
discussed before are summarised on this table.
Analysing the Data
The data presented of the shows the hourly rate of the how the solar farm was performing with the
equipment that were installed in them. The spread sheet data for instance shows the hourly rate of the
solar recorded in the year 2013, which are now compressed to show the monthly rate of the DC and
AC voltages. This will help in determining the efficiency of the system, so that it can be known what
needs to be improved and how.
Table 1: The monthly voltage recording from DC side of the solar farm
Months
Voltage DC
MPP1|IG
60(1) (# 1)
Voltage DC
MPP1|IG
60(2) (# 2)
Voltage DC
MPP1|IG
60(3) (# 3)
Voltage DC
MPP1|IG
60(4) (# 4)
Voltage DC
MPP1|IG
60(5) (# 5)
Voltage DC
MPP1|IG
60(6) (# 6)
Jan 240,125 237,465 244,518 239,451 242,001 242,379
Feb 291,926 286,998 293,430 289,007 292,471 291,375
Mar 400,598 400,296 404,916 401,187 400,330 397,621
Apr 457,513 456,607 460,031 454,603 456,187 451,586
May 523,065 584,678 525,381 523,380 524,963 523,035
Jun 523,561 525,497 526,510 522,291 523,001 522,108
Jul 514,970 533,301 517,252 510,086 514,646 510,382
Aug 472,828 491,287 476,193 474,994 477,308 473,572
Sep 391,170 390,400 394,180 392,723 393,300 389,855
Oct 331,590 330,043 333,738 332,237 333,399 331,318
Nov 260,617 252,334 260,746 256,905 261,371 256,755
Dec 228,159 221,607 225,538 221,473 229,131 222,269
Total 4,636,122 4,710,513 4,662,433 4,618,337 4,648,108 4,612,255
6A PHOTOVOLTAIC (PV) SYSTEM ANALYSIS
Jan Feb Mar Apr May Jun Jul Aug Sep Oct Nov Dec
-
100,000
200,000
300,000
400,000
500,000
600,000
700,000
Voltage DC MPP1|IG 60(1) (# 1) Voltage DC MPP1|IG 60(2) (# 2) Voltage DC MPP1|IG 60(3) (# 3)
Voltage DC MPP1|IG 60(4) (# 4) Voltage DC MPP1|IG 60(5) (# 5) Voltage DC MPP1|IG 60(6) (# 6)
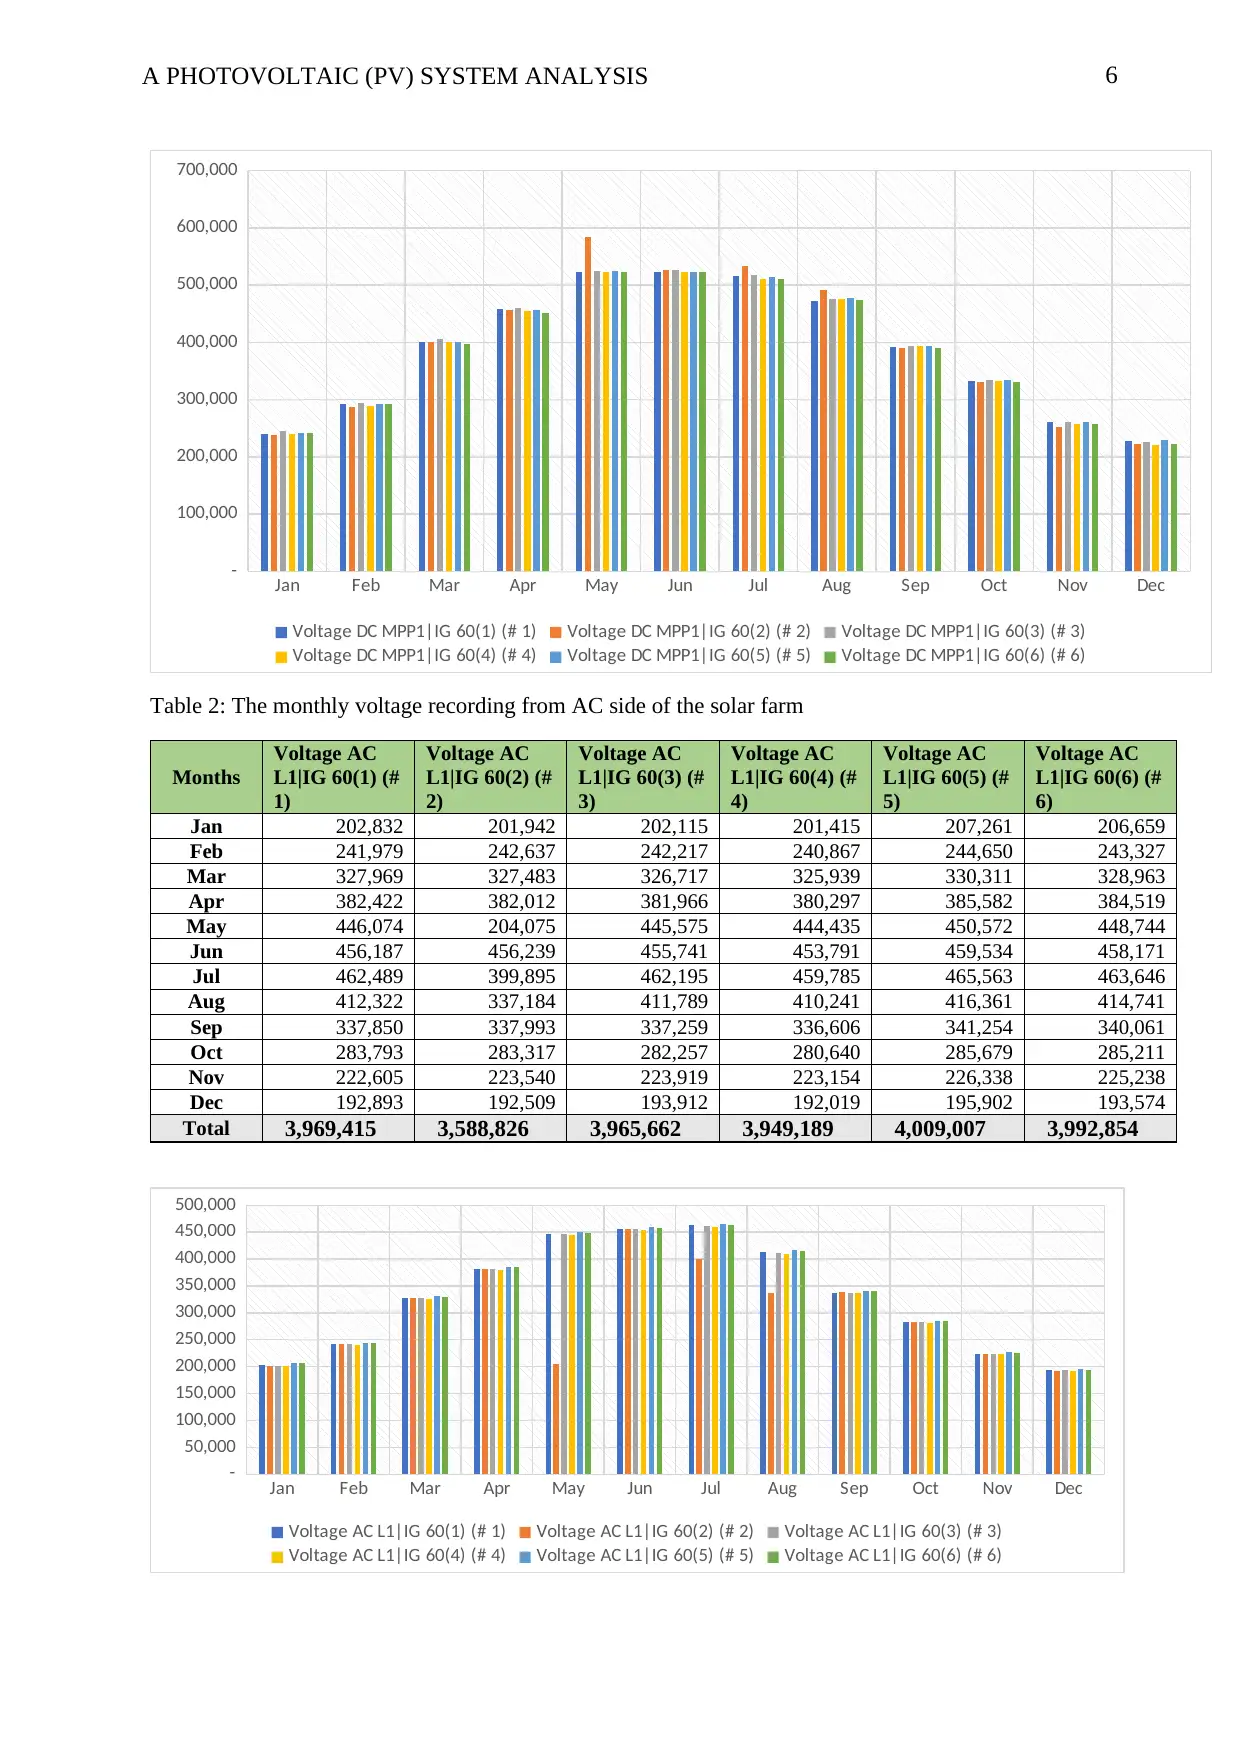
Table 2: The monthly voltage recording from AC side of the solar farm
Months
Voltage AC
L1|IG 60(1) (#
1)
Voltage AC
L1|IG 60(2) (#
2)
Voltage AC
L1|IG 60(3) (#
3)
Voltage AC
L1|IG 60(4) (#
4)
Voltage AC
L1|IG 60(5) (#
5)
Voltage AC
L1|IG 60(6) (#
6)
Jan 202,832 201,942 202,115 201,415 207,261 206,659
Feb 241,979 242,637 242,217 240,867 244,650 243,327
Mar 327,969 327,483 326,717 325,939 330,311 328,963
Apr 382,422 382,012 381,966 380,297 385,582 384,519
May 446,074 204,075 445,575 444,435 450,572 448,744
Jun 456,187 456,239 455,741 453,791 459,534 458,171
Jul 462,489 399,895 462,195 459,785 465,563 463,646
Aug 412,322 337,184 411,789 410,241 416,361 414,741
Sep 337,850 337,993 337,259 336,606 341,254 340,061
Oct 283,793 283,317 282,257 280,640 285,679 285,211
Nov 222,605 223,540 223,919 223,154 226,338 225,238
Dec 192,893 192,509 193,912 192,019 195,902 193,574
Total 3,969,415 3,588,826 3,965,662 3,949,189 4,009,007 3,992,854
Jan Feb Mar Apr May Jun Jul Aug Sep Oct Nov Dec
-
50,000
100,000
150,000
200,000
250,000
300,000
350,000
400,000
450,000
500,000
Voltage AC L1|IG 60(1) (# 1) Voltage AC L1|IG 60(2) (# 2) Voltage AC L1|IG 60(3) (# 3)
Voltage AC L1|IG 60(4) (# 4) Voltage AC L1|IG 60(5) (# 5) Voltage AC L1|IG 60(6) (# 6)
Jan Feb Mar Apr May Jun Jul Aug Sep Oct Nov Dec
-
100,000
200,000
300,000
400,000
500,000
600,000
700,000
Voltage DC MPP1|IG 60(1) (# 1) Voltage DC MPP1|IG 60(2) (# 2) Voltage DC MPP1|IG 60(3) (# 3)
Voltage DC MPP1|IG 60(4) (# 4) Voltage DC MPP1|IG 60(5) (# 5) Voltage DC MPP1|IG 60(6) (# 6)
Table 2: The monthly voltage recording from AC side of the solar farm
Months
Voltage AC
L1|IG 60(1) (#
1)
Voltage AC
L1|IG 60(2) (#
2)
Voltage AC
L1|IG 60(3) (#
3)
Voltage AC
L1|IG 60(4) (#
4)
Voltage AC
L1|IG 60(5) (#
5)
Voltage AC
L1|IG 60(6) (#
6)
Jan 202,832 201,942 202,115 201,415 207,261 206,659
Feb 241,979 242,637 242,217 240,867 244,650 243,327
Mar 327,969 327,483 326,717 325,939 330,311 328,963
Apr 382,422 382,012 381,966 380,297 385,582 384,519
May 446,074 204,075 445,575 444,435 450,572 448,744
Jun 456,187 456,239 455,741 453,791 459,534 458,171
Jul 462,489 399,895 462,195 459,785 465,563 463,646
Aug 412,322 337,184 411,789 410,241 416,361 414,741
Sep 337,850 337,993 337,259 336,606 341,254 340,061
Oct 283,793 283,317 282,257 280,640 285,679 285,211
Nov 222,605 223,540 223,919 223,154 226,338 225,238
Dec 192,893 192,509 193,912 192,019 195,902 193,574
Total 3,969,415 3,588,826 3,965,662 3,949,189 4,009,007 3,992,854
Jan Feb Mar Apr May Jun Jul Aug Sep Oct Nov Dec
-
50,000
100,000
150,000
200,000
250,000
300,000
350,000
400,000
450,000
500,000
Voltage AC L1|IG 60(1) (# 1) Voltage AC L1|IG 60(2) (# 2) Voltage AC L1|IG 60(3) (# 3)
Voltage AC L1|IG 60(4) (# 4) Voltage AC L1|IG 60(5) (# 5) Voltage AC L1|IG 60(6) (# 6)
⊘ This is a preview!⊘
Do you want full access?
Subscribe today to unlock all pages.
Trusted by 1+ million students worldwide
7A PHOTOVOLTAIC (PV) SYSTEM ANALYSIS
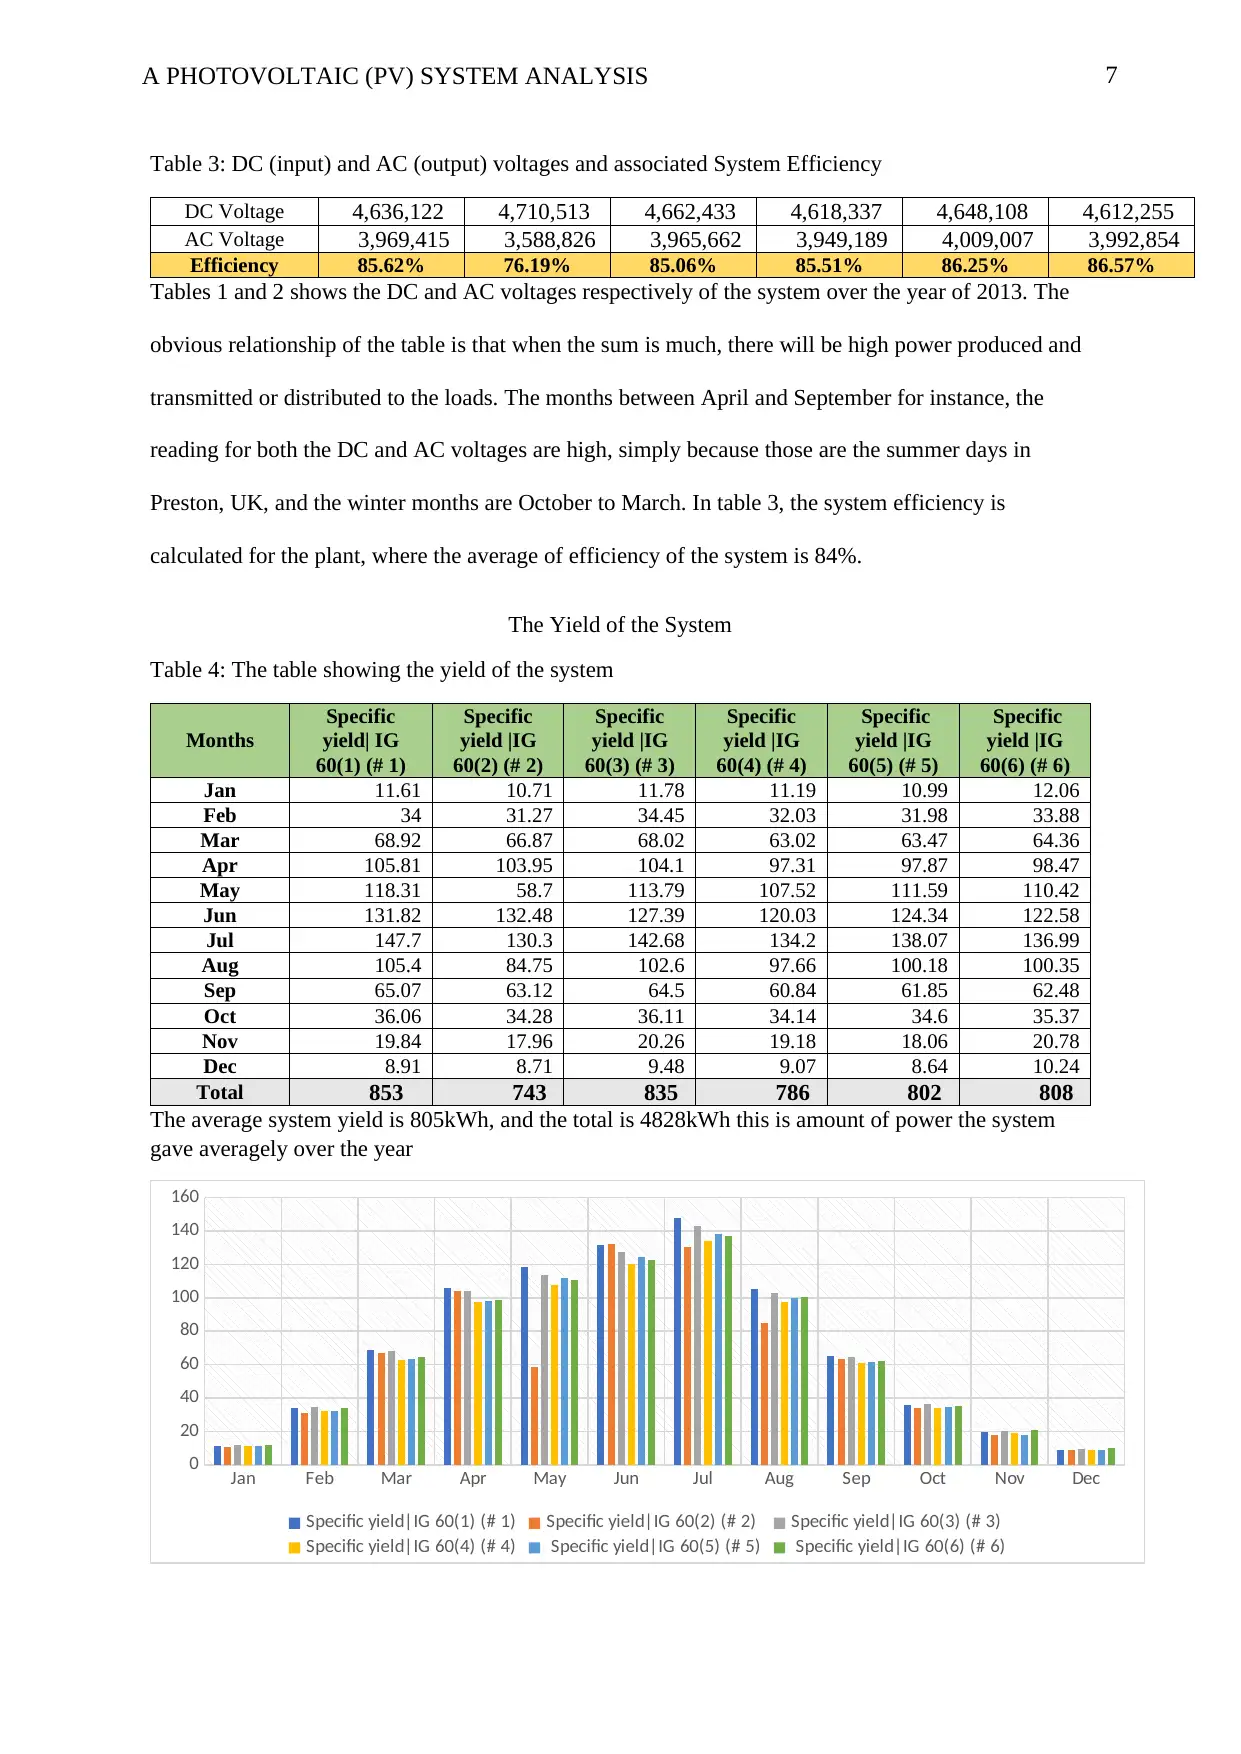
Table 3: DC (input) and AC (output) voltages and associated System Efficiency
DC Voltage 4,636,122 4,710,513 4,662,433 4,618,337 4,648,108 4,612,255
AC Voltage 3,969,415 3,588,826 3,965,662 3,949,189 4,009,007 3,992,854
Efficiency 85.62% 76.19% 85.06% 85.51% 86.25% 86.57%
Tables 1 and 2 shows the DC and AC voltages respectively of the system over the year of 2013. The
obvious relationship of the table is that when the sum is much, there will be high power produced and
transmitted or distributed to the loads. The months between April and September for instance, the
reading for both the DC and AC voltages are high, simply because those are the summer days in
Preston, UK, and the winter months are October to March. In table 3, the system efficiency is
calculated for the plant, where the average of efficiency of the system is 84%.
The Yield of the System
Table 4: The table showing the yield of the system
Months
Specific
yield| IG
60(1) (# 1)
Specific
yield |IG
60(2) (# 2)
Specific
yield |IG
60(3) (# 3)
Specific
yield |IG
60(4) (# 4)
Specific
yield |IG
60(5) (# 5)
Specific
yield |IG
60(6) (# 6)
Jan 11.61 10.71 11.78 11.19 10.99 12.06
Feb 34 31.27 34.45 32.03 31.98 33.88
Mar 68.92 66.87 68.02 63.02 63.47 64.36
Apr 105.81 103.95 104.1 97.31 97.87 98.47
May 118.31 58.7 113.79 107.52 111.59 110.42
Jun 131.82 132.48 127.39 120.03 124.34 122.58
Jul 147.7 130.3 142.68 134.2 138.07 136.99
Aug 105.4 84.75 102.6 97.66 100.18 100.35
Sep 65.07 63.12 64.5 60.84 61.85 62.48
Oct 36.06 34.28 36.11 34.14 34.6 35.37
Nov 19.84 17.96 20.26 19.18 18.06 20.78
Dec 8.91 8.71 9.48 9.07 8.64 10.24
Total 853 743 835 786 802 808
The average system yield is 805kWh, and the total is 4828kWh this is amount of power the system
gave averagely over the year
Jan Feb Mar Apr May Jun Jul Aug Sep Oct Nov Dec
0
20
40
60
80
100
120
140
160
Specific yield|IG 60(1) (# 1) Specific yield|IG 60(2) (# 2) Specific yield|IG 60(3) (# 3)
Specific yield|IG 60(4) (# 4) Specific yield|IG 60(5) (# 5) Specific yield|IG 60(6) (# 6)
Paraphrase This Document
Need a fresh take? Get an instant paraphrase of this document with our AI Paraphraser
8A PHOTOVOLTAIC (PV) SYSTEM ANALYSIS
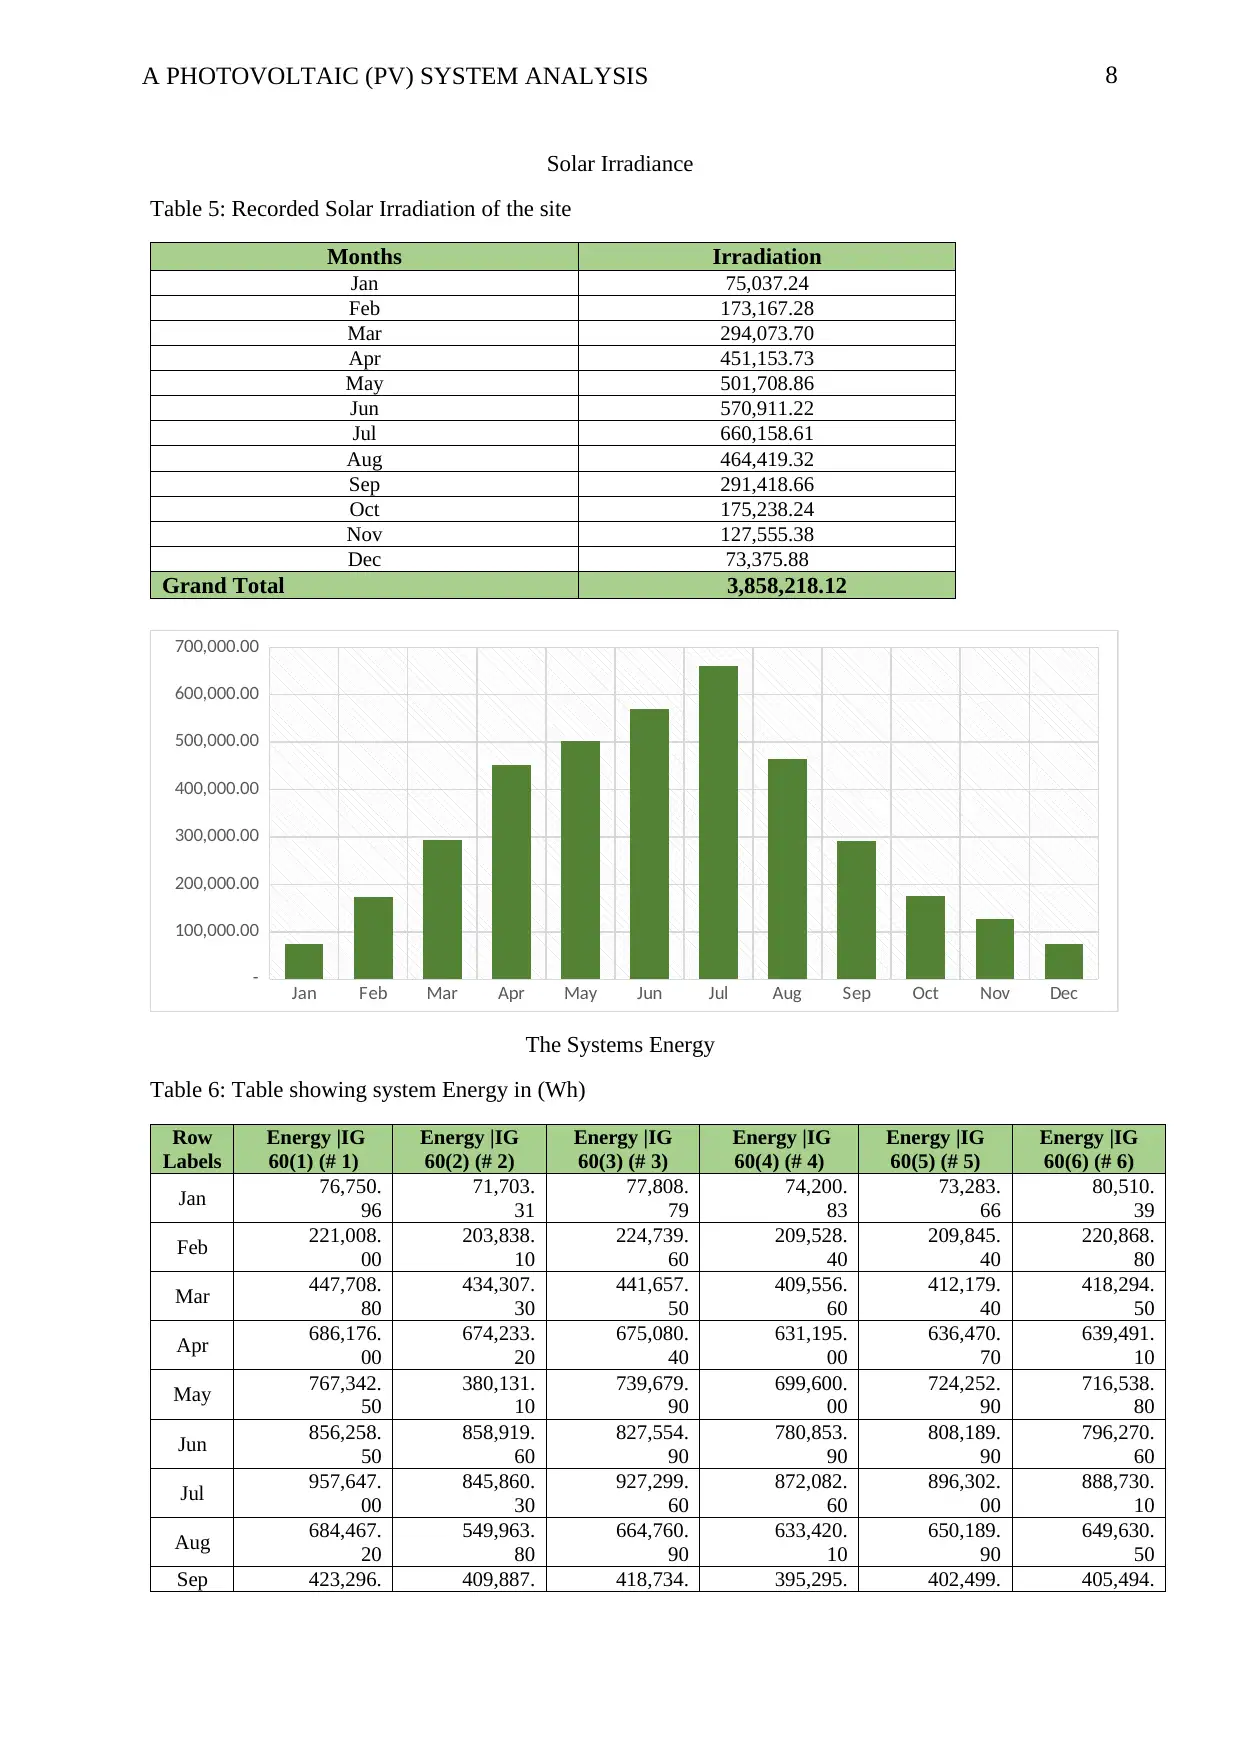
Solar Irradiance
Table 5: Recorded Solar Irradiation of the site
Months Irradiation
Jan 75,037.24
Feb 173,167.28
Mar 294,073.70
Apr 451,153.73
May 501,708.86
Jun 570,911.22
Jul 660,158.61
Aug 464,419.32
Sep 291,418.66
Oct 175,238.24
Nov 127,555.38
Dec 73,375.88
Grand Total 3,858,218.12
Jan Feb Mar Apr May Jun Jul Aug Sep Oct Nov Dec
-
100,000.00
200,000.00
300,000.00
400,000.00
500,000.00
600,000.00
700,000.00
The Systems Energy
Table 6: Table showing system Energy in (Wh)
Row
Labels
Energy |IG
60(1) (# 1)
Energy |IG
60(2) (# 2)
Energy |IG
60(3) (# 3)
Energy |IG
60(4) (# 4)
Energy |IG
60(5) (# 5)
Energy |IG
60(6) (# 6)
Jan 76,750.
96
71,703.
31
77,808.
79
74,200.
83
73,283.
66
80,510.
39
Feb 221,008.
00
203,838.
10
224,739.
60
209,528.
40
209,845.
40
220,868.
80
Mar 447,708.
80
434,307.
30
441,657.
50
409,556.
60
412,179.
40
418,294.
50
Apr 686,176.
00
674,233.
20
675,080.
40
631,195.
00
636,470.
70
639,491.
10
May 767,342.
50
380,131.
10
739,679.
90
699,600.
00
724,252.
90
716,538.
80
Jun 856,258.
50
858,919.
60
827,554.
90
780,853.
90
808,189.
90
796,270.
60
Jul 957,647.
00
845,860.
30
927,299.
60
872,082.
60
896,302.
00
888,730.
10
Aug 684,467.
20
549,963.
80
664,760.
90
633,420.
10
650,189.
90
649,630.
50
Sep 423,296. 409,887. 418,734. 395,295. 402,499. 405,494.
9A PHOTOVOLTAIC (PV) SYSTEM ANALYSIS
30 40 20 40 60 00
Oct 235,776.
50
224,171.
60
236,323.
40
223,275.
60
226,385.
40
231,073.
00
Nov 129,620.
30
117,854.
30
132,736.
00
126,522.
30
118,021.
00
135,859.
20
Dec 59,697.
98
58,380.
99
63,633.
13
60,684.
61
57,749.
35
68,202.
48
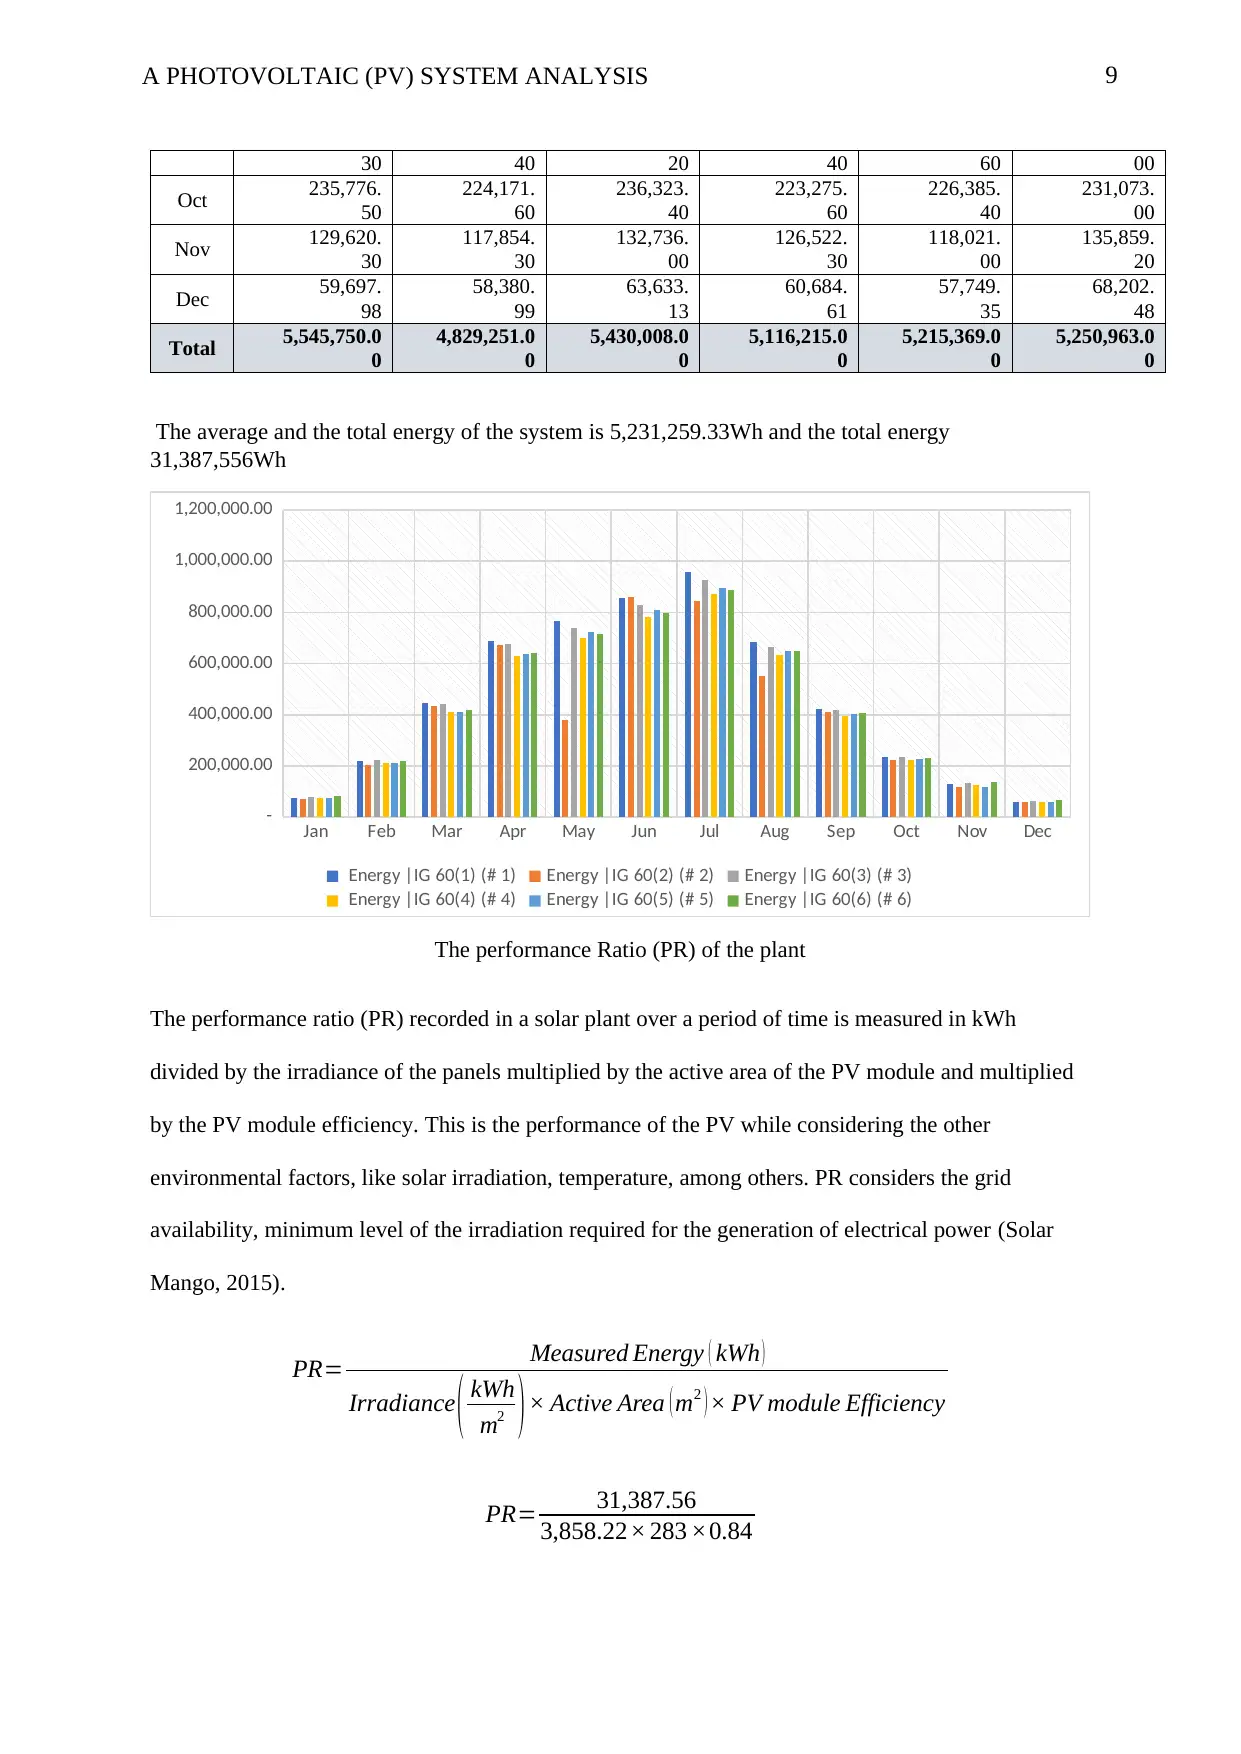
Total 5,545,750.0
0
4,829,251.0
0
5,430,008.0
0
5,116,215.0
0
5,215,369.0
0
5,250,963.0
0
The average and the total energy of the system is 5,231,259.33Wh and the total energy
31,387,556Wh
Jan Feb Mar Apr May Jun Jul Aug Sep Oct Nov Dec
-
200,000.00
400,000.00
600,000.00
800,000.00
1,000,000.00
1,200,000.00
Energy |IG 60(1) (# 1) Energy |IG 60(2) (# 2) Energy |IG 60(3) (# 3)
Energy |IG 60(4) (# 4) Energy |IG 60(5) (# 5) Energy |IG 60(6) (# 6)
The performance Ratio (PR) of the plant
The performance ratio (PR) recorded in a solar plant over a period of time is measured in kWh
divided by the irradiance of the panels multiplied by the active area of the PV module and multiplied
by the PV module efficiency. This is the performance of the PV while considering the other
environmental factors, like solar irradiation, temperature, among others. PR considers the grid
availability, minimum level of the irradiation required for the generation of electrical power (Solar
Mango, 2015).
PR= Measured Energy ( kWh )
Irradiance ( kWh
m2 )× Active Area ( m2 ) × PV module Efficiency
PR= 31,387.56
3,858.22× 283 ×0.84
30 40 20 40 60 00
Oct 235,776.
50
224,171.
60
236,323.
40
223,275.
60
226,385.
40
231,073.
00
Nov 129,620.
30
117,854.
30
132,736.
00
126,522.
30
118,021.
00
135,859.
20
Dec 59,697.
98
58,380.
99
63,633.
13
60,684.
61
57,749.
35
68,202.
48
Total 5,545,750.0
0
4,829,251.0
0
5,430,008.0
0
5,116,215.0
0
5,215,369.0
0
5,250,963.0
0
The average and the total energy of the system is 5,231,259.33Wh and the total energy
31,387,556Wh
Jan Feb Mar Apr May Jun Jul Aug Sep Oct Nov Dec
-
200,000.00
400,000.00
600,000.00
800,000.00
1,000,000.00
1,200,000.00
Energy |IG 60(1) (# 1) Energy |IG 60(2) (# 2) Energy |IG 60(3) (# 3)
Energy |IG 60(4) (# 4) Energy |IG 60(5) (# 5) Energy |IG 60(6) (# 6)
The performance Ratio (PR) of the plant
The performance ratio (PR) recorded in a solar plant over a period of time is measured in kWh
divided by the irradiance of the panels multiplied by the active area of the PV module and multiplied
by the PV module efficiency. This is the performance of the PV while considering the other
environmental factors, like solar irradiation, temperature, among others. PR considers the grid
availability, minimum level of the irradiation required for the generation of electrical power (Solar
Mango, 2015).
PR= Measured Energy ( kWh )
Irradiance ( kWh
m2 )× Active Area ( m2 ) × PV module Efficiency
PR= 31,387.56
3,858.22× 283 ×0.84
⊘ This is a preview!⊘
Do you want full access?
Subscribe today to unlock all pages.
Trusted by 1+ million students worldwide

10A PHOTOVOLTAIC (PV) SYSTEM ANALYSIS
¿ 0.03422 ≈ 3.4 %
Simulation of the system using PVSYST
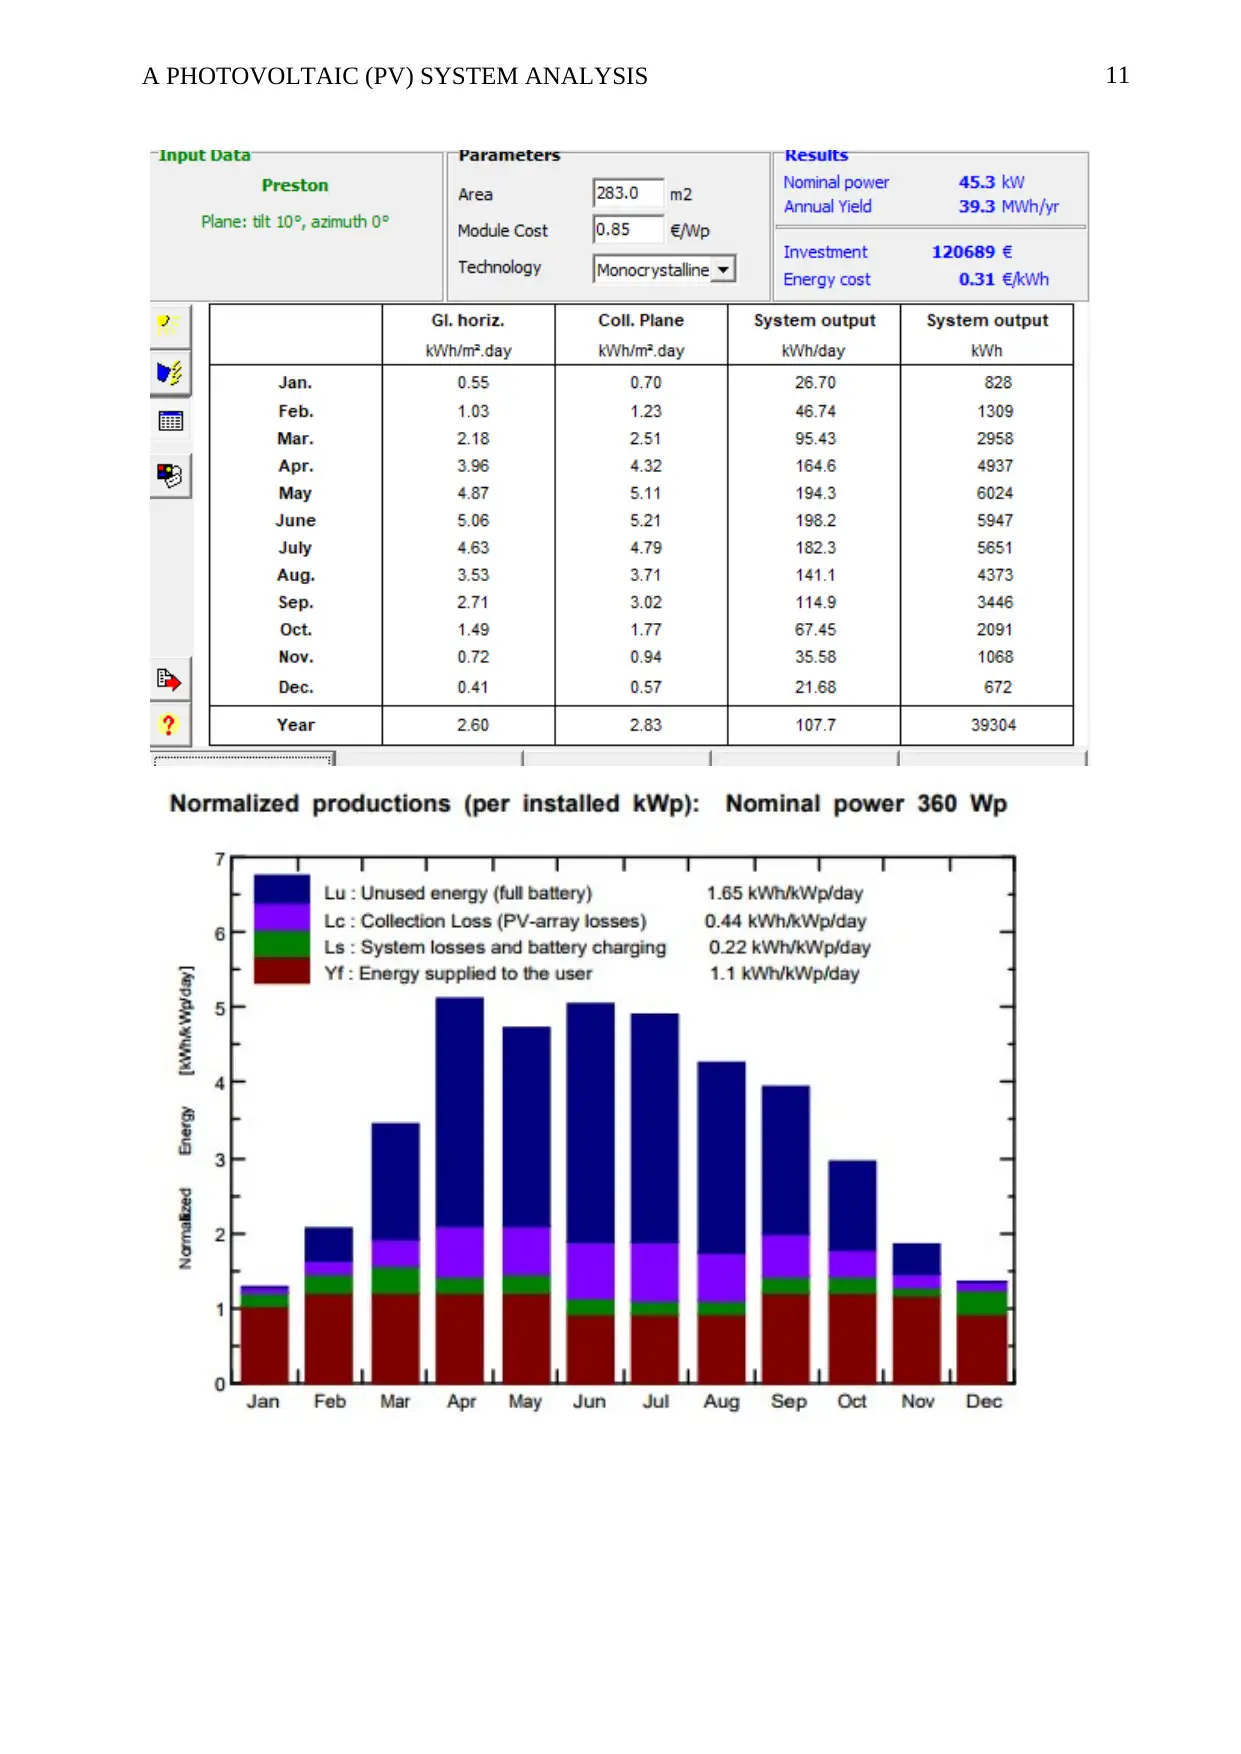
PVSYST is a software for determining a lot of thing pertaining solar installation, but the key among
the parameters in this project is the system’s solar irradiation. The first thing to set in the PVSYST is
the geographical area of interest. Shown in figure 3. The area of interest is Preston in the UK. The
next stage is setting the parameters like the angle of tilt, the solar type among others to come up with a
figure like the ones below
Figure 3: The area of Interest shown here is Preston
¿ 0.03422 ≈ 3.4 %
Simulation of the system using PVSYST
PVSYST is a software for determining a lot of thing pertaining solar installation, but the key among
the parameters in this project is the system’s solar irradiation. The first thing to set in the PVSYST is
the geographical area of interest. Shown in figure 3. The area of interest is Preston in the UK. The
next stage is setting the parameters like the angle of tilt, the solar type among others to come up with a
figure like the ones below
Figure 3: The area of Interest shown here is Preston
Paraphrase This Document
Need a fresh take? Get an instant paraphrase of this document with our AI Paraphraser
11A PHOTOVOLTAIC (PV) SYSTEM ANALYSIS
12A PHOTOVOLTAIC (PV) SYSTEM ANALYSIS
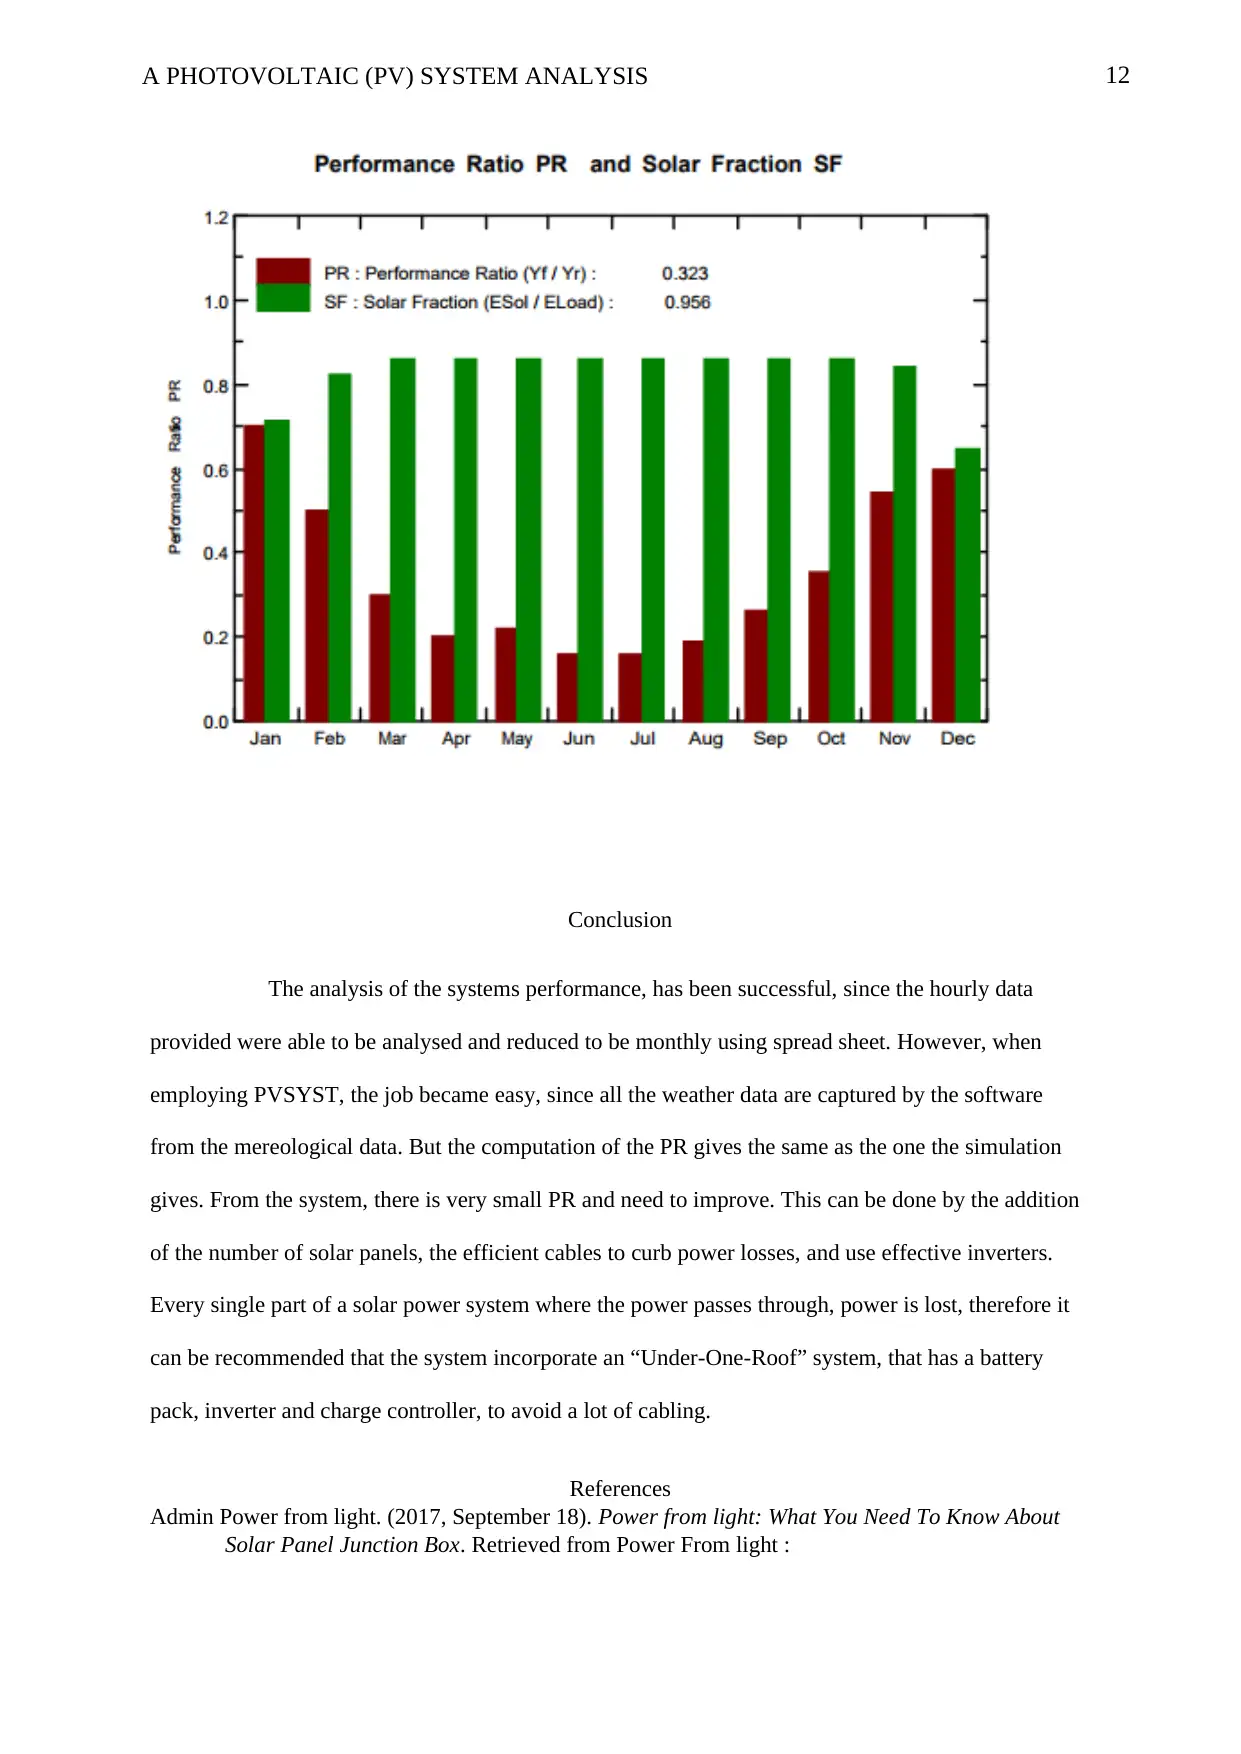
Conclusion
The analysis of the systems performance, has been successful, since the hourly data
provided were able to be analysed and reduced to be monthly using spread sheet. However, when
employing PVSYST, the job became easy, since all the weather data are captured by the software
from the mereological data. But the computation of the PR gives the same as the one the simulation
gives. From the system, there is very small PR and need to improve. This can be done by the addition
of the number of solar panels, the efficient cables to curb power losses, and use effective inverters.
Every single part of a solar power system where the power passes through, power is lost, therefore it
can be recommended that the system incorporate an “Under-One-Roof” system, that has a battery
pack, inverter and charge controller, to avoid a lot of cabling.
References
Admin Power from light. (2017, September 18). Power from light: What You Need To Know About
Solar Panel Junction Box. Retrieved from Power From light :
⊘ This is a preview!⊘
Do you want full access?
Subscribe today to unlock all pages.
Trusted by 1+ million students worldwide
1 out of 13
Related Documents


Your All-in-One AI-Powered Toolkit for Academic Success.
+13062052269
info@desklib.com
Available 24*7 on WhatsApp / Email
![[object Object]](/_next/static/media/star-bottom.7253800d.svg)
Unlock your academic potential
Copyright © 2020–2026 A2Z Services. All Rights Reserved. Developed and managed by ZUCOL.