Television Advertising Campaign: Colgate-Palmolive Media Buy Strategy
VerifiedAdded on 2021/05/31
|8
|2790
|144
Practical Assignment
AI Summary
This assignment focuses on developing a television media buying strategy for Colgate-Palmolive's soap brands in the Calgary market. The student is tasked with creating a TV buy using provided avails, meeting specific criteria such as 125 GRPs weekly, a budget of $48,750, and a P/F ratio of 60/40. The assignment includes constructing the buy in Excel, calculating CPR and CPM, and providing a pre-buy report detailing program choices and rationale. Additionally, the student must write a report on the benefits, strengths, limitations, and future of television as an advertising medium, including an analysis of its effectiveness and sustainability. The assignment requires the application of media buying principles, market analysis, and an understanding of advertising trends and consumer behavior. The student will also need to consider various factors like media fragmentation, population shifts, and the impact of digital media on television advertising.
MEDIA BUYING – 1
TELEVISION BUYING STRATEGY
Your client is Colgate-Palmolive; this buy will be used as part of the AOR for all Soap
brands.
1) Complete the following selective T.V. buy using the attached avails sheet
and the following criteria. You are required to put the packages together to
achieve the stated criteria in the following format using excel. Be sure to
provide a total rtg./audience and cost for each station as well as an overall
cost rtg./audience delivery for the market, including overall CPR and CPM.
Also state a P/F ratio for each station and overall.
You are to buy 125 GRPs weekly in the market of Calgary.
You must use at least two stations.
The weekly budget is $48,750.00 per week.
CPRP=$390.00; W25-54; P/F ratio 60/40.
The campaign length is April 25 x 8 weeks.
Commercial length: 30 seconds.
You may use 1x30 in each ½ hour program, and cannot use more than 2x30’s in
each hour program.
Make note of what is available on the attached avails sheet.
M-F rotations would allow you to use 1 or 2 30’s per day depending on the
length of the program.
All discounts have been applied.
ANSWER – 1
SEE ATTACHED EXCEL SHEET: OID-723030_4000w Media Buying-1 Q-1
2) Once the buy is complete write a pre-buy report for your client. This report
should detail your overall achievement levels as it pertains to the initial
objectives stated above. It should give details on why you chose the
programs you did and what programs you had available to you but decided
not to use and the reasons for this decision.
This pre buy report should be at least one page in length.
ANSWER – 2: Television Pre-Buy Report
Paraphrase This Document
Need a fresh take? Get an instant paraphrase of this document with our AI Paraphraser
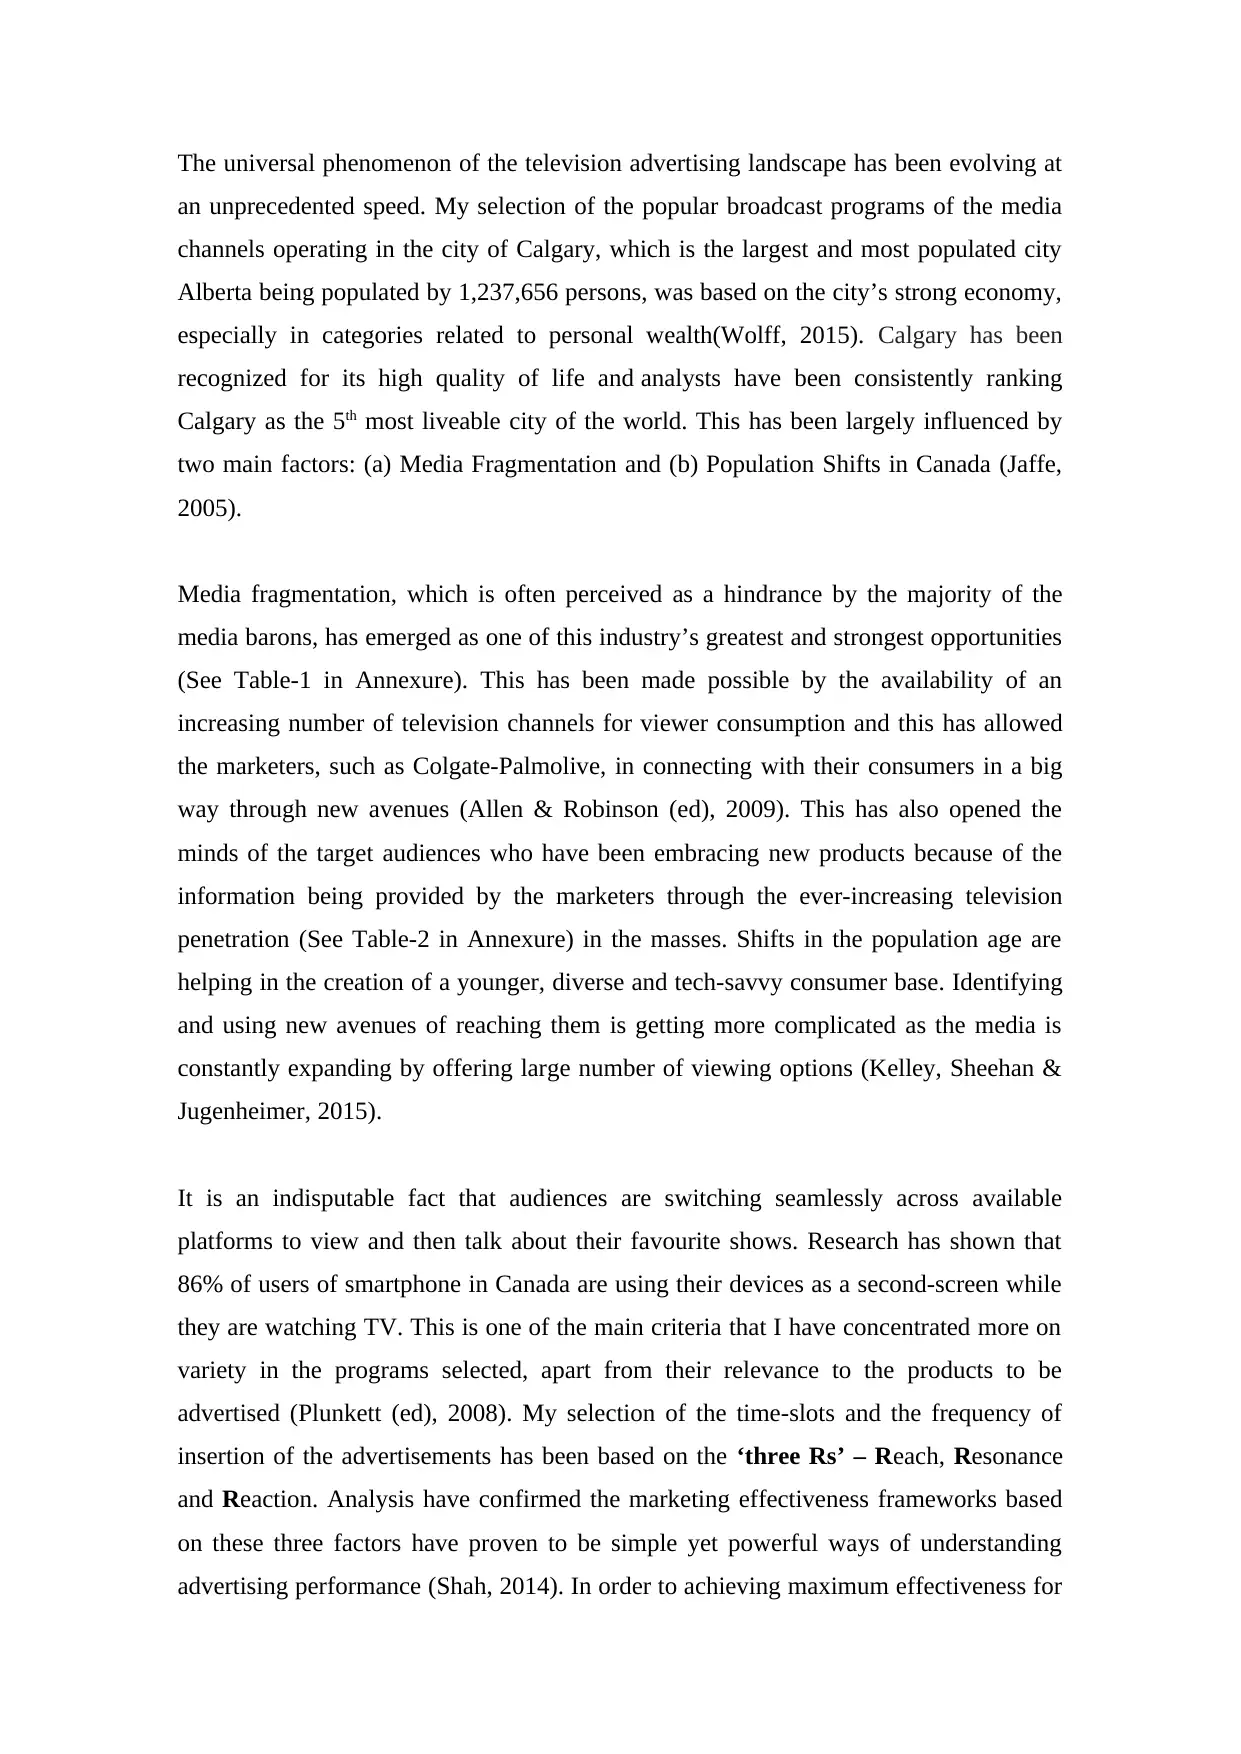
The universal phenomenon of the television advertising landscape has been evolving at
an unprecedented speed. My selection of the popular broadcast programs of the media
channels operating in the city of Calgary, which is the largest and most populated city
Alberta being populated by 1,237,656 persons, was based on the city’s strong economy,
especially in categories related to personal wealth(Wolff, 2015). Calgary has been
recognized for its high quality of life and analysts have been consistently ranking
Calgary as the 5th most liveable city of the world. This has been largely influenced by
two main factors: (a) Media Fragmentation and (b) Population Shifts in Canada (Jaffe,
2005).
Media fragmentation, which is often perceived as a hindrance by the majority of the
media barons, has emerged as one of this industry’s greatest and strongest opportunities
(See Table-1 in Annexure). This has been made possible by the availability of an
increasing number of television channels for viewer consumption and this has allowed
the marketers, such as Colgate-Palmolive, in connecting with their consumers in a big
way through new avenues (Allen & Robinson (ed), 2009). This has also opened the
minds of the target audiences who have been embracing new products because of the
information being provided by the marketers through the ever-increasing television
penetration (See Table-2 in Annexure) in the masses. Shifts in the population age are
helping in the creation of a younger, diverse and tech-savvy consumer base. Identifying
and using new avenues of reaching them is getting more complicated as the media is
constantly expanding by offering large number of viewing options (Kelley, Sheehan &
Jugenheimer, 2015).
It is an indisputable fact that audiences are switching seamlessly across available
platforms to view and then talk about their favourite shows. Research has shown that
86% of users of smartphone in Canada are using their devices as a second-screen while
they are watching TV. This is one of the main criteria that I have concentrated more on
variety in the programs selected, apart from their relevance to the products to be
advertised (Plunkett (ed), 2008). My selection of the time-slots and the frequency of
insertion of the advertisements has been based on the ‘three Rs’ – Reach, Resonance
and Reaction. Analysis have confirmed the marketing effectiveness frameworks based
on these three factors have proven to be simple yet powerful ways of understanding
advertising performance (Shah, 2014). In order to achieving maximum effectiveness for
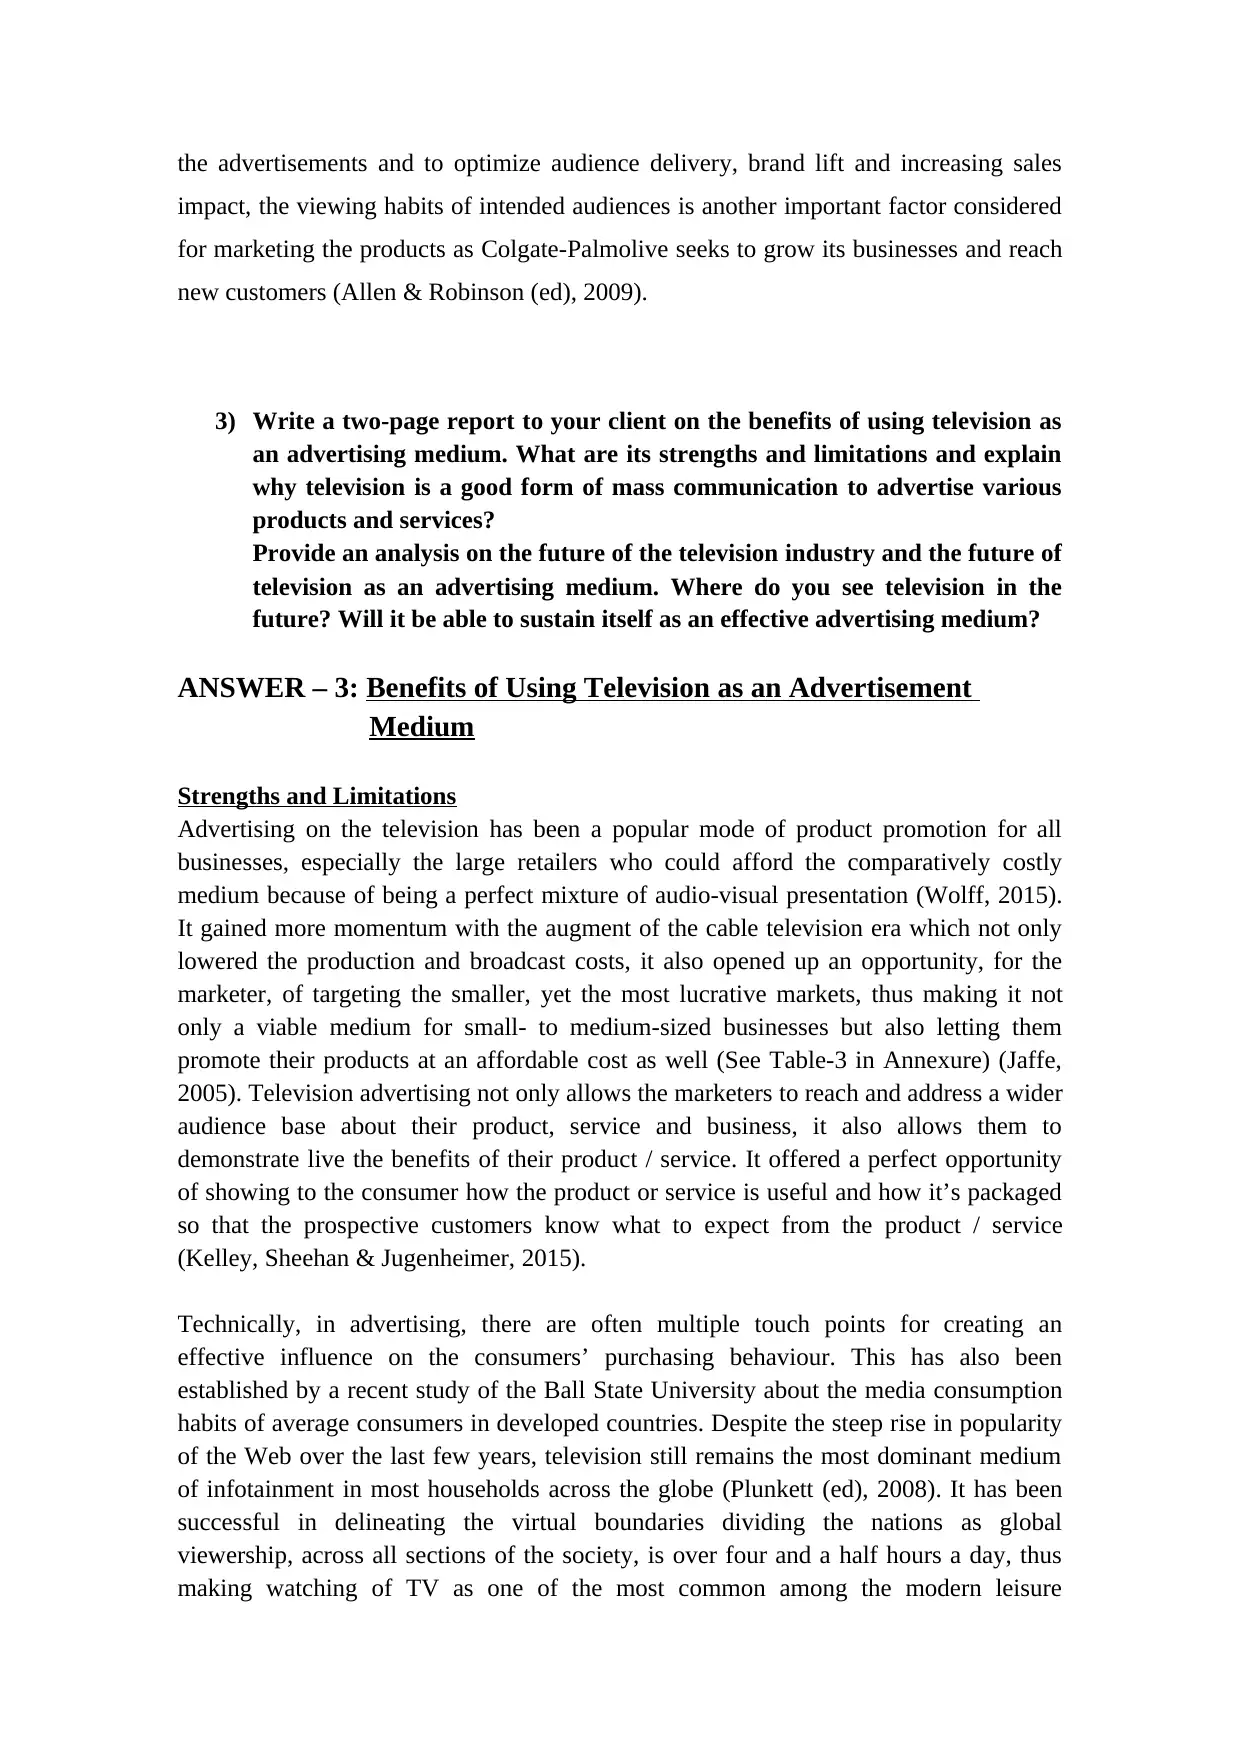
the advertisements and to optimize audience delivery, brand lift and increasing sales
impact, the viewing habits of intended audiences is another important factor considered
for marketing the products as Colgate-Palmolive seeks to grow its businesses and reach
new customers (Allen & Robinson (ed), 2009).
3) Write a two-page report to your client on the benefits of using television as
an advertising medium. What are its strengths and limitations and explain
why television is a good form of mass communication to advertise various
products and services?
Provide an analysis on the future of the television industry and the future of
television as an advertising medium. Where do you see television in the
future? Will it be able to sustain itself as an effective advertising medium?
ANSWER – 3: Benefits of Using Television as an Advertisement
Medium
Strengths and Limitations
Advertising on the television has been a popular mode of product promotion for all
businesses, especially the large retailers who could afford the comparatively costly
medium because of being a perfect mixture of audio-visual presentation (Wolff, 2015).
It gained more momentum with the augment of the cable television era which not only
lowered the production and broadcast costs, it also opened up an opportunity, for the
marketer, of targeting the smaller, yet the most lucrative markets, thus making it not
only a viable medium for small- to medium-sized businesses but also letting them
promote their products at an affordable cost as well (See Table-3 in Annexure) (Jaffe,
2005). Television advertising not only allows the marketers to reach and address a wider
audience base about their product, service and business, it also allows them to
demonstrate live the benefits of their product / service. It offered a perfect opportunity
of showing to the consumer how the product or service is useful and how it’s packaged
so that the prospective customers know what to expect from the product / service
(Kelley, Sheehan & Jugenheimer, 2015).
Technically, in advertising, there are often multiple touch points for creating an
effective influence on the consumers’ purchasing behaviour. This has also been
established by a recent study of the Ball State University about the media consumption
habits of average consumers in developed countries. Despite the steep rise in popularity
of the Web over the last few years, television still remains the most dominant medium
of infotainment in most households across the globe (Plunkett (ed), 2008). It has been
successful in delineating the virtual boundaries dividing the nations as global
viewership, across all sections of the society, is over four and a half hours a day, thus
making watching of TV as one of the most common among the modern leisure
⊘ This is a preview!⊘
Do you want full access?
Subscribe today to unlock all pages.
Trusted by 1+ million students worldwide
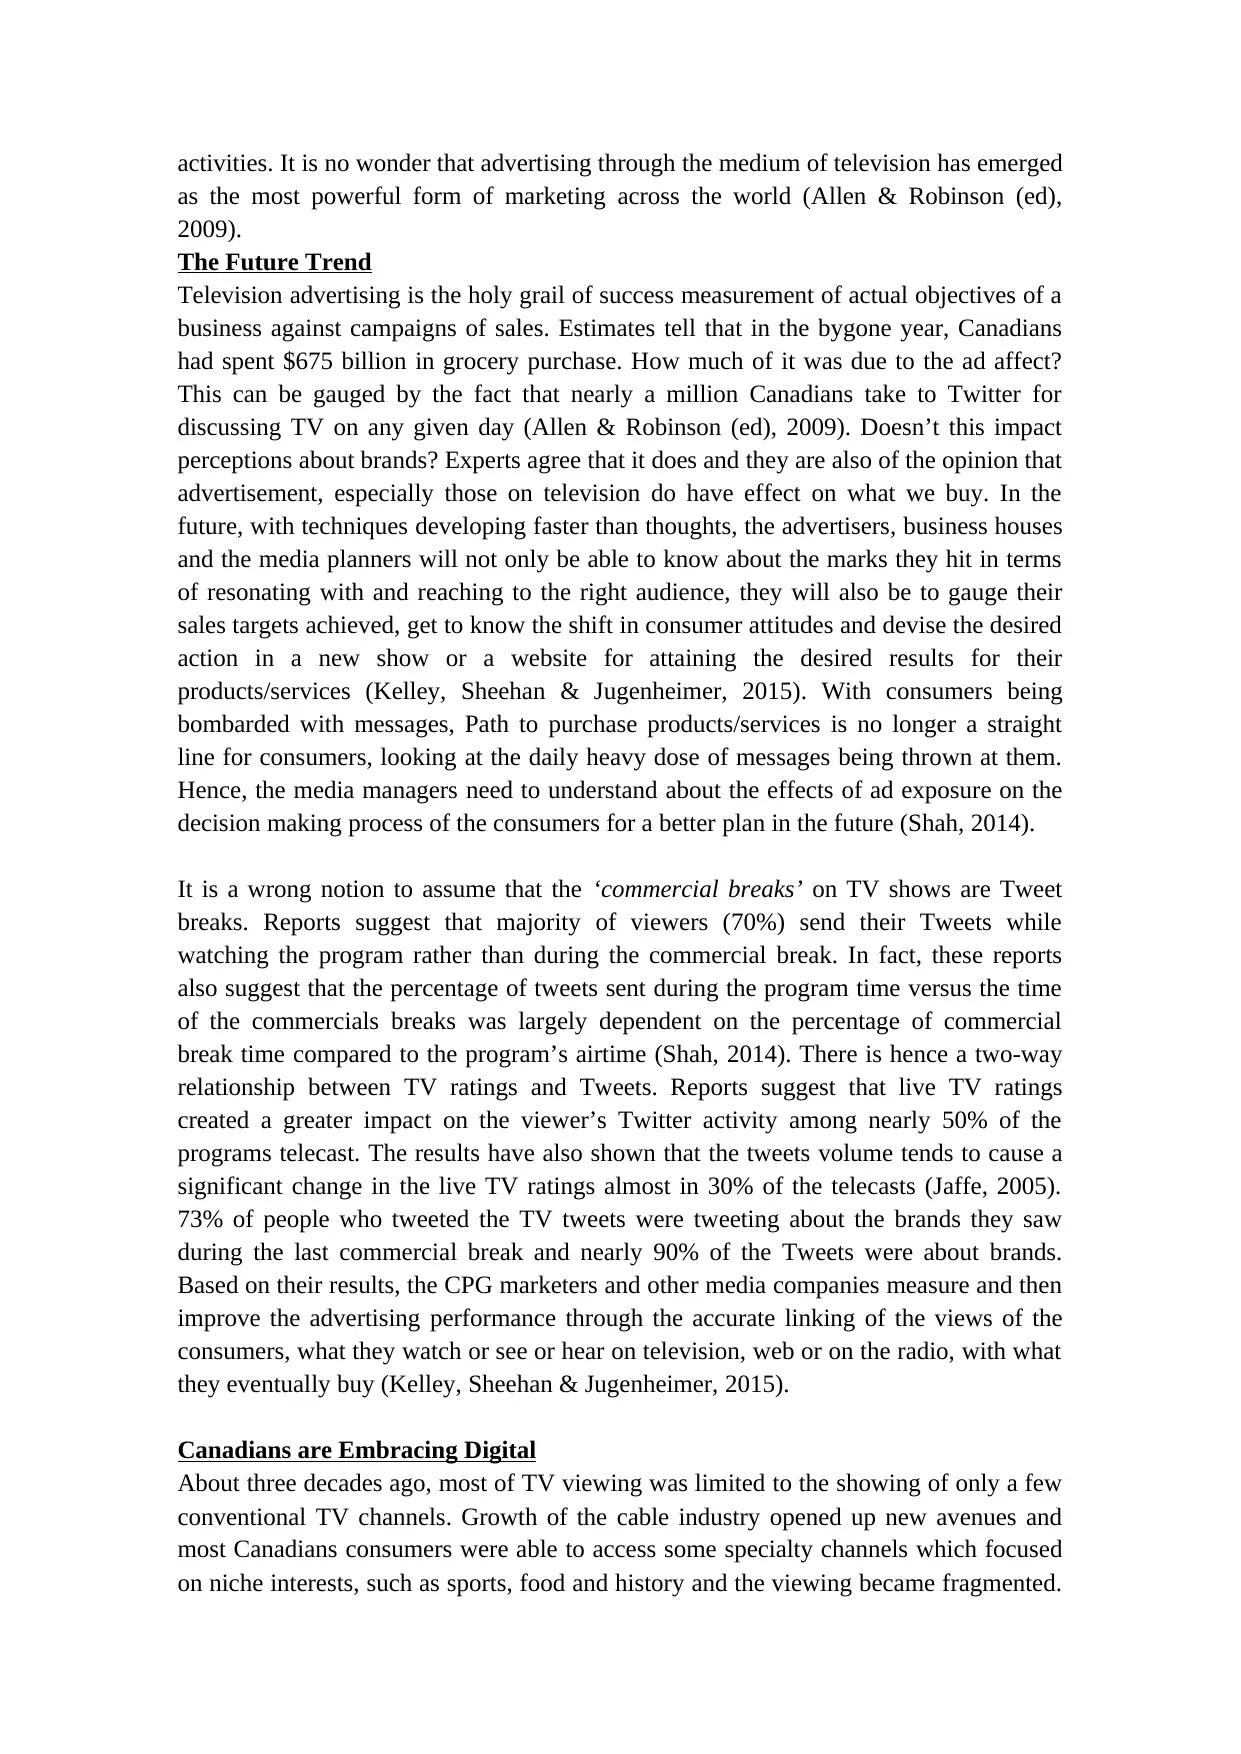
activities. It is no wonder that advertising through the medium of television has emerged
as the most powerful form of marketing across the world (Allen & Robinson (ed),
2009).
The Future Trend
Television advertising is the holy grail of success measurement of actual objectives of a
business against campaigns of sales. Estimates tell that in the bygone year, Canadians
had spent $675 billion in grocery purchase. How much of it was due to the ad affect?
This can be gauged by the fact that nearly a million Canadians take to Twitter for
discussing TV on any given day (Allen & Robinson (ed), 2009). Doesn’t this impact
perceptions about brands? Experts agree that it does and they are also of the opinion that
advertisement, especially those on television do have effect on what we buy. In the
future, with techniques developing faster than thoughts, the advertisers, business houses
and the media planners will not only be able to know about the marks they hit in terms
of resonating with and reaching to the right audience, they will also be to gauge their
sales targets achieved, get to know the shift in consumer attitudes and devise the desired
action in a new show or a website for attaining the desired results for their
products/services (Kelley, Sheehan & Jugenheimer, 2015). With consumers being
bombarded with messages, Path to purchase products/services is no longer a straight
line for consumers, looking at the daily heavy dose of messages being thrown at them.
Hence, the media managers need to understand about the effects of ad exposure on the
decision making process of the consumers for a better plan in the future (Shah, 2014).
It is a wrong notion to assume that the ‘commercial breaks’ on TV shows are Tweet
breaks. Reports suggest that majority of viewers (70%) send their Tweets while
watching the program rather than during the commercial break. In fact, these reports
also suggest that the percentage of tweets sent during the program time versus the time
of the commercials breaks was largely dependent on the percentage of commercial
break time compared to the program’s airtime (Shah, 2014). There is hence a two-way
relationship between TV ratings and Tweets. Reports suggest that live TV ratings
created a greater impact on the viewer’s Twitter activity among nearly 50% of the
programs telecast. The results have also shown that the tweets volume tends to cause a
significant change in the live TV ratings almost in 30% of the telecasts (Jaffe, 2005).
73% of people who tweeted the TV tweets were tweeting about the brands they saw
during the last commercial break and nearly 90% of the Tweets were about brands.
Based on their results, the CPG marketers and other media companies measure and then
improve the advertising performance through the accurate linking of the views of the
consumers, what they watch or see or hear on television, web or on the radio, with what
they eventually buy (Kelley, Sheehan & Jugenheimer, 2015).
Canadians are Embracing Digital
About three decades ago, most of TV viewing was limited to the showing of only a few
conventional TV channels. Growth of the cable industry opened up new avenues and
most Canadians consumers were able to access some specialty channels which focused
on niche interests, such as sports, food and history and the viewing became fragmented.
Paraphrase This Document
Need a fresh take? Get an instant paraphrase of this document with our AI Paraphraser
But in the current context, in this new era of personal TV, the viewing pattern has
changed very significantly: now it is on-demand, being split across devices and is been
personalized through recommendations (Allen & Robinson (ed), 2009). Latest
technology including the ‘Recommendation Engines’ is instrumental in increasing the
exposure of the consumers to new and emerging shows and videos which the consumers
prefer watching. This technology also lets the consumer control what they want to
watch and what they do not want to watch (Allen & Robinson (ed), 2009). But the
abundance of the content and the available platforms makes it difficult for the
consumers to find what they want. This proves tiresome in some cases when a particular
content may be left in obscurity unless it can be made discoverable. In this context,
Canada lacks in a standard measurement system across-platforms, presently estimated
measuring of viewing of the personalized TV is possible for about 1 in 10 of total TV
viewing hours. But adoption of personalized TV cannot be the same for all, results show
that young adults in English-speaking regions watch more personalized TV than the
older generations and those living in the French-speaking regions (Plunkett (ed), 2008).
Short is Meaningful
Trend in TV advertising has so far been for slots of 60 and 30 second ad spots. A 60
second ad spot usually costs double of a 30 second ad spot. But the emerging trend is of
15 second ad spots which cost nearly 65% less than a 30 second ad spot. This can make
the budget of the marketers go a long way, hence it is recommended that media planners
suggest a mix of 30 and 15 second ad spots to their clients. The purpose of the 30
second ad spot should be to get across the message of the product/service, whereas the
15 second ad spot should be used for serving as a reminder of those products/services
(Wolff, 2015).
LIST OF REFERENCES
Allen, G. and Robinson, D.J. (ed). 2009. Communicating in Canada's Past: Essays in
Media History. Toronto: University of Toronto Press.
Jaffe, J. 2005. Life after the 30-Second Spot. Hoboken, NJ: John Wiley & Sons.
Kelley, L., Sheehan, K. and Jugenheimer, D.W. 2015. Advertising Media Planning: A
Brand Management Approach. 4th ed. Oxon: Routledge.
Plunkett, J.W. (ed). 2008. Plunkett's Advertising & Branding Industry Almanac 2008.
Houston: Plunkett Research, Ltd.
Shah, K. 2014. Advertising and Integrated Marketing Communications. New Delhi:
Tata McGraw-Hill Education.
Wolff, M. 2015. Television Is the New Television: The Unexpected Triumph of Old
Media in the Digital Age. New York: Penguin.
ANNEXURE
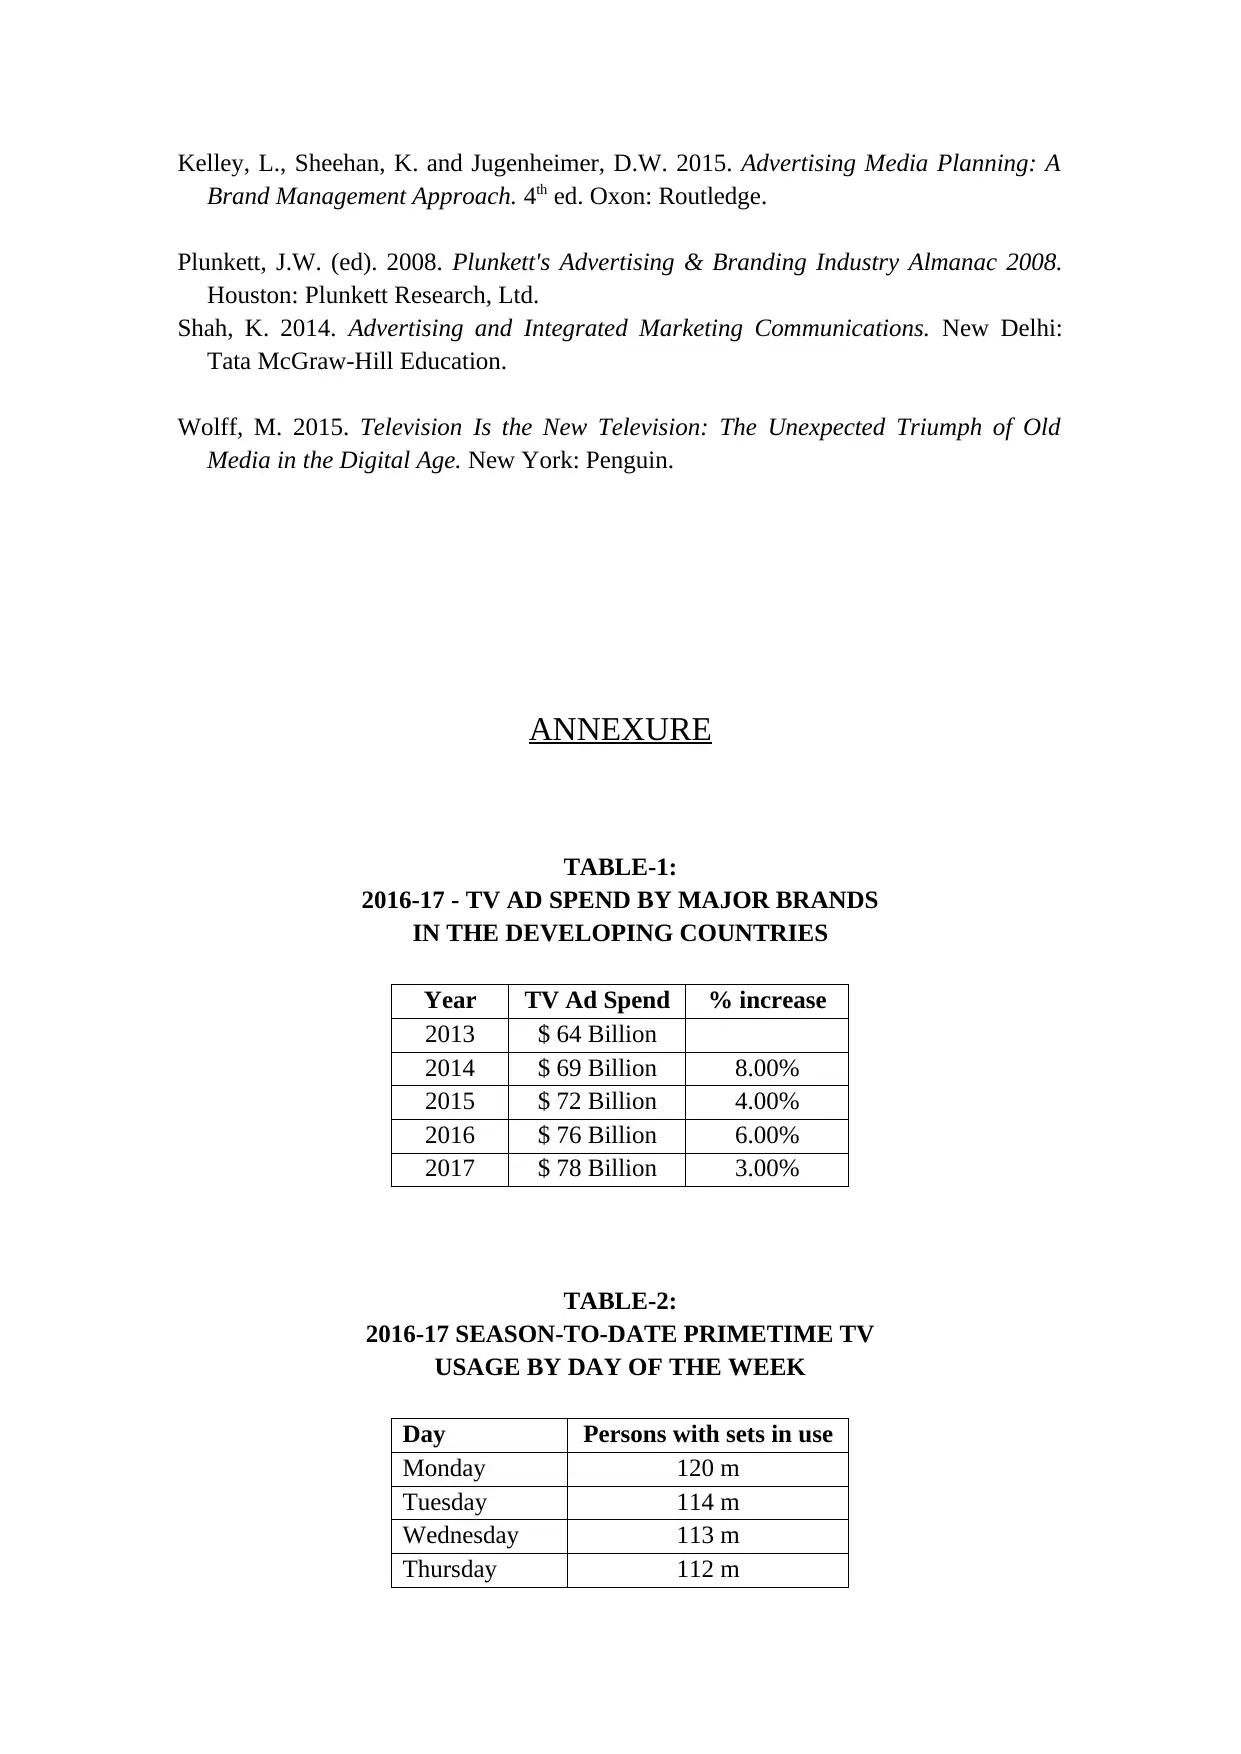
TABLE-1:
2016-17 - TV AD SPEND BY MAJOR BRANDS
IN THE DEVELOPING COUNTRIES
Year TV Ad Spend % increase
2013 $ 64 Billion
2014 $ 69 Billion 8.00%
2015 $ 72 Billion 4.00%
2016 $ 76 Billion 6.00%
2017 $ 78 Billion 3.00%
TABLE-2:
2016-17 SEASON-TO-DATE PRIMETIME TV
USAGE BY DAY OF THE WEEK
Day Persons with sets in use
Monday 120 m
Tuesday 114 m
Wednesday 113 m
Thursday 112 m
Brand Management Approach. 4th ed. Oxon: Routledge.
Plunkett, J.W. (ed). 2008. Plunkett's Advertising & Branding Industry Almanac 2008.
Houston: Plunkett Research, Ltd.
Shah, K. 2014. Advertising and Integrated Marketing Communications. New Delhi:
Tata McGraw-Hill Education.
Wolff, M. 2015. Television Is the New Television: The Unexpected Triumph of Old
Media in the Digital Age. New York: Penguin.
ANNEXURE
TABLE-1:
2016-17 - TV AD SPEND BY MAJOR BRANDS
IN THE DEVELOPING COUNTRIES
Year TV Ad Spend % increase
2013 $ 64 Billion
2014 $ 69 Billion 8.00%
2015 $ 72 Billion 4.00%
2016 $ 76 Billion 6.00%
2017 $ 78 Billion 3.00%
TABLE-2:
2016-17 SEASON-TO-DATE PRIMETIME TV
USAGE BY DAY OF THE WEEK
Day Persons with sets in use
Monday 120 m
Tuesday 114 m
Wednesday 113 m
Thursday 112 m
⊘ This is a preview!⊘
Do you want full access?
Subscribe today to unlock all pages.
Trusted by 1+ million students worldwide
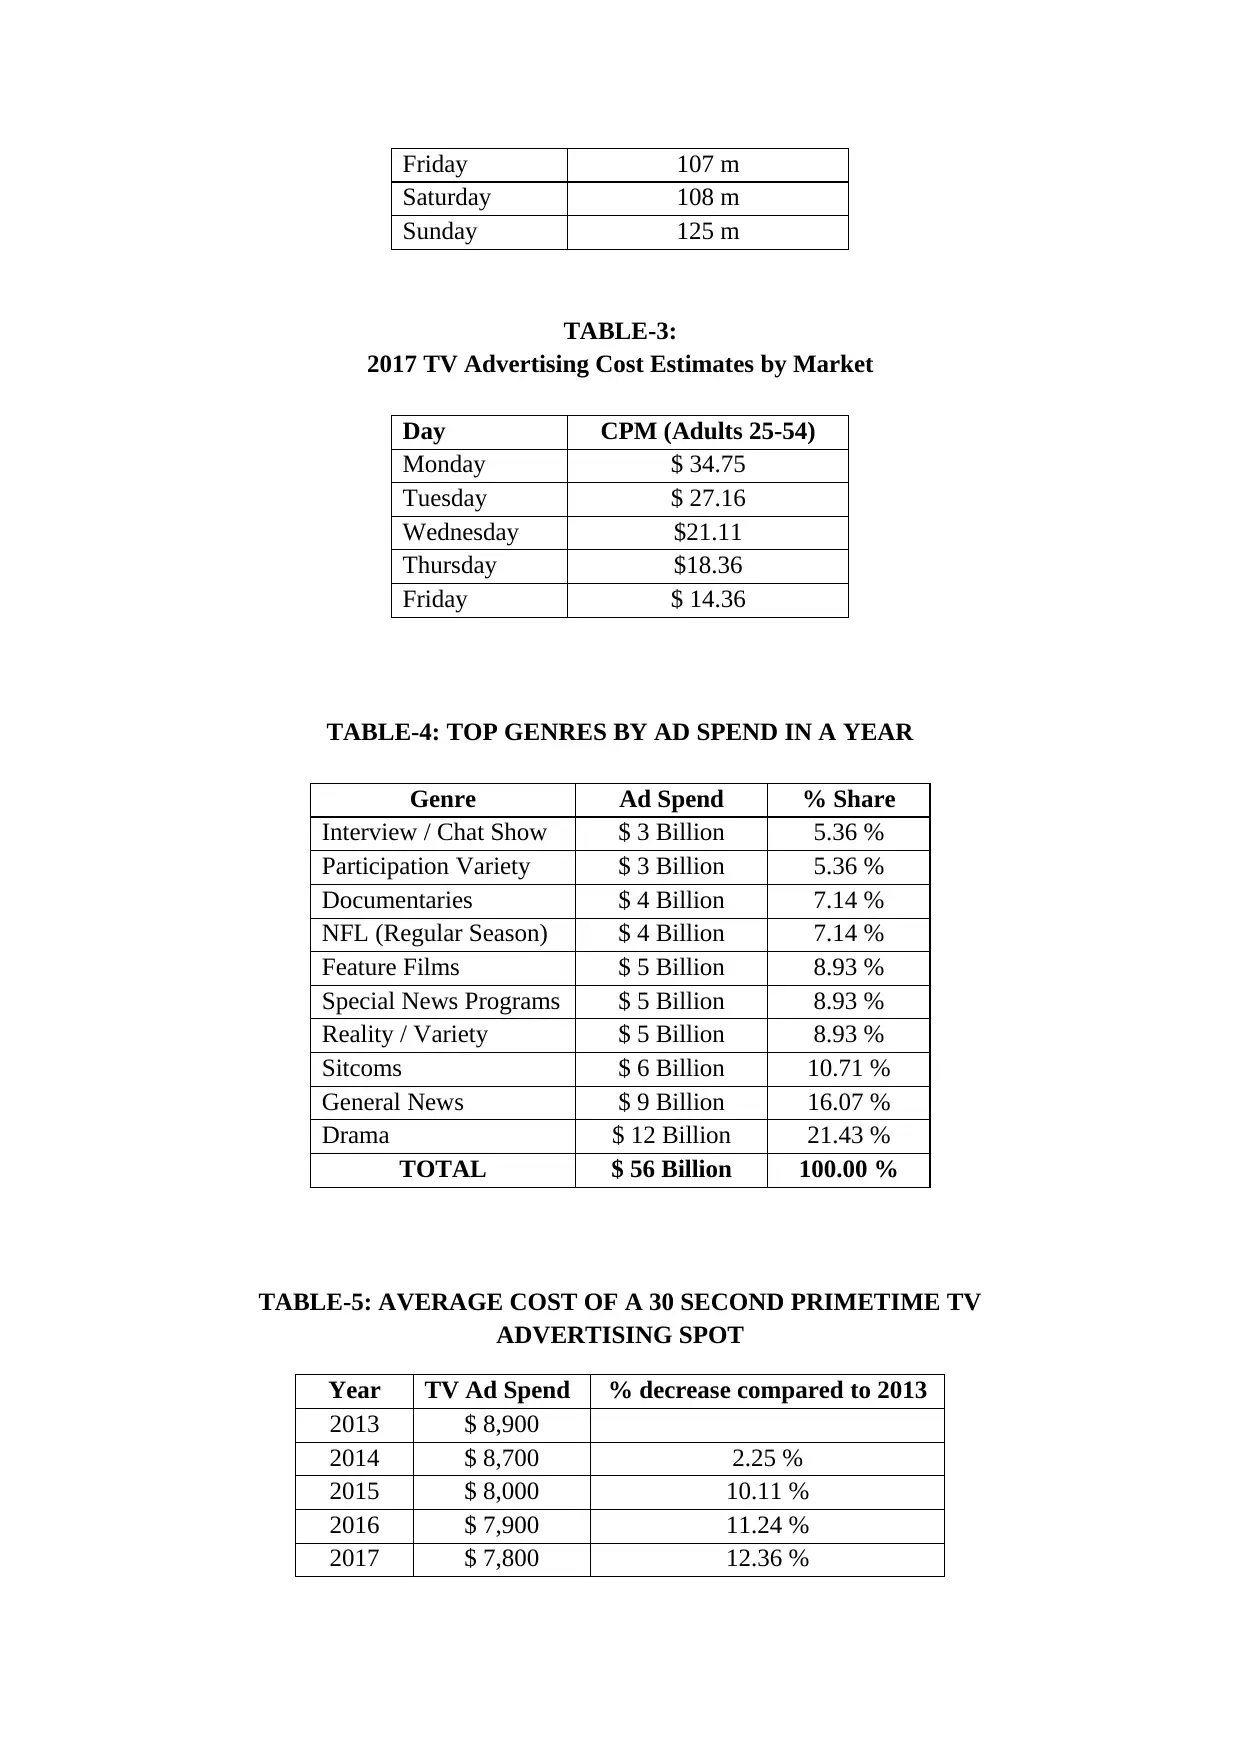
Friday 107 m
Saturday 108 m
Sunday 125 m
TABLE-3:
2017 TV Advertising Cost Estimates by Market
Day CPM (Adults 25-54)
Monday $ 34.75
Tuesday $ 27.16
Wednesday $21.11
Thursday $18.36
Friday $ 14.36
TABLE-4: TOP GENRES BY AD SPEND IN A YEAR
Genre Ad Spend % Share
Interview / Chat Show $ 3 Billion 5.36 %
Participation Variety $ 3 Billion 5.36 %
Documentaries $ 4 Billion 7.14 %
NFL (Regular Season) $ 4 Billion 7.14 %
Feature Films $ 5 Billion 8.93 %
Special News Programs $ 5 Billion 8.93 %
Reality / Variety $ 5 Billion 8.93 %
Sitcoms $ 6 Billion 10.71 %
General News $ 9 Billion 16.07 %
Drama $ 12 Billion 21.43 %
TOTAL $ 56 Billion 100.00 %
TABLE-5: AVERAGE COST OF A 30 SECOND PRIMETIME TV
ADVERTISING SPOT
Year TV Ad Spend % decrease compared to 2013
2013 $ 8,900
2014 $ 8,700 2.25 %
2015 $ 8,000 10.11 %
2016 $ 7,900 11.24 %
2017 $ 7,800 12.36 %
Paraphrase This Document
Need a fresh take? Get an instant paraphrase of this document with our AI Paraphraser
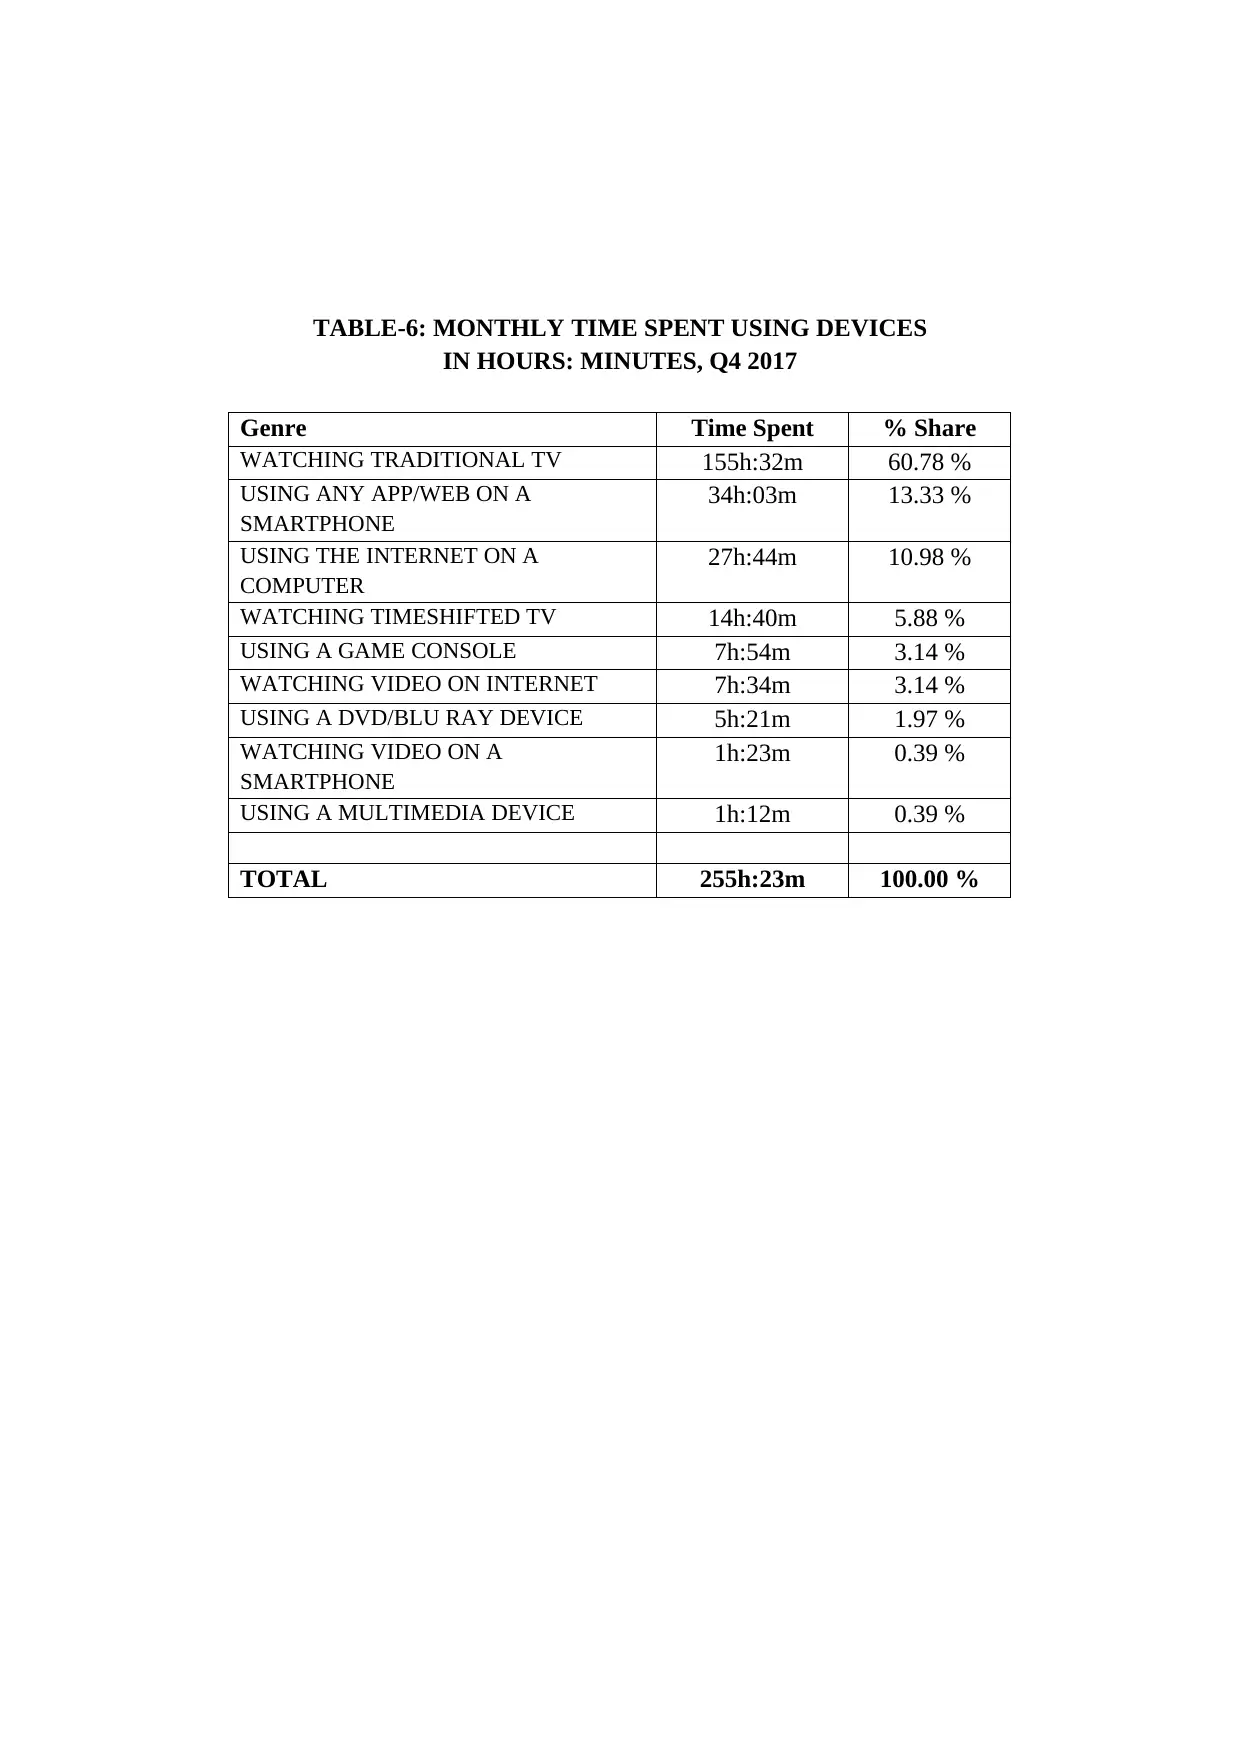
TABLE-6: MONTHLY TIME SPENT USING DEVICES
IN HOURS: MINUTES, Q4 2017
Genre Time Spent % Share
WATCHING TRADITIONAL TV 155h:32m 60.78 %
USING ANY APP/WEB ON A
SMARTPHONE
34h:03m 13.33 %
USING THE INTERNET ON A
COMPUTER
27h:44m 10.98 %
WATCHING TIMESHIFTED TV 14h:40m 5.88 %
USING A GAME CONSOLE 7h:54m 3.14 %
WATCHING VIDEO ON INTERNET 7h:34m 3.14 %
USING A DVD/BLU RAY DEVICE 5h:21m 1.97 %
WATCHING VIDEO ON A
SMARTPHONE
1h:23m 0.39 %
USING A MULTIMEDIA DEVICE 1h:12m 0.39 %
TOTAL 255h:23m 100.00 %
1 out of 8
Your All-in-One AI-Powered Toolkit for Academic Success.
+13062052269
info@desklib.com
Available 24*7 on WhatsApp / Email
![[object Object]](/_next/static/media/star-bottom.7253800d.svg)
Unlock your academic potential
Copyright © 2020–2026 A2Z Services. All Rights Reserved. Developed and managed by ZUCOL.