Statistics Assignment: Evaluating Median and Mean in Central Tendency

Verified

Added on  2022/10/11

|6
|878
|11
Homework Assignment
AI Summary
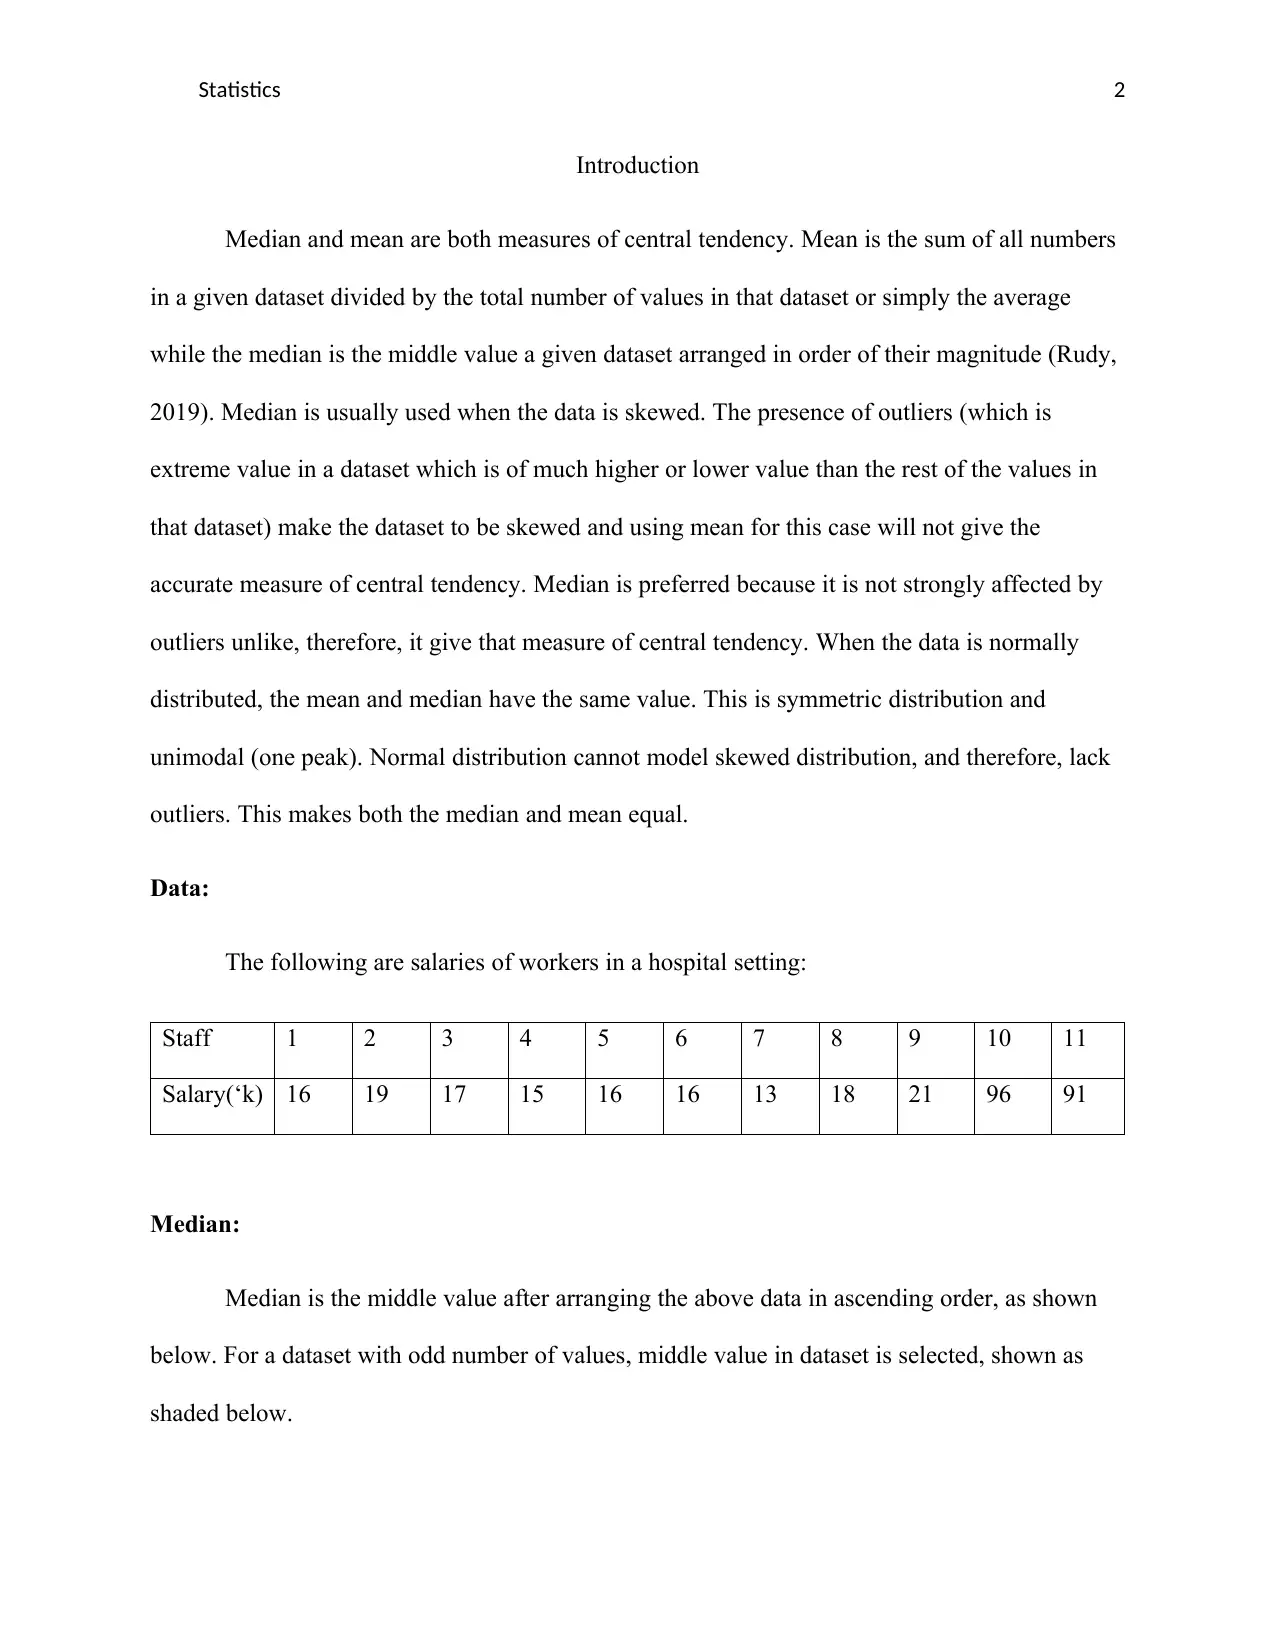
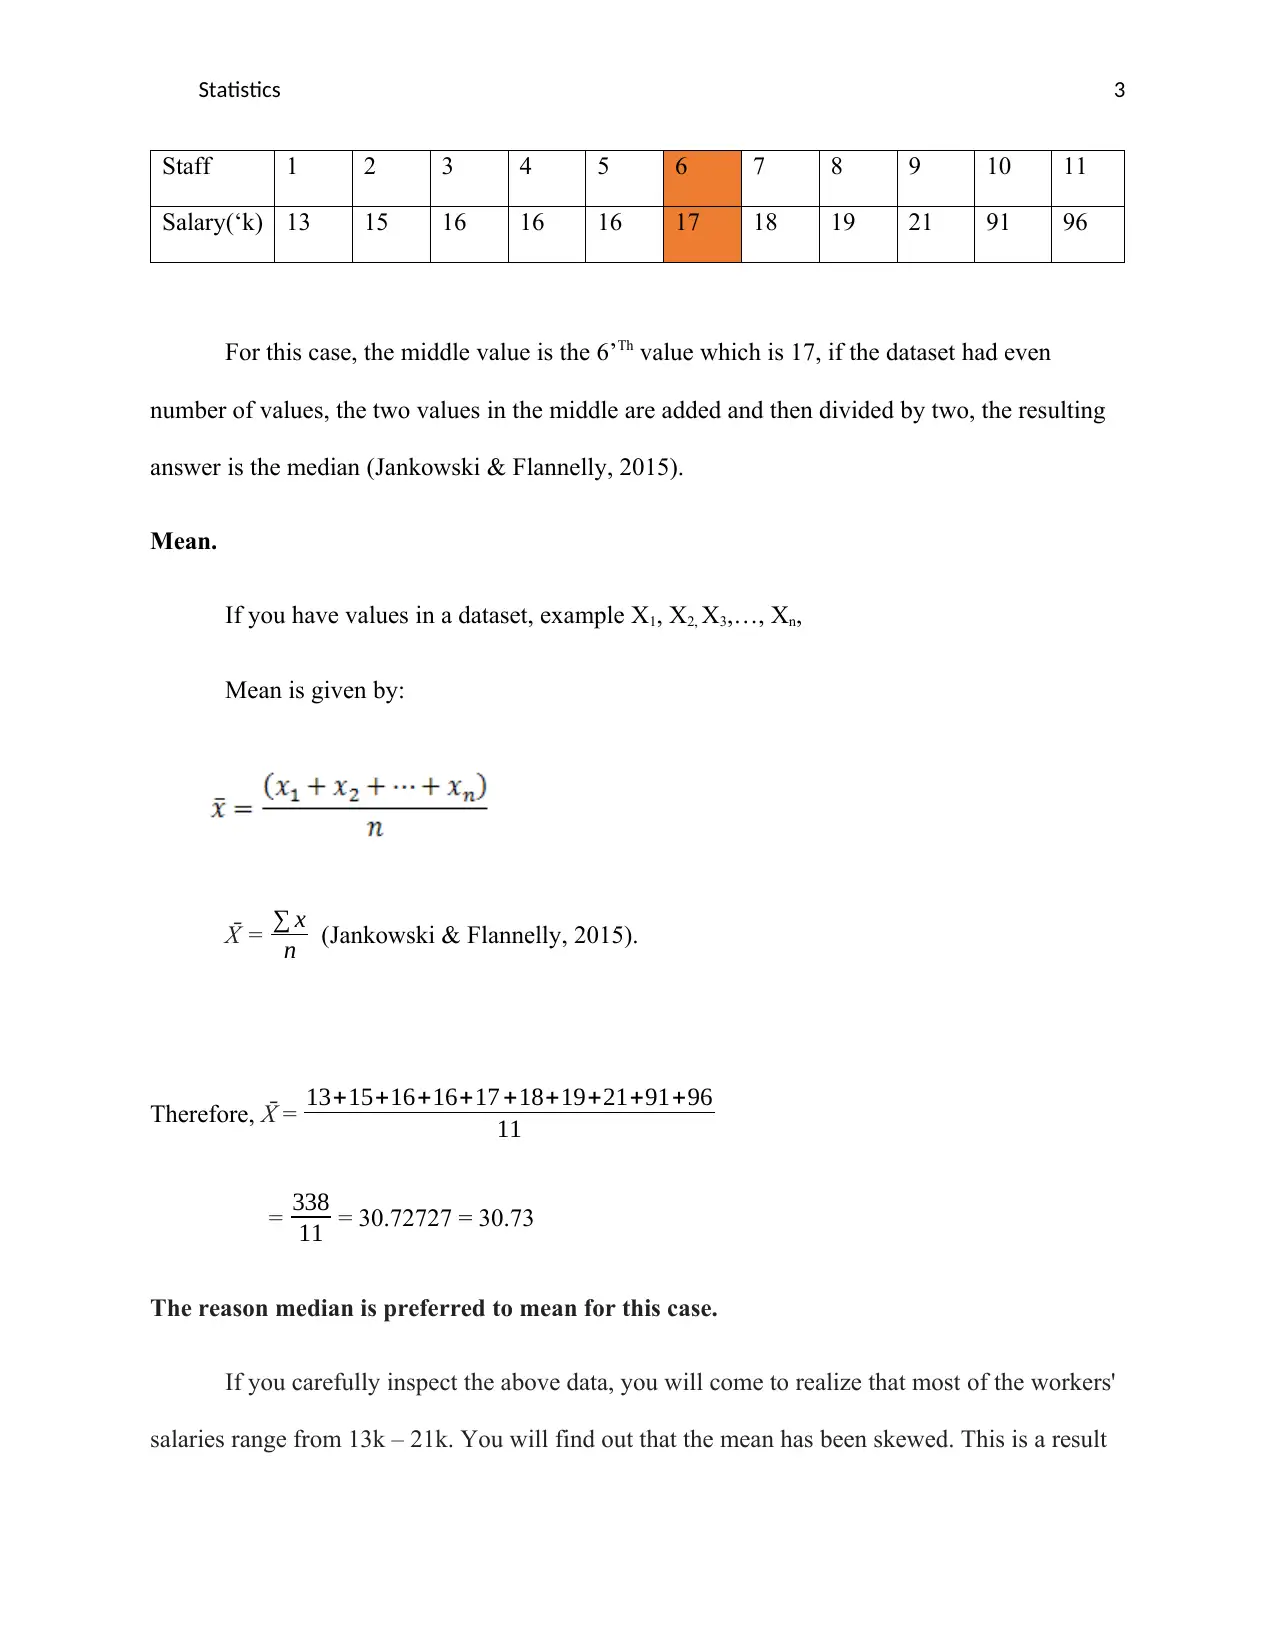
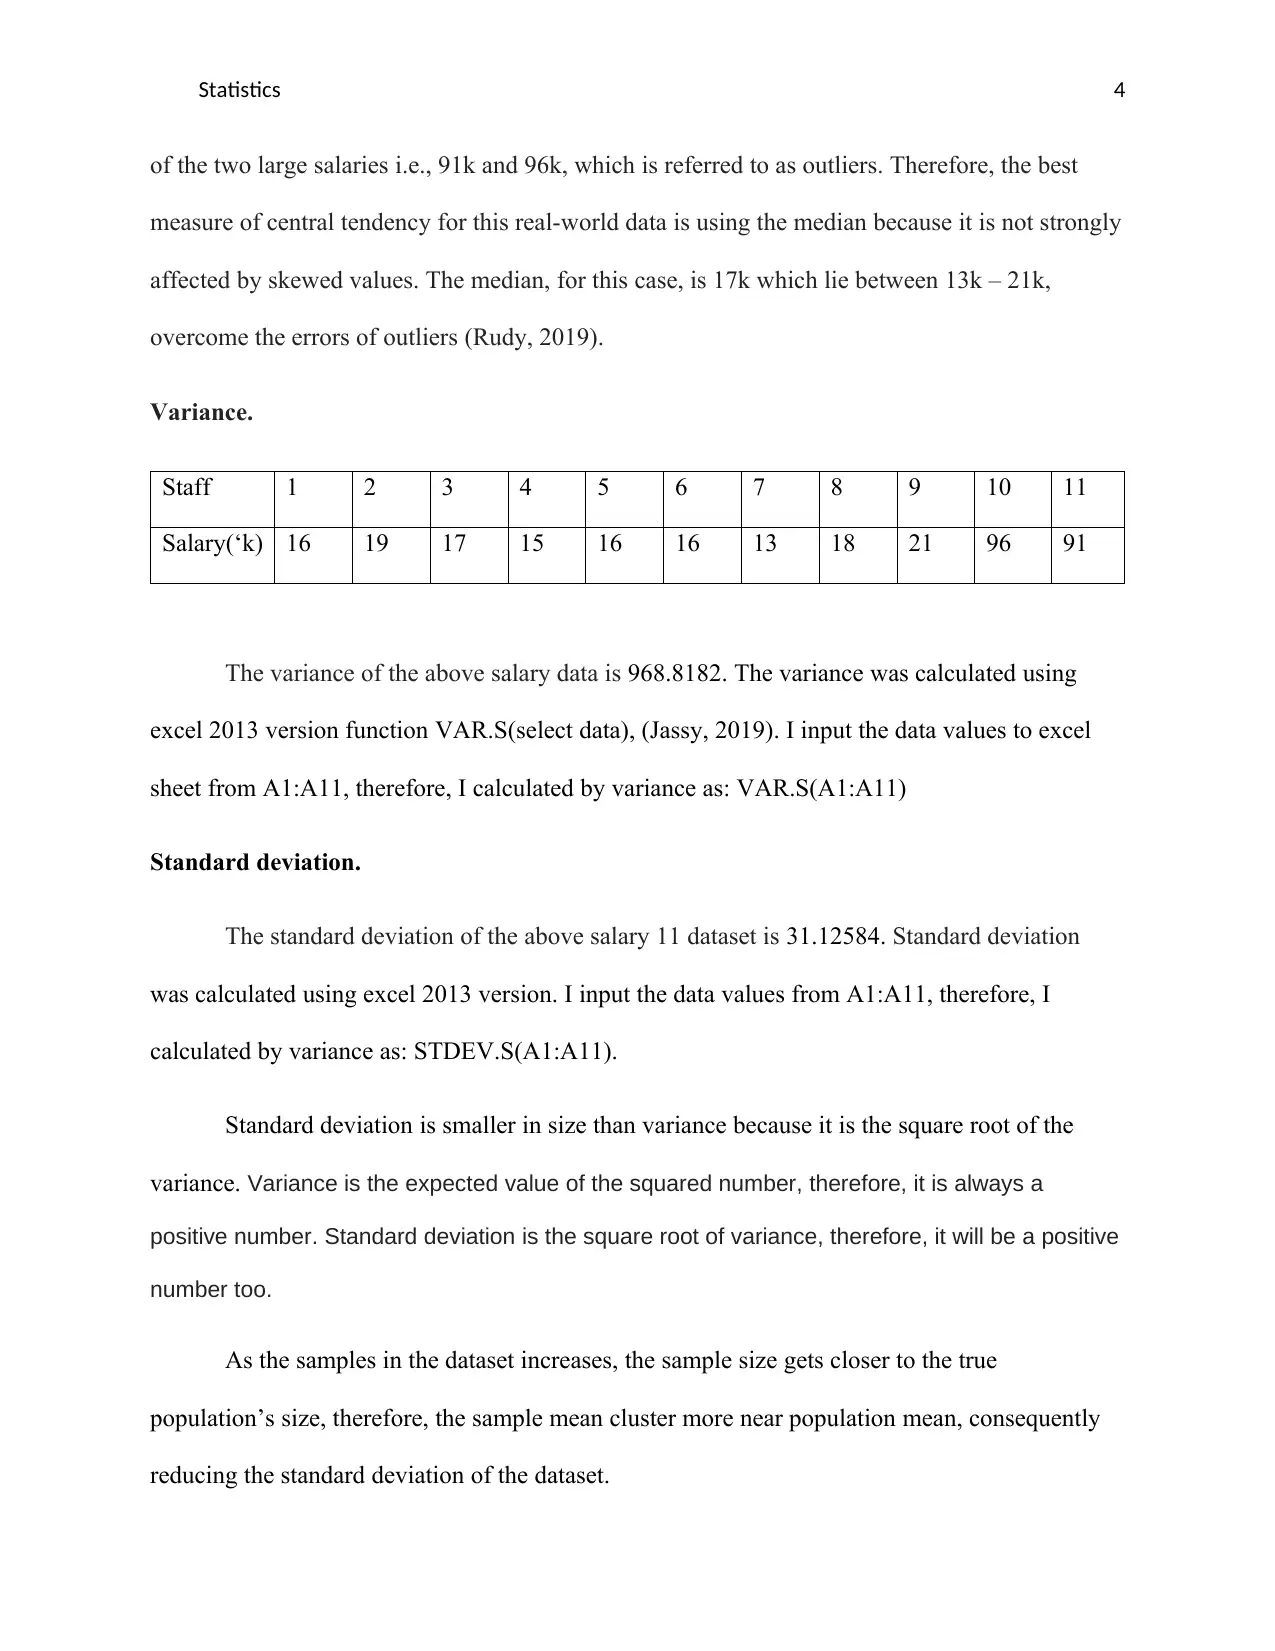
This statistics assignment explores the preference of the median over the mean as a measure of central tendency, particularly in the presence of skewed data and outliers. The introduction defines the mean as the average and the median as the middle value in a dataset. The assignment highlights that the median is preferred when data is skewed due to outliers, which are extreme values that significantly impact the mean. A real-world example using hospital worker salaries is provided, demonstrating how outliers (high salaries) skew the mean, making the median a more accurate representation of central tendency. The median is calculated and preferred because it is not strongly affected by skewed values. Variance and standard deviation are also calculated, further illustrating the statistical concepts. The document references relevant sources to support the analysis.
Document Page
Running Head: Statistics 1
Preference of Median to Mean as Measure of Central Tendency.
Student Name
School Affiliation
Date
tabler-icon-diamond-filled.svg

Secure Best Marks with AI Grader

Need help grading? Try our AI Grader for instant feedback on your assignments.
Document Page
Statistics 2
Introduction
Median and mean are both measures of central tendency. Mean is the sum of all numbers
in a given dataset divided by the total number of values in that dataset or simply the average
while the median is the middle value a given dataset arranged in order of their magnitude (Rudy,
2019). Median is usually used when the data is skewed. The presence of outliers (which is
extreme value in a dataset which is of much higher or lower value than the rest of the values in
that dataset) make the dataset to be skewed and using mean for this case will not give the
accurate measure of central tendency. Median is preferred because it is not strongly affected by
outliers unlike, therefore, it give that measure of central tendency. When the data is normally
distributed, the mean and median have the same value. This is symmetric distribution and
unimodal (one peak). Normal distribution cannot model skewed distribution, and therefore, lack
outliers. This makes both the median and mean equal.
Data:
The following are salaries of workers in a hospital setting:
Staff 1 2 3 4 5 6 7 8 9 10 11
Salary(‘k) 16 19 17 15 16 16 13 18 21 96 91
Median:
Median is the middle value after arranging the above data in ascending order, as shown
below. For a dataset with odd number of values, middle value in dataset is selected, shown as
shaded below.
Document Page
Statistics 3
Staff 1 2 3 4 5 6 7 8 9 10 11
Salary(‘k) 13 15 16 16 16 17 18 19 21 91 96
For this case, the middle value is the 6’Th value which is 17, if the dataset had even
number of values, the two values in the middle are added and then divided by two, the resulting
answer is the median (Jankowski & Flannelly, 2015).
Mean.
If you have values in a dataset, example X1, X2, X3,…, Xn,
Mean is given by:
X̄ = x
n (Jankowski & Flannelly, 2015).
Therefore, = 13+15+16+16+17 +18+19+21+91+96
11
= 338
11 = 30.72727 = 30.73
The reason median is preferred to mean for this case.
If you carefully inspect the above data, you will come to realize that most of the workers'
salaries range from 13k – 21k. You will find out that the mean has been skewed. This is a result
Document Page
Statistics 4
of the two large salaries i.e., 91k and 96k, which is referred to as outliers. Therefore, the best
measure of central tendency for this real-world data is using the median because it is not strongly
affected by skewed values. The median, for this case, is 17k which lie between 13k – 21k,
overcome the errors of outliers (Rudy, 2019).
Variance.
Staff 1 2 3 4 5 6 7 8 9 10 11
Salary(‘k) 16 19 17 15 16 16 13 18 21 96 91
The variance of the above salary data is 968.8182. The variance was calculated using
excel 2013 version function VAR.S(select data), (Jassy, 2019). I input the data values to excel
sheet from A1:A11, therefore, I calculated by variance as: VAR.S(A1:A11)
Standard deviation.
The standard deviation of the above salary 11 dataset is 31.12584. Standard deviation
was calculated using excel 2013 version. I input the data values from A1:A11, therefore, I
calculated by variance as: STDEV.S(A1:A11).
Standard deviation is smaller in size than variance because it is the square root of the
variance. Variance is the expected value of the squared number, therefore, it is always a
positive number. Standard deviation is the square root of variance, therefore, it will be a positive
number too.
As the samples in the dataset increases, the sample size gets closer to the true
population’s size, therefore, the sample mean cluster more near population mean, consequently
reducing the standard deviation of the dataset.
tabler-icon-diamond-filled.svg

Secure Best Marks with AI Grader

Need help grading? Try our AI Grader for instant feedback on your assignments.
Document Page
Statistics 5
Document Page
Statistics 6
References.
Rudy, B. (2019). Defining the Difference Between Average and Median Salary | Salary.com.
Retrieved 24 September 2019, from https://www.salary.com/blog/defining-the-
difference-between-average-and-median-salary/
Jassy, D. (2019). How do you calculate variance in Excel?. Retrieved 24 September 2019, from
https://www.investopedia.com/ask/answers/041615/how-do-you-calculate-variance-
excel.asp
Jankowski, K., & Flannelly, K. (2015). Measures of Central Tendency in Chaplaincy, Health
Care, and Related Research. Journal Of Health Care Chaplaincy, 21(1), 39-49. doi:
10.1080/08854726.2014.989799
chevron_up_icon
1 out of 6
circle_padding
hide_on_mobile
zoom_out_icon
logo.png

Your All-in-One AI-Powered Toolkit for Academic Success.

Available 24*7 on WhatsApp / Email

[object Object]