HC2091 Finance for Business: Medibank Pvt Ltd Financial Report
VerifiedAdded on 2023/04/25
|19
|4807
|329
Report
AI Summary
This report conducts a financial assessment of Medibank Pvt Ltd, analyzing its financial condition through profitability, liquidity, and market value ratios. It examines the company's share price movement relative to the All Ordinaries Share Index, calculates the cost of equity using the company's beta, and analyzes the capital structure by assessing debt and equity exposure. The analysis uses financial statements from 2017 and 2018 to evaluate trends and provide insights into the company's financial performance for potential investors, considering key financial ratios and benchmarks. The report concludes with recommendations based on the financial analysis.
Running head: FINANCE FOR BUSINESS
Medibank Pvt Ltd
Name of the Student:
Name of the University:
Author’s Note:
Medibank Pvt Ltd
Name of the Student:
Name of the University:
Author’s Note:
Paraphrase This Document
Need a fresh take? Get an instant paraphrase of this document with our AI Paraphraser
2FINANCE FOR BUSINESS
Executive Summary
The aim of the assignment is to conduct a financial assessment of the Medibank Pvt Ltd and
assess the financial condition of the company in various aspects of the company. The
financial analysis of the company was conducted by taking the profitability, liquidity and
market value ratio for the company. The share price analysis of the company in respect to the
benchmark index of the company was also analysed for the company. The cost of equity for
the company was calculated by deriving the beta of the company. The capital structure of the
company was also analysed for the company by taking the exposure of debt and equity
exposure into account for the company.
3FINANCE FOR BUSINESS
Table of Contents
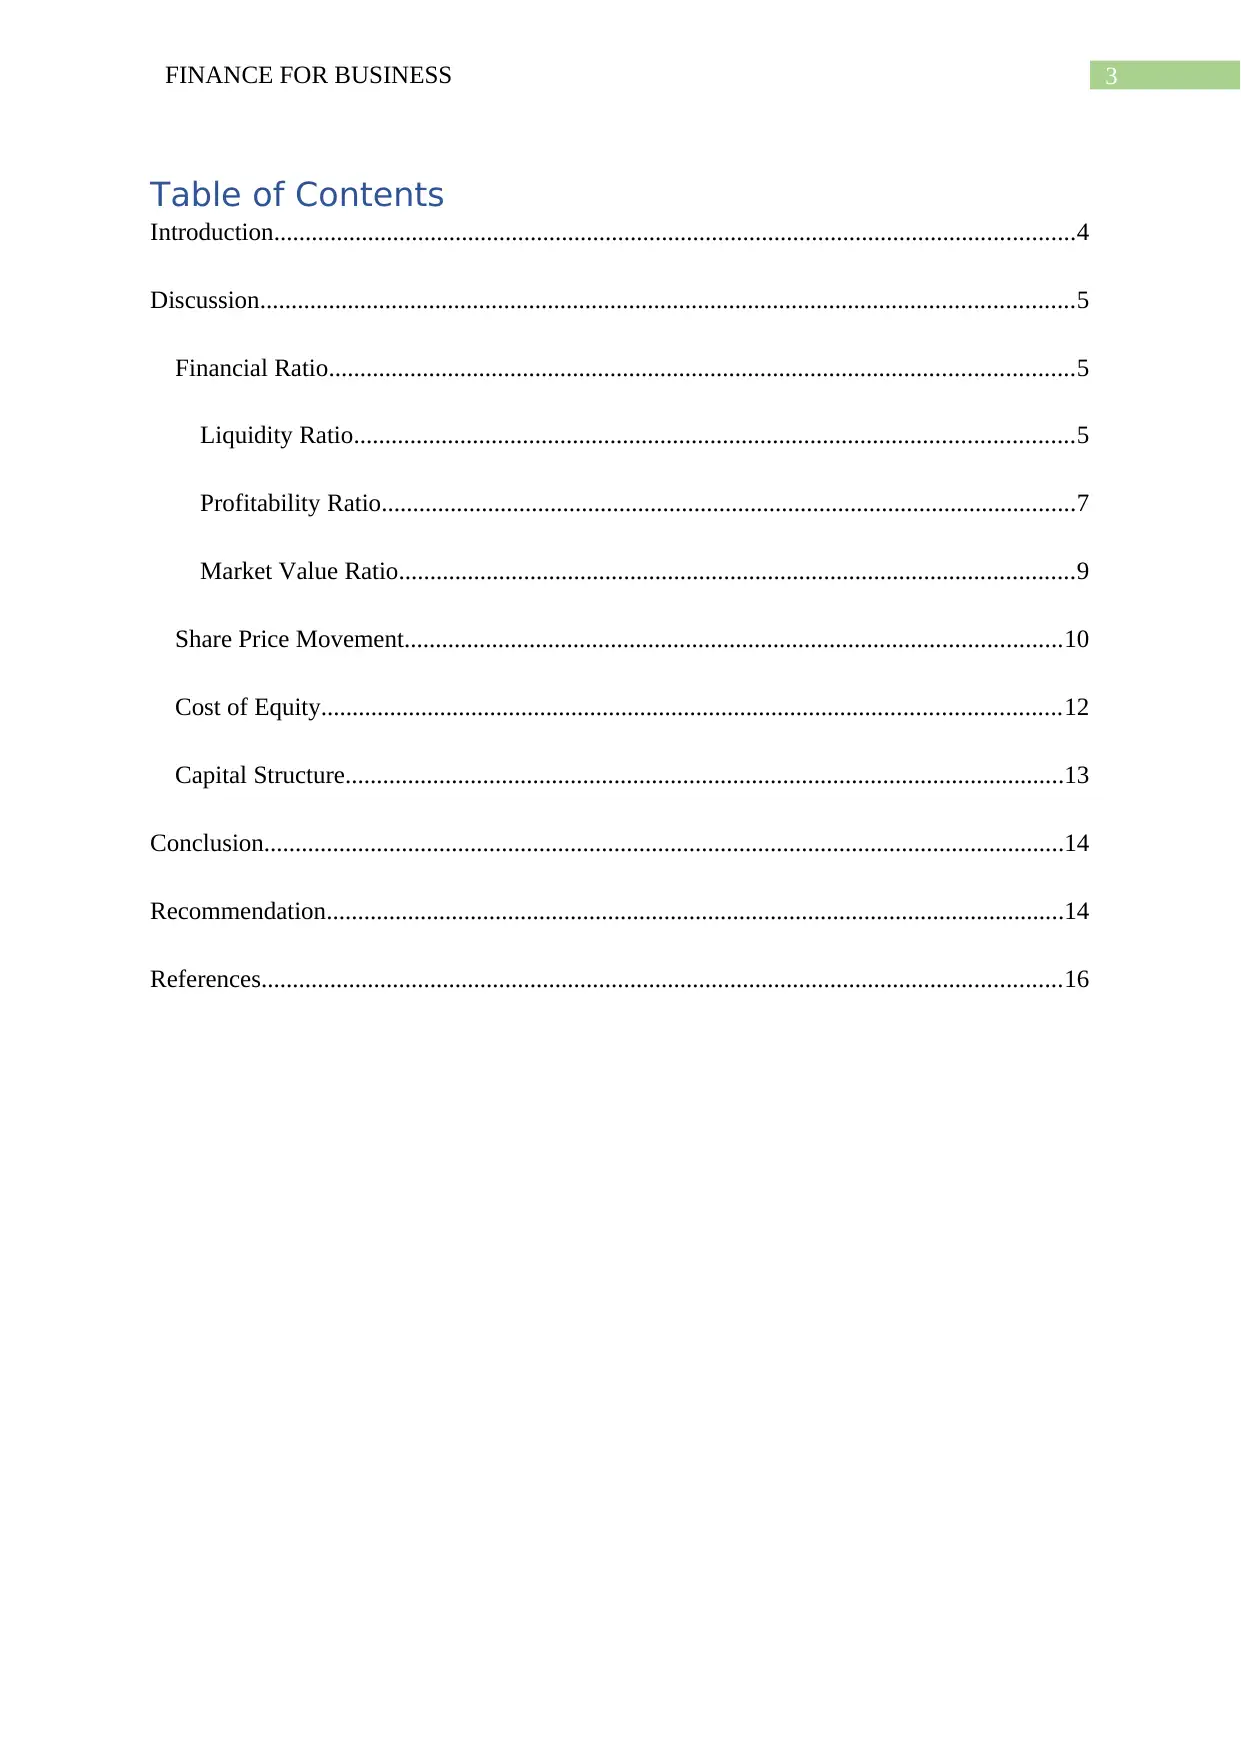
Introduction................................................................................................................................4
Discussion..................................................................................................................................5
Financial Ratio.......................................................................................................................5
Liquidity Ratio...................................................................................................................5
Profitability Ratio...............................................................................................................7
Market Value Ratio............................................................................................................9
Share Price Movement.........................................................................................................10
Cost of Equity......................................................................................................................12
Capital Structure...................................................................................................................13
Conclusion................................................................................................................................14
Recommendation......................................................................................................................14
References................................................................................................................................16
Table of Contents
Introduction................................................................................................................................4
Discussion..................................................................................................................................5
Financial Ratio.......................................................................................................................5
Liquidity Ratio...................................................................................................................5
Profitability Ratio...............................................................................................................7
Market Value Ratio............................................................................................................9
Share Price Movement.........................................................................................................10
Cost of Equity......................................................................................................................12
Capital Structure...................................................................................................................13
Conclusion................................................................................................................................14
Recommendation......................................................................................................................14
References................................................................................................................................16
⊘ This is a preview!⊘
Do you want full access?
Subscribe today to unlock all pages.
Trusted by 1+ million students worldwide
4FINANCE FOR BUSINESS
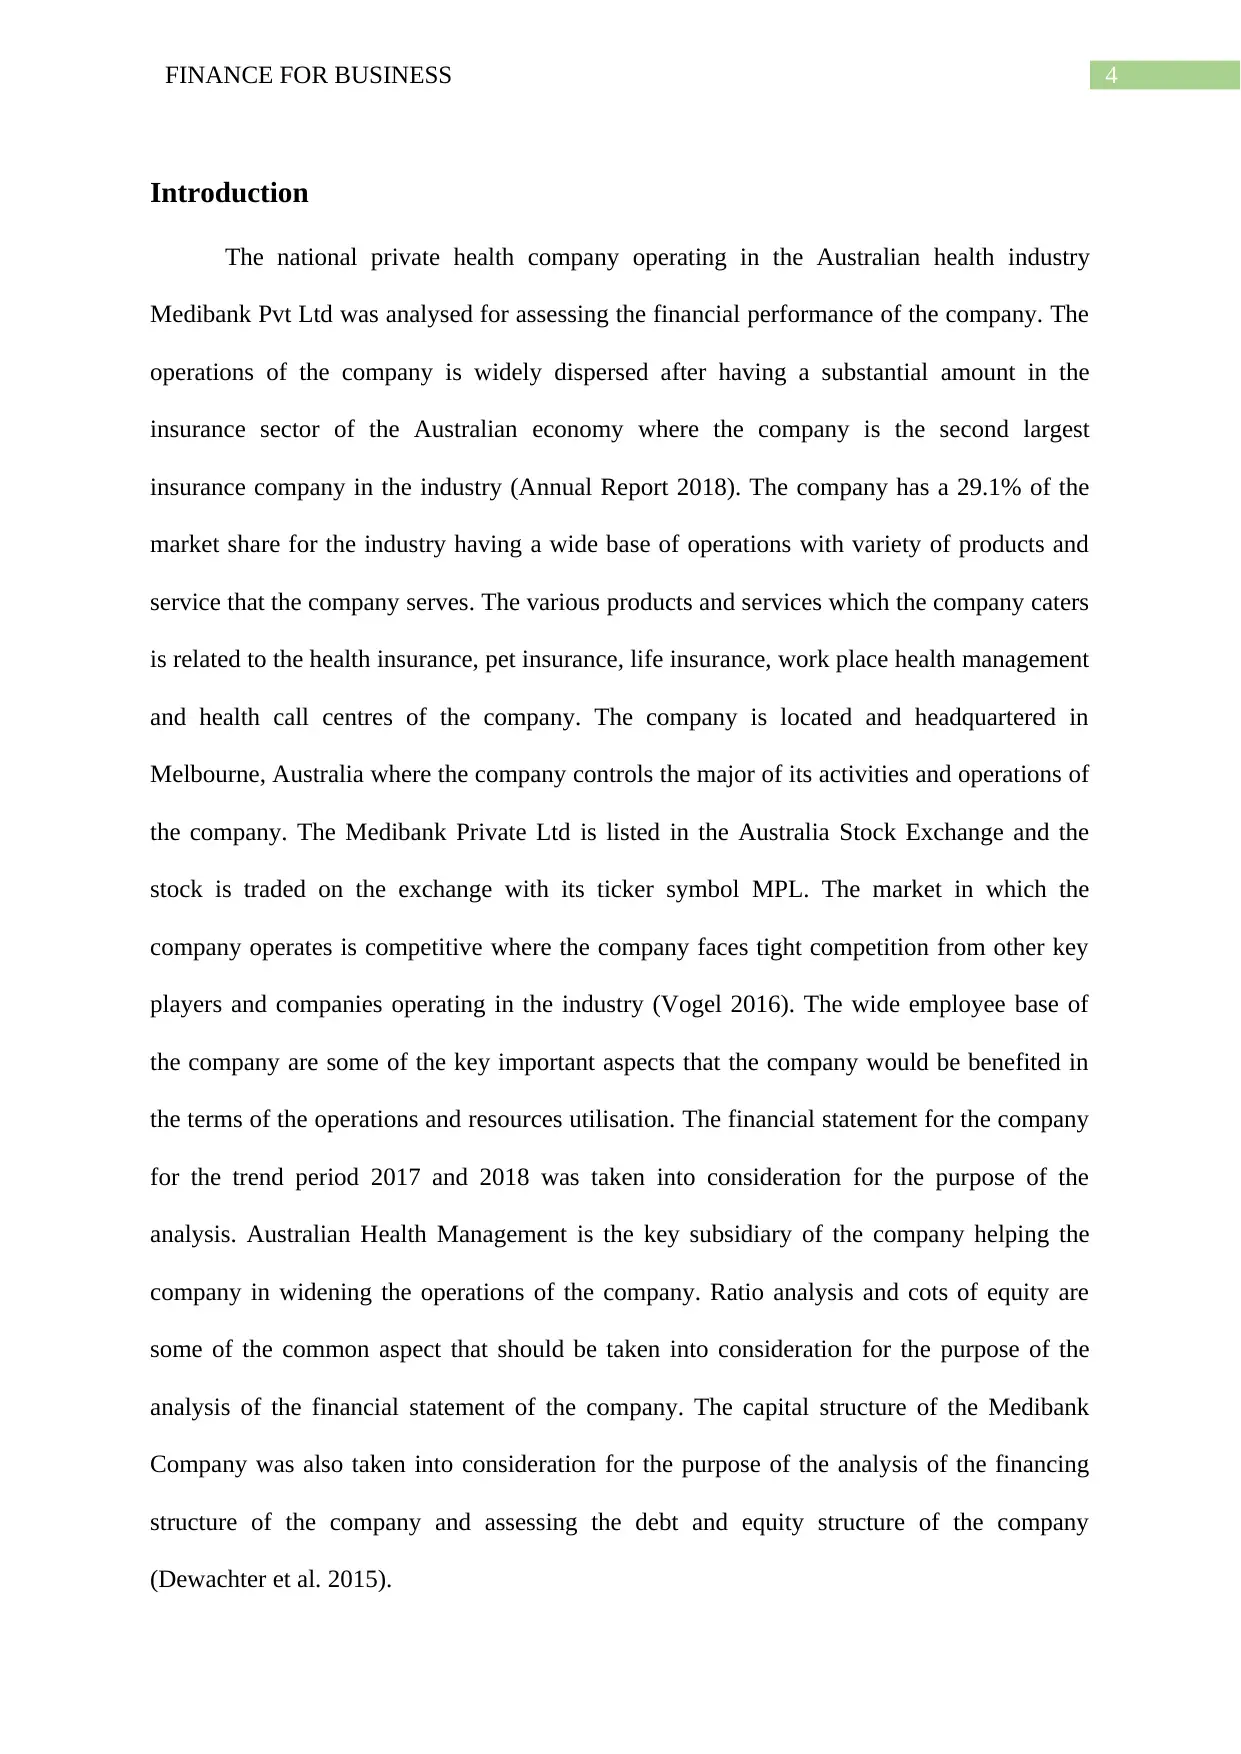
Introduction
The national private health company operating in the Australian health industry
Medibank Pvt Ltd was analysed for assessing the financial performance of the company. The
operations of the company is widely dispersed after having a substantial amount in the
insurance sector of the Australian economy where the company is the second largest
insurance company in the industry (Annual Report 2018). The company has a 29.1% of the
market share for the industry having a wide base of operations with variety of products and
service that the company serves. The various products and services which the company caters
is related to the health insurance, pet insurance, life insurance, work place health management
and health call centres of the company. The company is located and headquartered in
Melbourne, Australia where the company controls the major of its activities and operations of
the company. The Medibank Private Ltd is listed in the Australia Stock Exchange and the
stock is traded on the exchange with its ticker symbol MPL. The market in which the
company operates is competitive where the company faces tight competition from other key
players and companies operating in the industry (Vogel 2016). The wide employee base of
the company are some of the key important aspects that the company would be benefited in
the terms of the operations and resources utilisation. The financial statement for the company
for the trend period 2017 and 2018 was taken into consideration for the purpose of the
analysis. Australian Health Management is the key subsidiary of the company helping the
company in widening the operations of the company. Ratio analysis and cots of equity are
some of the common aspect that should be taken into consideration for the purpose of the
analysis of the financial statement of the company. The capital structure of the Medibank
Company was also taken into consideration for the purpose of the analysis of the financing
structure of the company and assessing the debt and equity structure of the company
(Dewachter et al. 2015).
Paraphrase This Document
Need a fresh take? Get an instant paraphrase of this document with our AI Paraphraser
5FINANCE FOR BUSINESS
Discussion
Financial Ratio
The financial analysis of the Medibank Pvt Ltd was evaluated for identifying the trend
followed by the company in terms of the operations of the company. The financial ratio for
the company has been taken into consideration for the purpose of the analysis of the financial
performance of the company in the trend period 2017-18. The various aspect of the financial
condition of the company was taken into consideration for the purpose of the analysis of the
company. The relevant ratio’s that were analysed for the company was in the field of
liquidity, profitability and market value ratios for the company (Cucchiella, D’Adamo and
Gastaldi 2015). The financial ratio for the company was assessed thereby assessing the
various aspects of the company so that the overall financial position of the company can be
undertaken for the investor for the purpose of investment decision.
Liquidity Ratio
The liquidity ratio for the company was assessed for evaluating the current obligations
of the company and the coverage of the same with respect to the current assets of the
company.
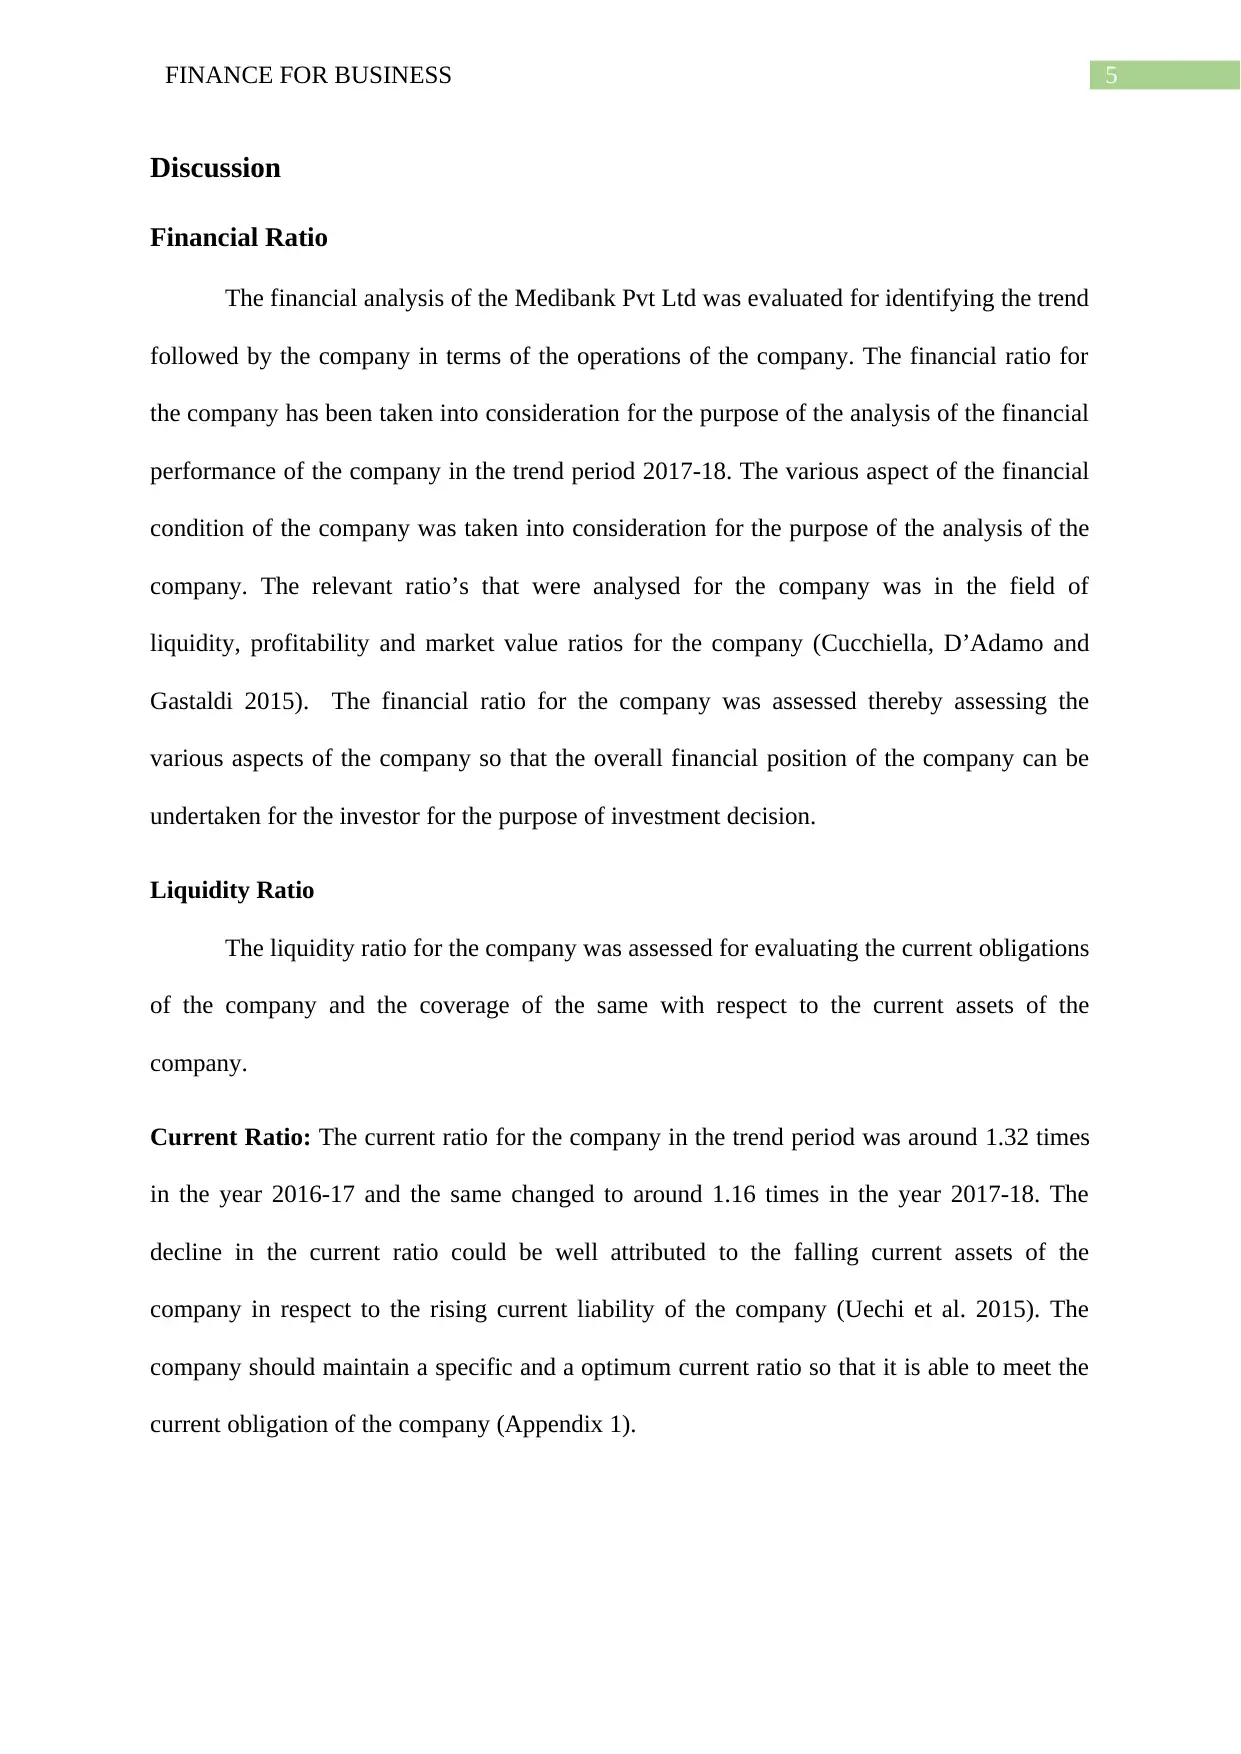
Current Ratio: The current ratio for the company in the trend period was around 1.32 times
in the year 2016-17 and the same changed to around 1.16 times in the year 2017-18. The
decline in the current ratio could be well attributed to the falling current assets of the
company in respect to the rising current liability of the company (Uechi et al. 2015). The
company should maintain a specific and a optimum current ratio so that it is able to meet the
current obligation of the company (Appendix 1).
Discussion
Financial Ratio
The financial analysis of the Medibank Pvt Ltd was evaluated for identifying the trend
followed by the company in terms of the operations of the company. The financial ratio for
the company has been taken into consideration for the purpose of the analysis of the financial
performance of the company in the trend period 2017-18. The various aspect of the financial
condition of the company was taken into consideration for the purpose of the analysis of the
company. The relevant ratio’s that were analysed for the company was in the field of
liquidity, profitability and market value ratios for the company (Cucchiella, D’Adamo and
Gastaldi 2015). The financial ratio for the company was assessed thereby assessing the
various aspects of the company so that the overall financial position of the company can be
undertaken for the investor for the purpose of investment decision.
Liquidity Ratio
The liquidity ratio for the company was assessed for evaluating the current obligations
of the company and the coverage of the same with respect to the current assets of the
company.
Current Ratio: The current ratio for the company in the trend period was around 1.32 times
in the year 2016-17 and the same changed to around 1.16 times in the year 2017-18. The
decline in the current ratio could be well attributed to the falling current assets of the
company in respect to the rising current liability of the company (Uechi et al. 2015). The
company should maintain a specific and a optimum current ratio so that it is able to meet the
current obligation of the company (Appendix 1).
6FINANCE FOR BUSINESS
Figure 1: Current Ratio
(Source: Annual Report 2018)
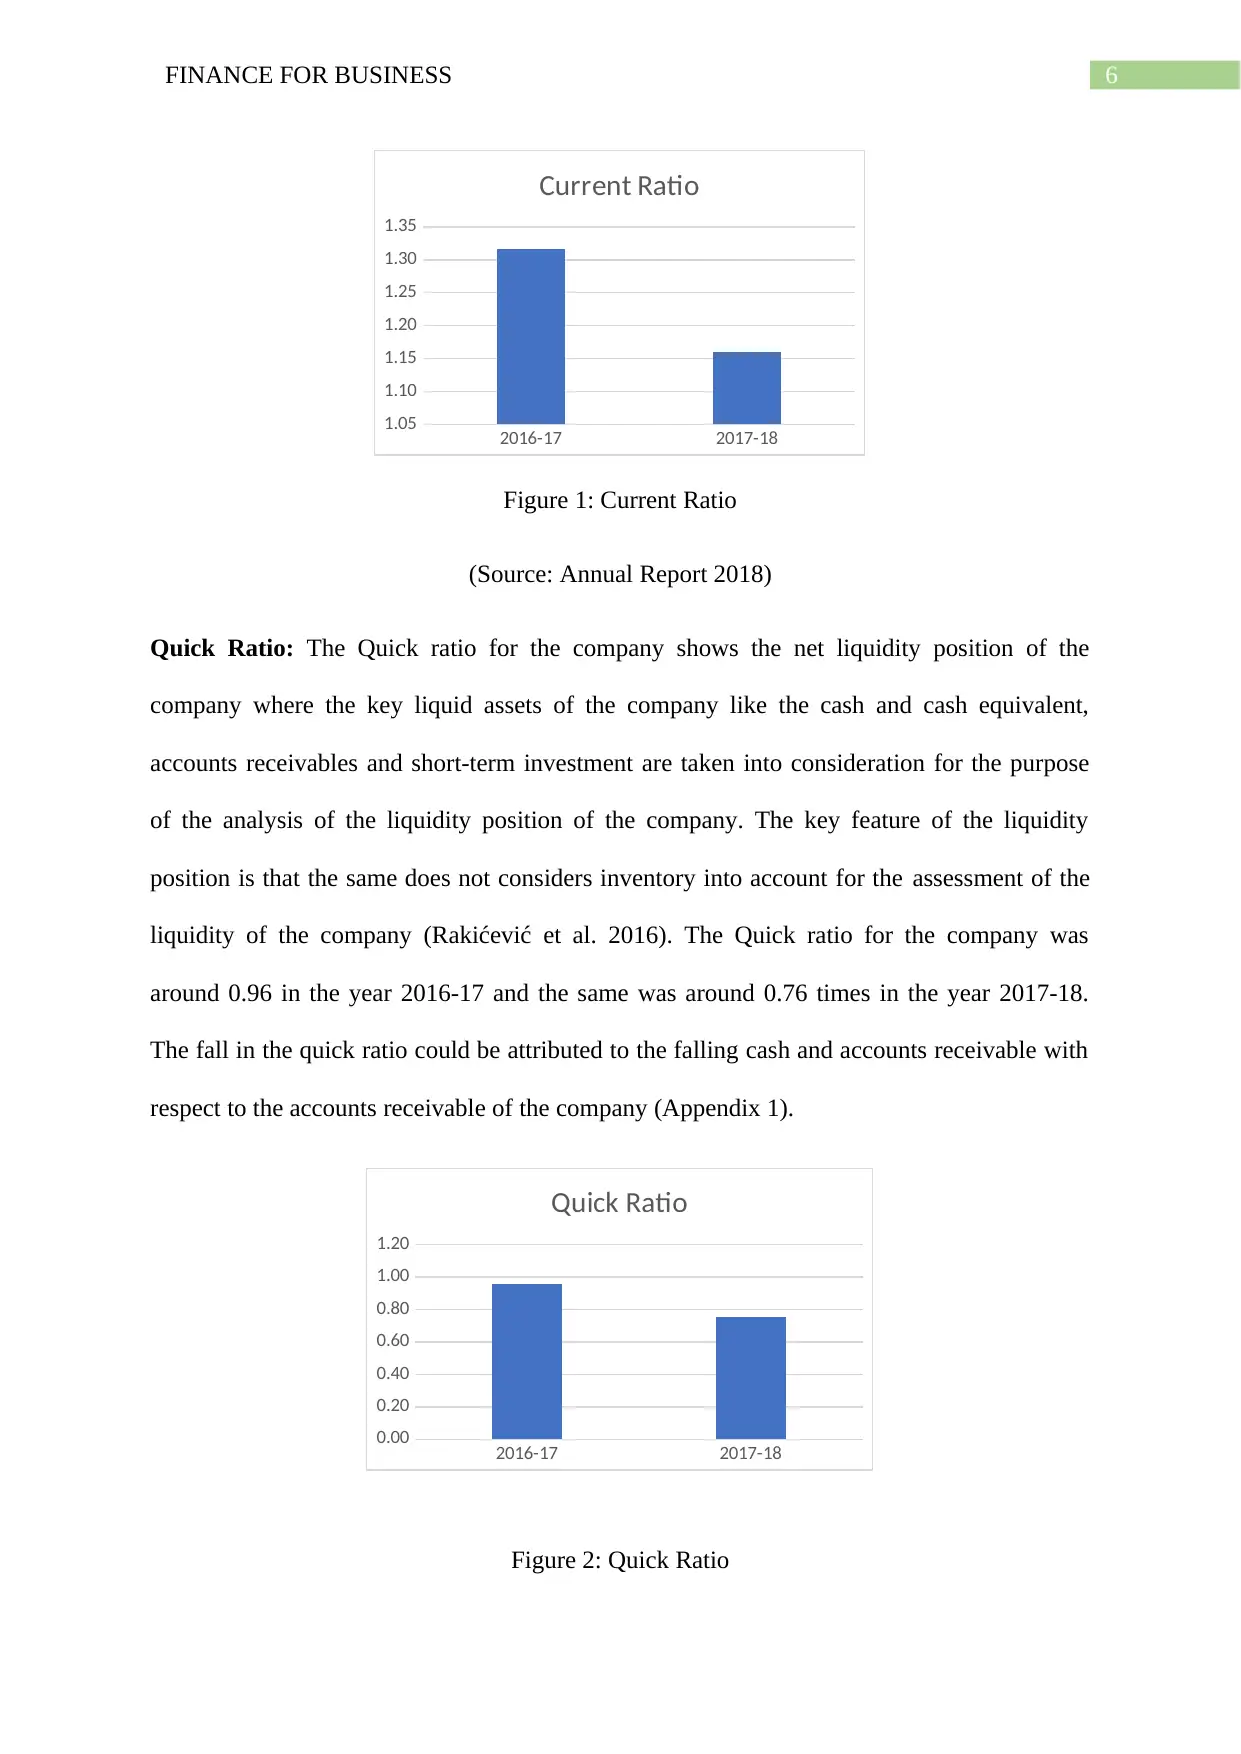
Quick Ratio: The Quick ratio for the company shows the net liquidity position of the
company where the key liquid assets of the company like the cash and cash equivalent,
accounts receivables and short-term investment are taken into consideration for the purpose
of the analysis of the liquidity position of the company. The key feature of the liquidity
position is that the same does not considers inventory into account for the assessment of the
liquidity of the company (Rakićević et al. 2016). The Quick ratio for the company was
around 0.96 in the year 2016-17 and the same was around 0.76 times in the year 2017-18.
The fall in the quick ratio could be attributed to the falling cash and accounts receivable with
respect to the accounts receivable of the company (Appendix 1).
Figure 2: Quick Ratio
2016-17 2017-18
1.05
1.10
1.15
1.20
1.25
1.30
1.35
Current Ratio
2016-17 2017-18
0.00
0.20
0.40
0.60
0.80
1.00
1.20
Quick Ratio
Figure 1: Current Ratio
(Source: Annual Report 2018)
Quick Ratio: The Quick ratio for the company shows the net liquidity position of the
company where the key liquid assets of the company like the cash and cash equivalent,
accounts receivables and short-term investment are taken into consideration for the purpose
of the analysis of the liquidity position of the company. The key feature of the liquidity
position is that the same does not considers inventory into account for the assessment of the
liquidity of the company (Rakićević et al. 2016). The Quick ratio for the company was
around 0.96 in the year 2016-17 and the same was around 0.76 times in the year 2017-18.
The fall in the quick ratio could be attributed to the falling cash and accounts receivable with
respect to the accounts receivable of the company (Appendix 1).
Figure 2: Quick Ratio
2016-17 2017-18
1.05
1.10
1.15
1.20
1.25
1.30
1.35
Current Ratio
2016-17 2017-18
0.00
0.20
0.40
0.60
0.80
1.00
1.20
Quick Ratio
⊘ This is a preview!⊘
Do you want full access?
Subscribe today to unlock all pages.
Trusted by 1+ million students worldwide
7FINANCE FOR BUSINESS
(Source: Annual Report 2018)
Profitability Ratio
The profitability ratio for the company shows the assessment of the profitable position
of the company. The profitability ratio for the company could be well attributed to the return
generated by the company on the overall resources deployed by the company. The key
profitability ratio’s that were computed for the company were the return on capital employed
for the company, gross profit margin ratio and the net profit margin for the company
(Almamy, Aston and Ngwa 2016).
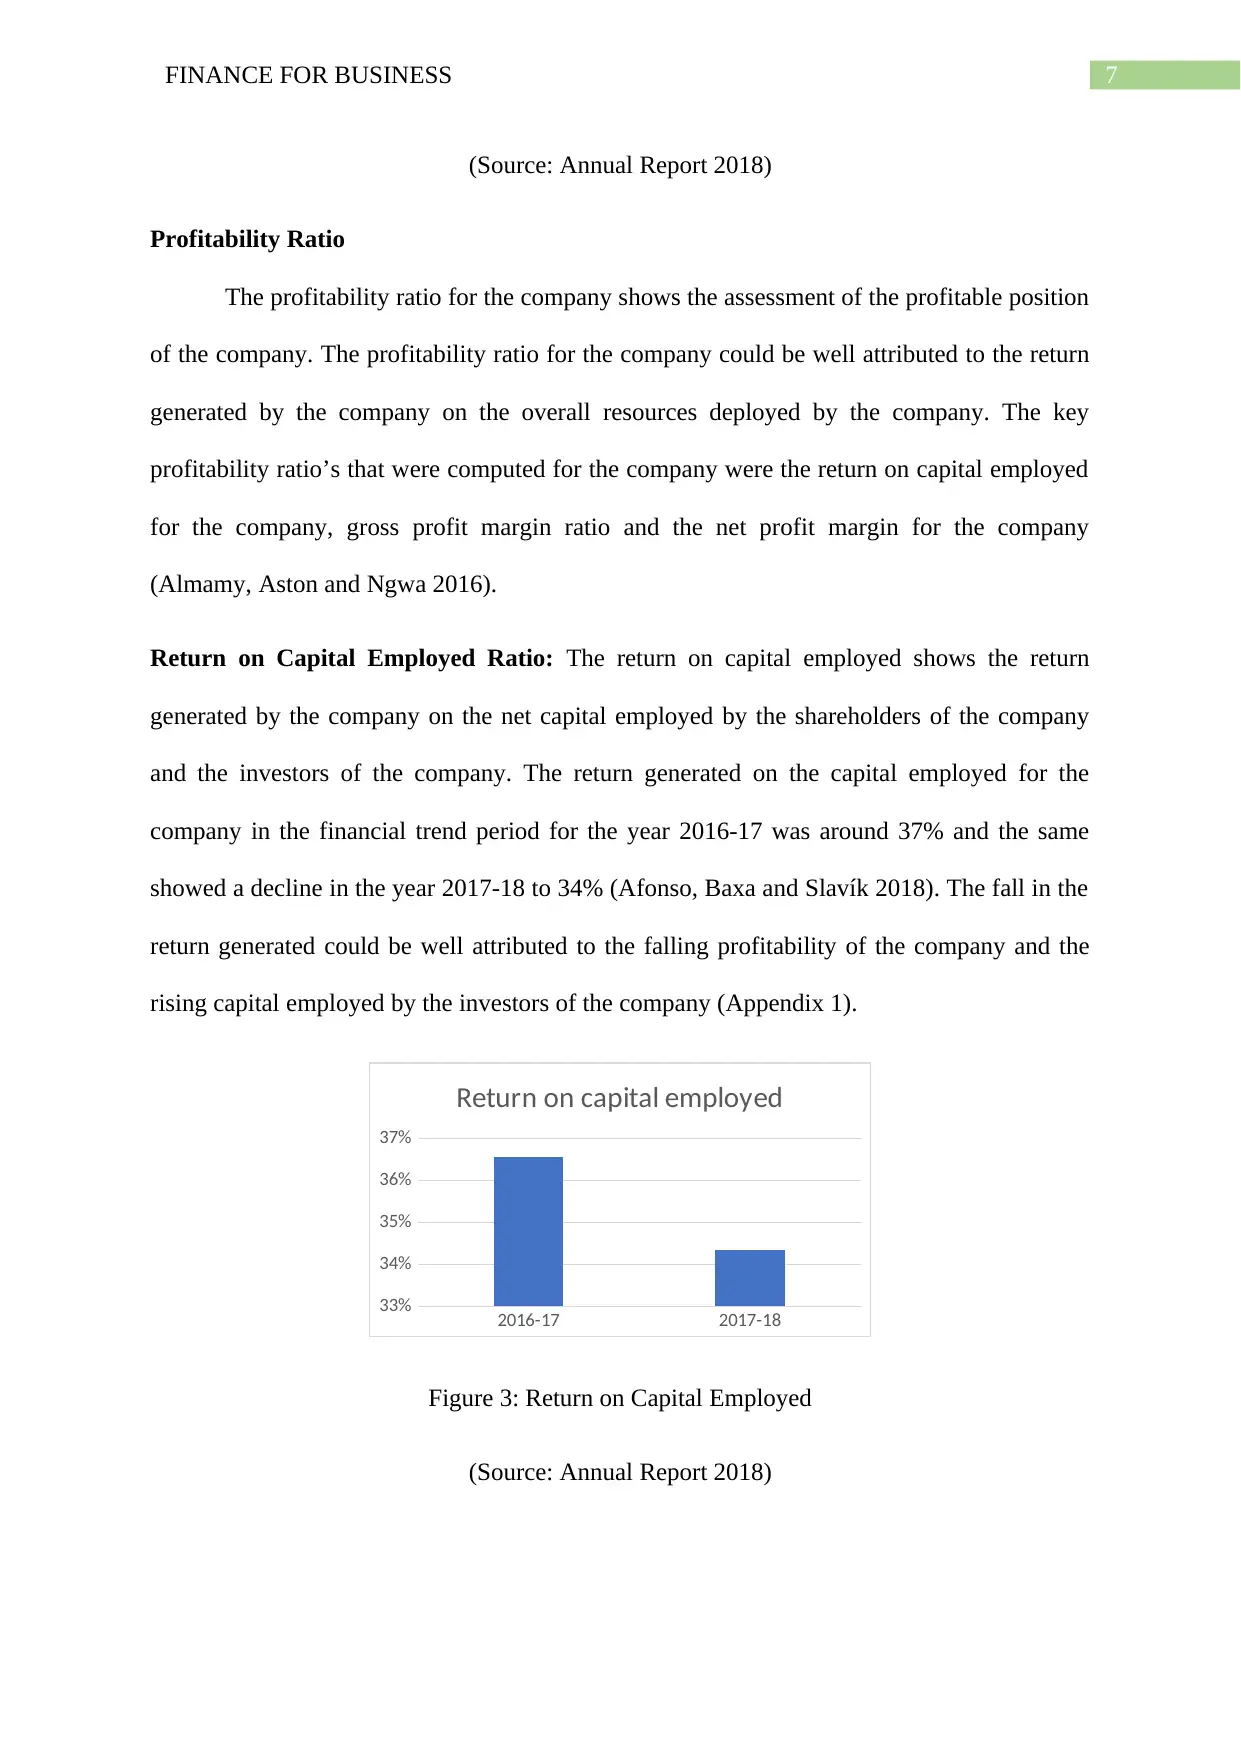
Return on Capital Employed Ratio: The return on capital employed shows the return
generated by the company on the net capital employed by the shareholders of the company
and the investors of the company. The return generated on the capital employed for the
company in the financial trend period for the year 2016-17 was around 37% and the same
showed a decline in the year 2017-18 to 34% (Afonso, Baxa and Slavík 2018). The fall in the
return generated could be well attributed to the falling profitability of the company and the
rising capital employed by the investors of the company (Appendix 1).
2016-17 2017-18
33%
34%
35%
36%
37%
Return on capital employed
Figure 3: Return on Capital Employed
(Source: Annual Report 2018)
(Source: Annual Report 2018)
Profitability Ratio
The profitability ratio for the company shows the assessment of the profitable position
of the company. The profitability ratio for the company could be well attributed to the return
generated by the company on the overall resources deployed by the company. The key
profitability ratio’s that were computed for the company were the return on capital employed
for the company, gross profit margin ratio and the net profit margin for the company
(Almamy, Aston and Ngwa 2016).
Return on Capital Employed Ratio: The return on capital employed shows the return
generated by the company on the net capital employed by the shareholders of the company
and the investors of the company. The return generated on the capital employed for the
company in the financial trend period for the year 2016-17 was around 37% and the same
showed a decline in the year 2017-18 to 34% (Afonso, Baxa and Slavík 2018). The fall in the
return generated could be well attributed to the falling profitability of the company and the
rising capital employed by the investors of the company (Appendix 1).
2016-17 2017-18
33%
34%
35%
36%
37%
Return on capital employed
Figure 3: Return on Capital Employed
(Source: Annual Report 2018)
Paraphrase This Document
Need a fresh take? Get an instant paraphrase of this document with our AI Paraphraser
8FINANCE FOR BUSINESS
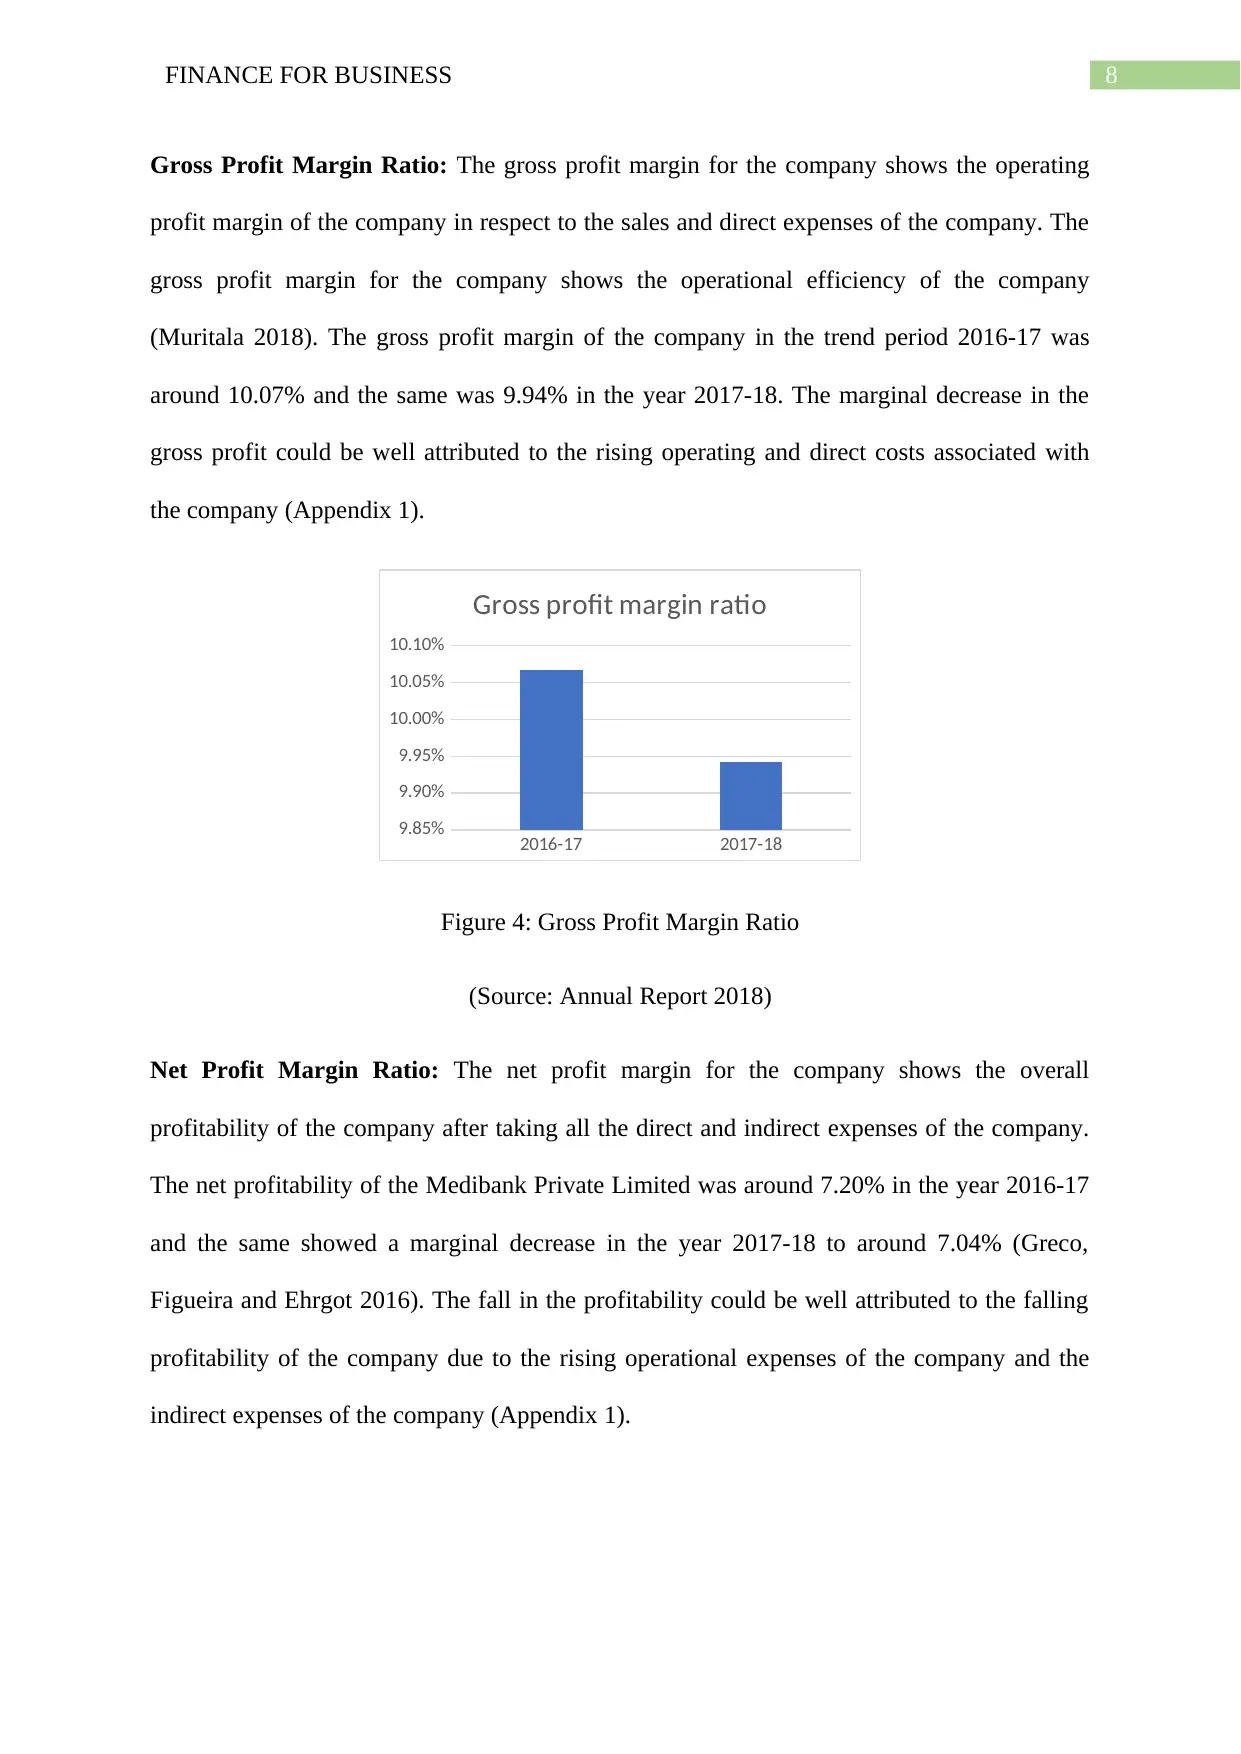
Gross Profit Margin Ratio: The gross profit margin for the company shows the operating
profit margin of the company in respect to the sales and direct expenses of the company. The
gross profit margin for the company shows the operational efficiency of the company
(Muritala 2018). The gross profit margin of the company in the trend period 2016-17 was
around 10.07% and the same was 9.94% in the year 2017-18. The marginal decrease in the
gross profit could be well attributed to the rising operating and direct costs associated with
the company (Appendix 1).
2016-17 2017-18
9.85%
9.90%
9.95%
10.00%
10.05%
10.10%
Gross profit margin ratio
Figure 4: Gross Profit Margin Ratio
(Source: Annual Report 2018)
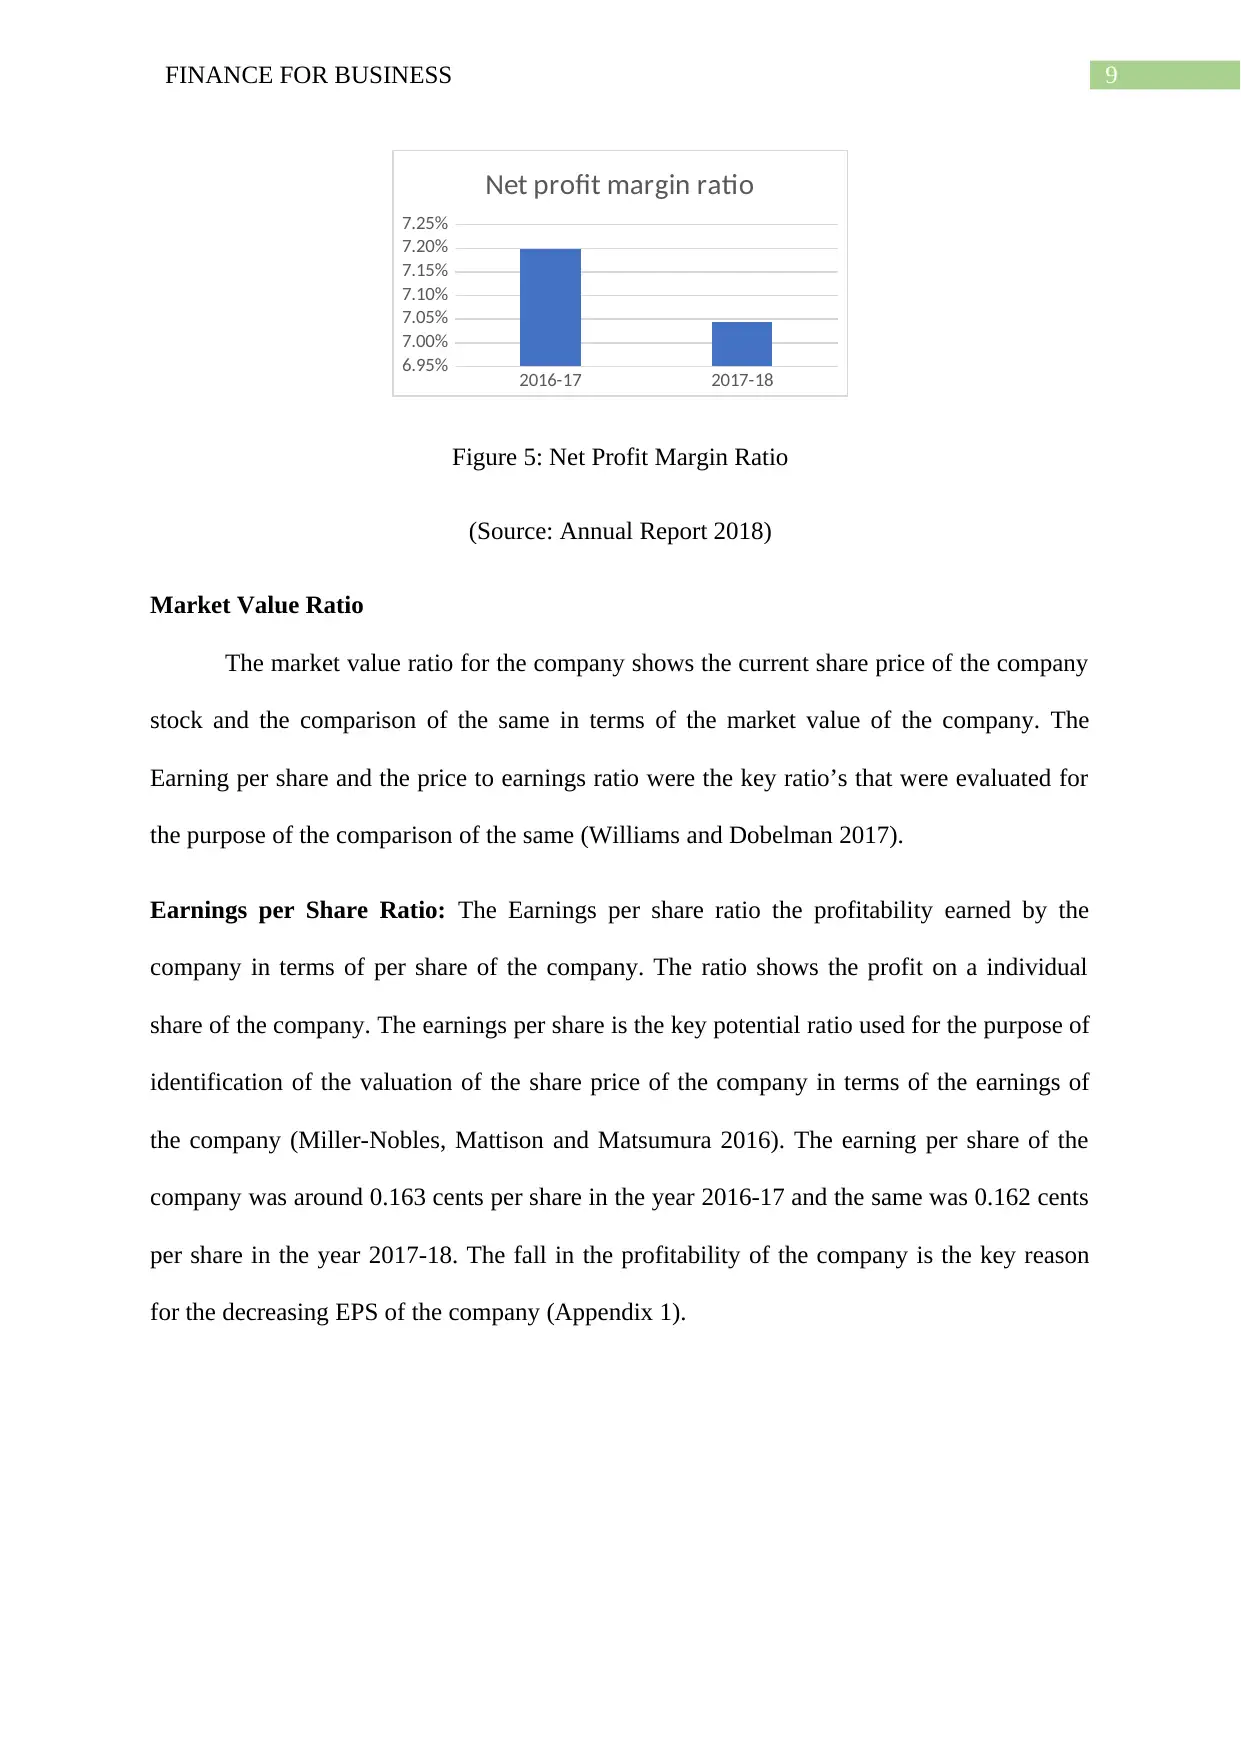
Net Profit Margin Ratio: The net profit margin for the company shows the overall
profitability of the company after taking all the direct and indirect expenses of the company.
The net profitability of the Medibank Private Limited was around 7.20% in the year 2016-17
and the same showed a marginal decrease in the year 2017-18 to around 7.04% (Greco,
Figueira and Ehrgot 2016). The fall in the profitability could be well attributed to the falling
profitability of the company due to the rising operational expenses of the company and the
indirect expenses of the company (Appendix 1).
Gross Profit Margin Ratio: The gross profit margin for the company shows the operating
profit margin of the company in respect to the sales and direct expenses of the company. The
gross profit margin for the company shows the operational efficiency of the company
(Muritala 2018). The gross profit margin of the company in the trend period 2016-17 was
around 10.07% and the same was 9.94% in the year 2017-18. The marginal decrease in the
gross profit could be well attributed to the rising operating and direct costs associated with
the company (Appendix 1).
2016-17 2017-18
9.85%
9.90%
9.95%
10.00%
10.05%
10.10%
Gross profit margin ratio
Figure 4: Gross Profit Margin Ratio
(Source: Annual Report 2018)
Net Profit Margin Ratio: The net profit margin for the company shows the overall
profitability of the company after taking all the direct and indirect expenses of the company.
The net profitability of the Medibank Private Limited was around 7.20% in the year 2016-17
and the same showed a marginal decrease in the year 2017-18 to around 7.04% (Greco,
Figueira and Ehrgot 2016). The fall in the profitability could be well attributed to the falling
profitability of the company due to the rising operational expenses of the company and the
indirect expenses of the company (Appendix 1).
9FINANCE FOR BUSINESS
2016-17 2017-18
6.95%
7.00%
7.05%
7.10%
7.15%
7.20%
7.25%
Net profit margin ratio
Figure 5: Net Profit Margin Ratio
(Source: Annual Report 2018)
Market Value Ratio
The market value ratio for the company shows the current share price of the company
stock and the comparison of the same in terms of the market value of the company. The
Earning per share and the price to earnings ratio were the key ratio’s that were evaluated for
the purpose of the comparison of the same (Williams and Dobelman 2017).
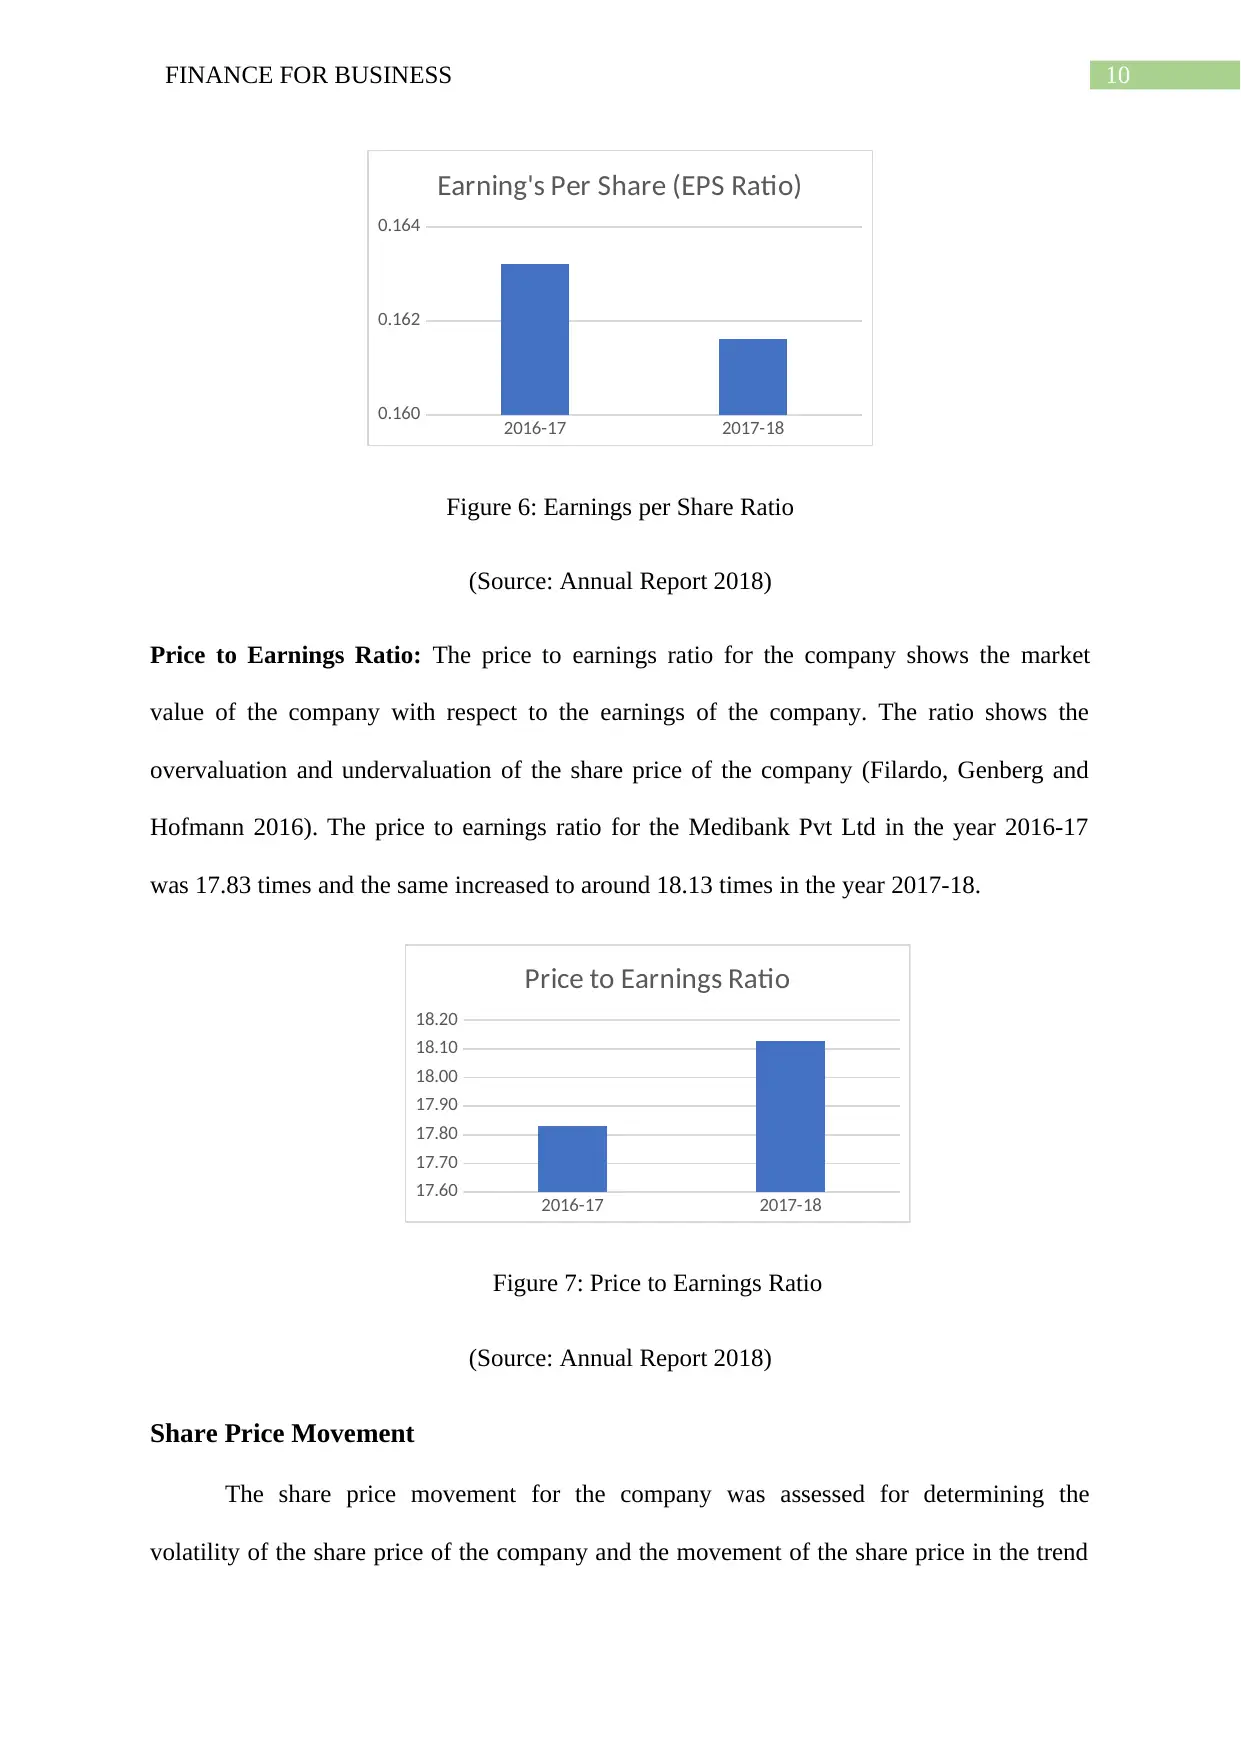
Earnings per Share Ratio: The Earnings per share ratio the profitability earned by the
company in terms of per share of the company. The ratio shows the profit on a individual
share of the company. The earnings per share is the key potential ratio used for the purpose of
identification of the valuation of the share price of the company in terms of the earnings of
the company (Miller-Nobles, Mattison and Matsumura 2016). The earning per share of the
company was around 0.163 cents per share in the year 2016-17 and the same was 0.162 cents
per share in the year 2017-18. The fall in the profitability of the company is the key reason
for the decreasing EPS of the company (Appendix 1).
2016-17 2017-18
6.95%
7.00%
7.05%
7.10%
7.15%
7.20%
7.25%
Net profit margin ratio
Figure 5: Net Profit Margin Ratio
(Source: Annual Report 2018)
Market Value Ratio
The market value ratio for the company shows the current share price of the company
stock and the comparison of the same in terms of the market value of the company. The
Earning per share and the price to earnings ratio were the key ratio’s that were evaluated for
the purpose of the comparison of the same (Williams and Dobelman 2017).
Earnings per Share Ratio: The Earnings per share ratio the profitability earned by the
company in terms of per share of the company. The ratio shows the profit on a individual
share of the company. The earnings per share is the key potential ratio used for the purpose of
identification of the valuation of the share price of the company in terms of the earnings of
the company (Miller-Nobles, Mattison and Matsumura 2016). The earning per share of the
company was around 0.163 cents per share in the year 2016-17 and the same was 0.162 cents
per share in the year 2017-18. The fall in the profitability of the company is the key reason
for the decreasing EPS of the company (Appendix 1).
⊘ This is a preview!⊘
Do you want full access?
Subscribe today to unlock all pages.
Trusted by 1+ million students worldwide
10FINANCE FOR BUSINESS
2016-17 2017-18
0.160
0.162
0.164
Earning's Per Share (EPS Ratio)
Figure 6: Earnings per Share Ratio
(Source: Annual Report 2018)
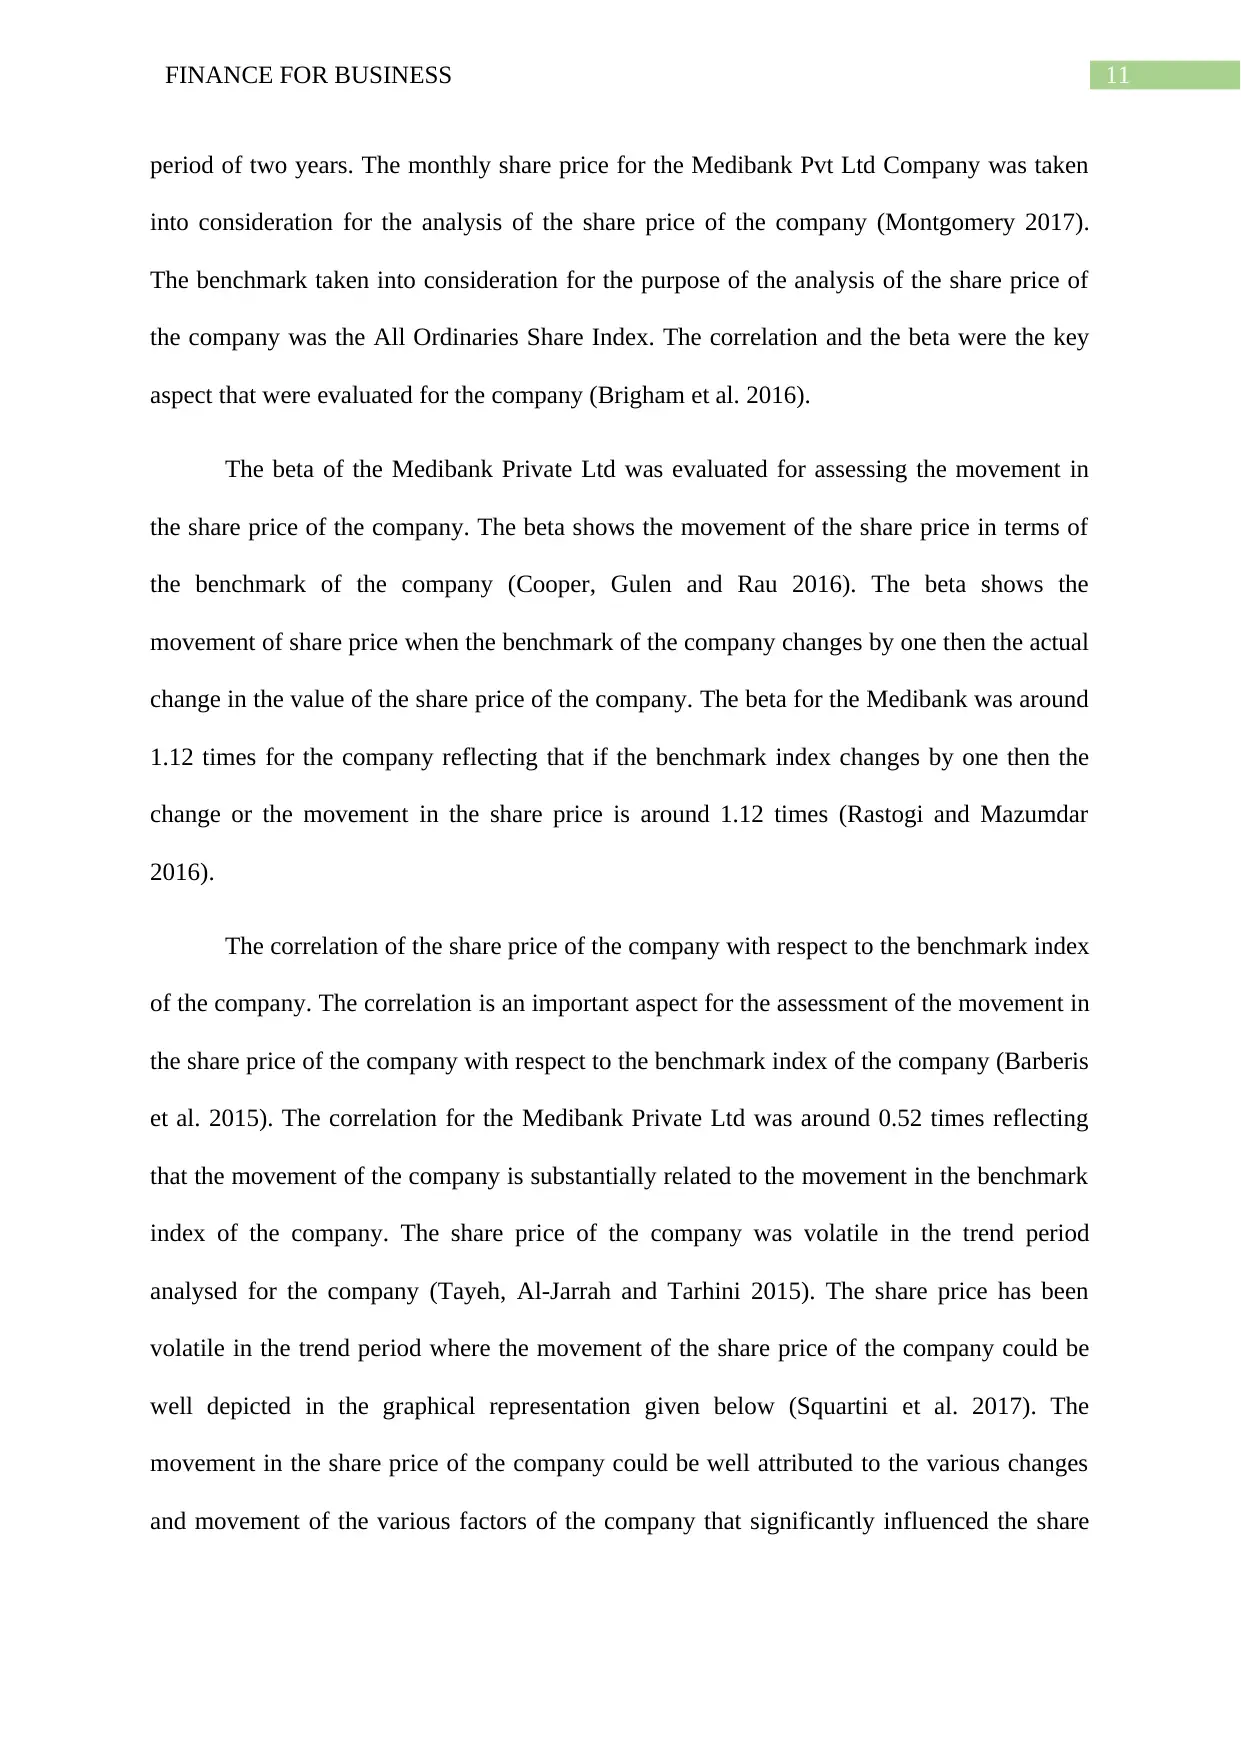
Price to Earnings Ratio: The price to earnings ratio for the company shows the market
value of the company with respect to the earnings of the company. The ratio shows the
overvaluation and undervaluation of the share price of the company (Filardo, Genberg and
Hofmann 2016). The price to earnings ratio for the Medibank Pvt Ltd in the year 2016-17
was 17.83 times and the same increased to around 18.13 times in the year 2017-18.
2016-17 2017-18
17.60
17.70
17.80
17.90
18.00
18.10
18.20
Price to Earnings Ratio
Figure 7: Price to Earnings Ratio
(Source: Annual Report 2018)
Share Price Movement
The share price movement for the company was assessed for determining the
volatility of the share price of the company and the movement of the share price in the trend
2016-17 2017-18
0.160
0.162
0.164
Earning's Per Share (EPS Ratio)
Figure 6: Earnings per Share Ratio
(Source: Annual Report 2018)
Price to Earnings Ratio: The price to earnings ratio for the company shows the market
value of the company with respect to the earnings of the company. The ratio shows the
overvaluation and undervaluation of the share price of the company (Filardo, Genberg and
Hofmann 2016). The price to earnings ratio for the Medibank Pvt Ltd in the year 2016-17
was 17.83 times and the same increased to around 18.13 times in the year 2017-18.
2016-17 2017-18
17.60
17.70
17.80
17.90
18.00
18.10
18.20
Price to Earnings Ratio
Figure 7: Price to Earnings Ratio
(Source: Annual Report 2018)
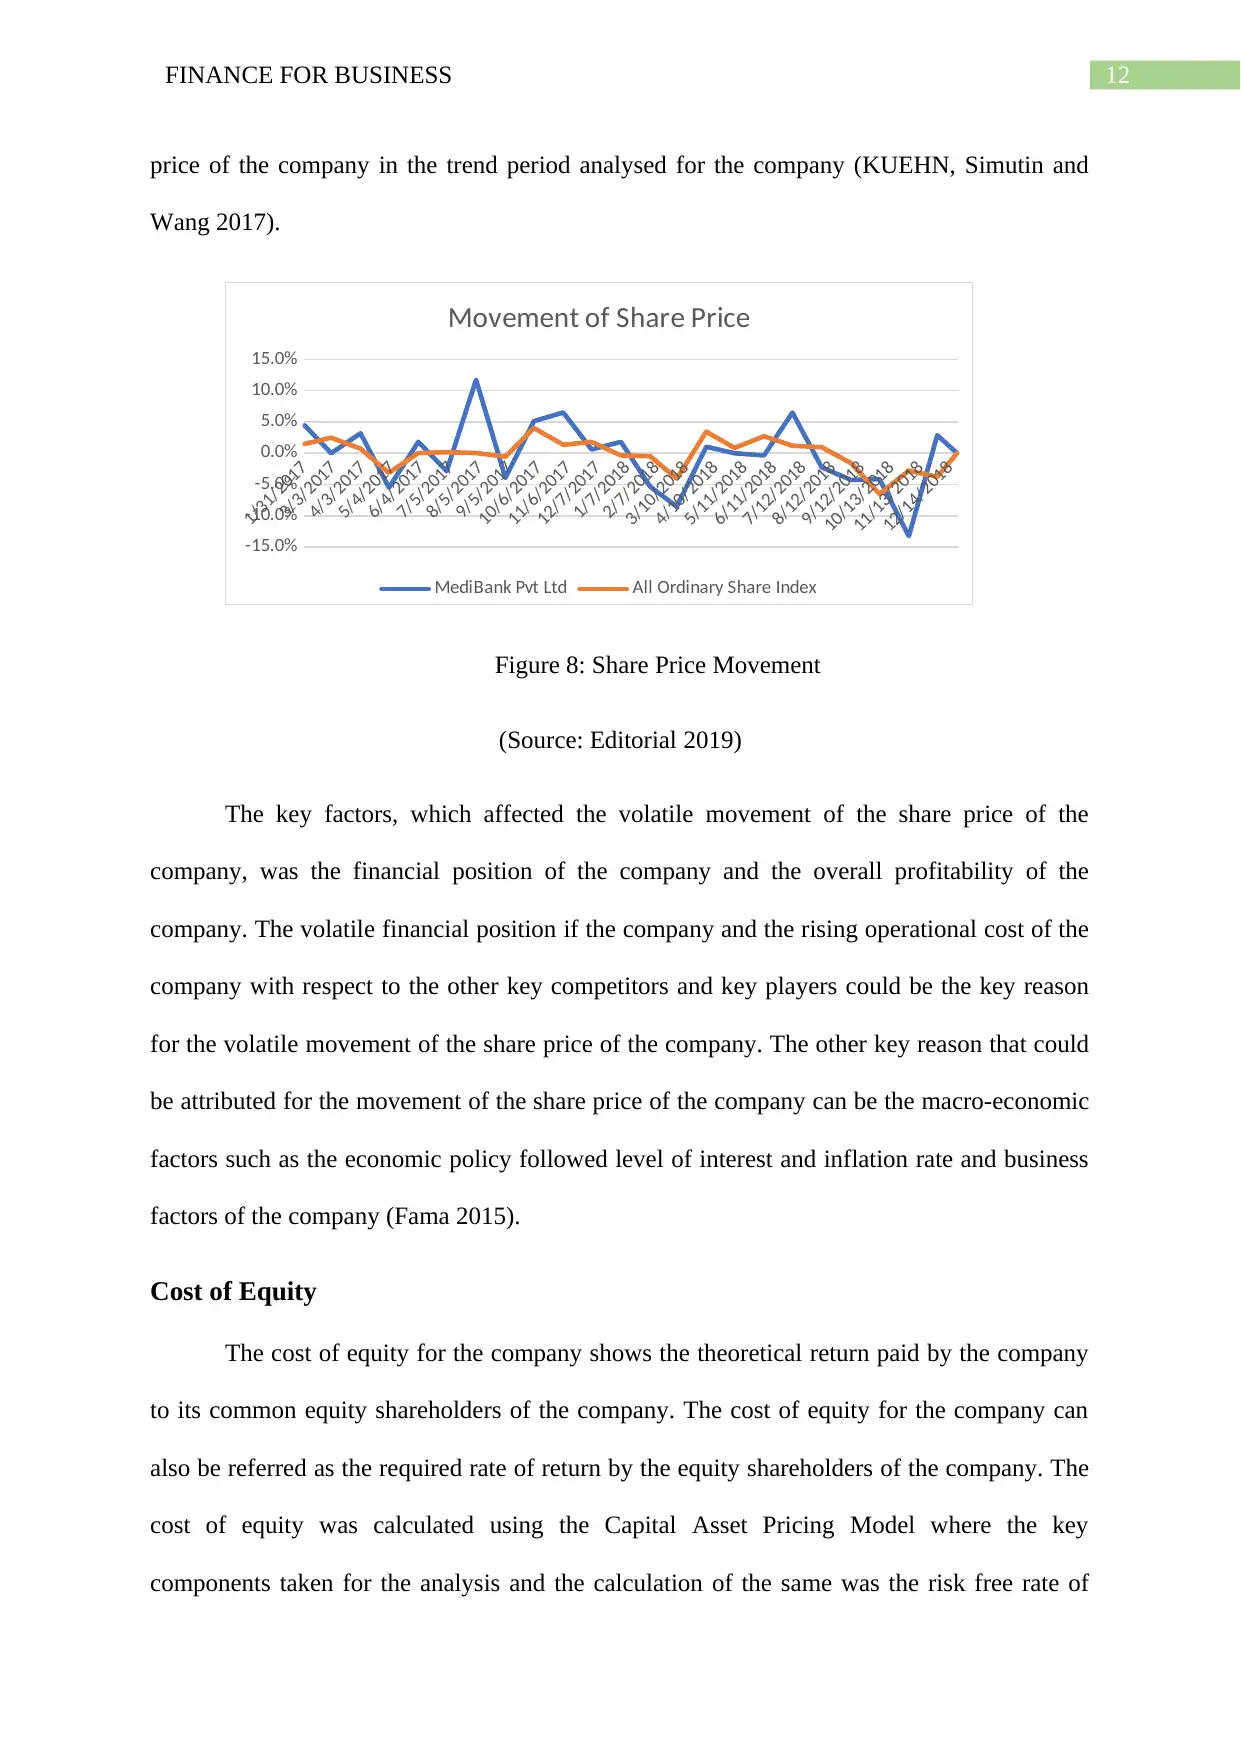
Share Price Movement
The share price movement for the company was assessed for determining the
volatility of the share price of the company and the movement of the share price in the trend
Paraphrase This Document
Need a fresh take? Get an instant paraphrase of this document with our AI Paraphraser
11FINANCE FOR BUSINESS
period of two years. The monthly share price for the Medibank Pvt Ltd Company was taken
into consideration for the analysis of the share price of the company (Montgomery 2017).
The benchmark taken into consideration for the purpose of the analysis of the share price of
the company was the All Ordinaries Share Index. The correlation and the beta were the key
aspect that were evaluated for the company (Brigham et al. 2016).
The beta of the Medibank Private Ltd was evaluated for assessing the movement in
the share price of the company. The beta shows the movement of the share price in terms of
the benchmark of the company (Cooper, Gulen and Rau 2016). The beta shows the
movement of share price when the benchmark of the company changes by one then the actual
change in the value of the share price of the company. The beta for the Medibank was around
1.12 times for the company reflecting that if the benchmark index changes by one then the
change or the movement in the share price is around 1.12 times (Rastogi and Mazumdar
2016).
The correlation of the share price of the company with respect to the benchmark index
of the company. The correlation is an important aspect for the assessment of the movement in
the share price of the company with respect to the benchmark index of the company (Barberis
et al. 2015). The correlation for the Medibank Private Ltd was around 0.52 times reflecting
that the movement of the company is substantially related to the movement in the benchmark
index of the company. The share price of the company was volatile in the trend period
analysed for the company (Tayeh, Al-Jarrah and Tarhini 2015). The share price has been
volatile in the trend period where the movement of the share price of the company could be
well depicted in the graphical representation given below (Squartini et al. 2017). The
movement in the share price of the company could be well attributed to the various changes
and movement of the various factors of the company that significantly influenced the share
12FINANCE FOR BUSINESS
price of the company in the trend period analysed for the company (KUEHN, Simutin and
Wang 2017).
1/31/2017
3/3/2017
4/3/2017
5/4/2017
6/4/2017
7/5/2017
8/5/2017
9/5/2017
10/6/2017
11/6/2017
12/7/2017
1/7/2018
2/7/2018
3/10/2018
4/10/2018
5/11/2018
6/11/2018
7/12/2018
8/12/2018
9/12/2018
10/13/2018
11/13/2018
12/14/2018
-15.0%
-10.0%
-5.0%
0.0%
5.0%
10.0%
15.0%
Movement of Share Price
MediBank Pvt Ltd All Ordinary Share Index
Figure 8: Share Price Movement
(Source: Editorial 2019)
The key factors, which affected the volatile movement of the share price of the
company, was the financial position of the company and the overall profitability of the
company. The volatile financial position if the company and the rising operational cost of the
company with respect to the other key competitors and key players could be the key reason
for the volatile movement of the share price of the company. The other key reason that could
be attributed for the movement of the share price of the company can be the macro-economic
factors such as the economic policy followed level of interest and inflation rate and business
factors of the company (Fama 2015).
Cost of Equity
The cost of equity for the company shows the theoretical return paid by the company
to its common equity shareholders of the company. The cost of equity for the company can
also be referred as the required rate of return by the equity shareholders of the company. The
cost of equity was calculated using the Capital Asset Pricing Model where the key
components taken for the analysis and the calculation of the same was the risk free rate of
⊘ This is a preview!⊘
Do you want full access?
Subscribe today to unlock all pages.
Trusted by 1+ million students worldwide
1 out of 19
Related Documents


Your All-in-One AI-Powered Toolkit for Academic Success.
+13062052269
info@desklib.com
Available 24*7 on WhatsApp / Email
![[object Object]](/_next/static/media/star-bottom.7253800d.svg)
Unlock your academic potential
Copyright © 2020–2026 A2Z Services. All Rights Reserved. Developed and managed by ZUCOL.