Auditing Theory: Medibank Risk Analysis and Financial Ratio Comparison

Verified

Added on  2020/05/28

|13
|2312
|312
Report
AI Summary
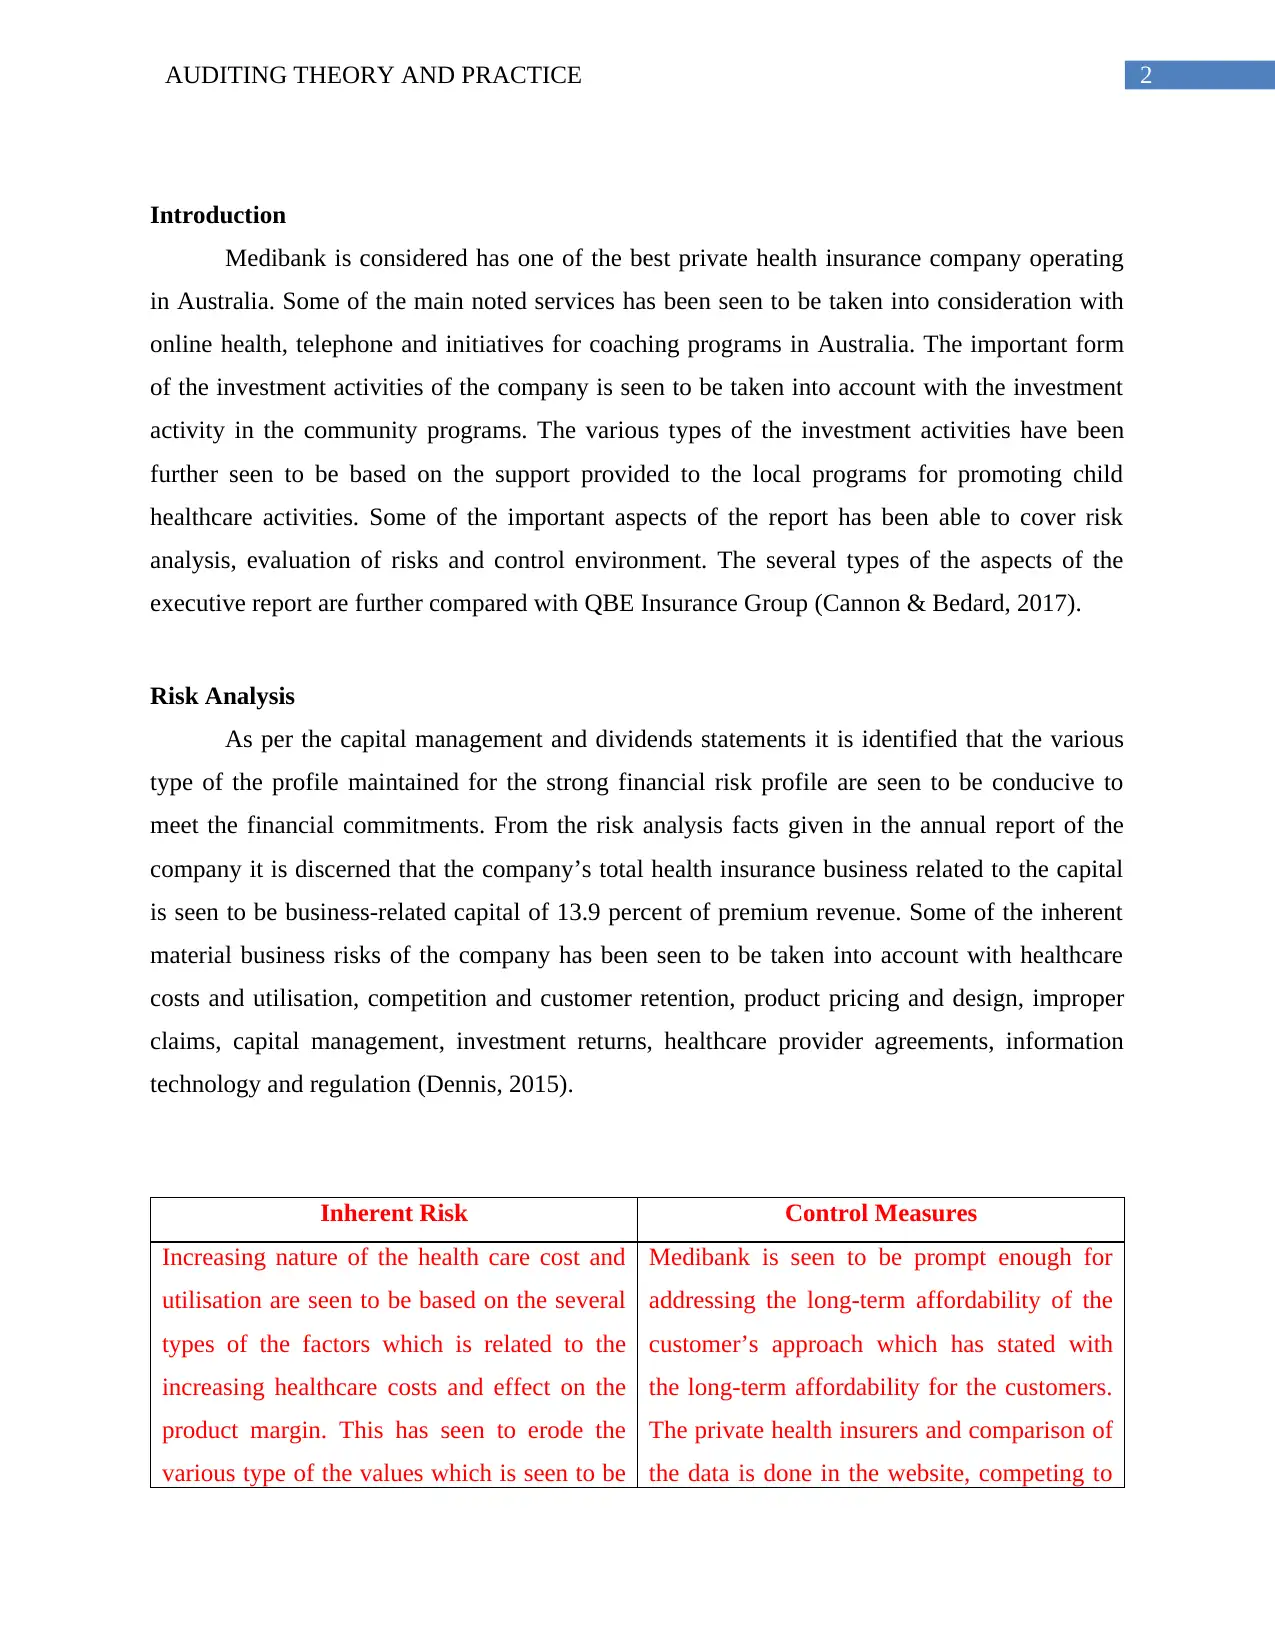
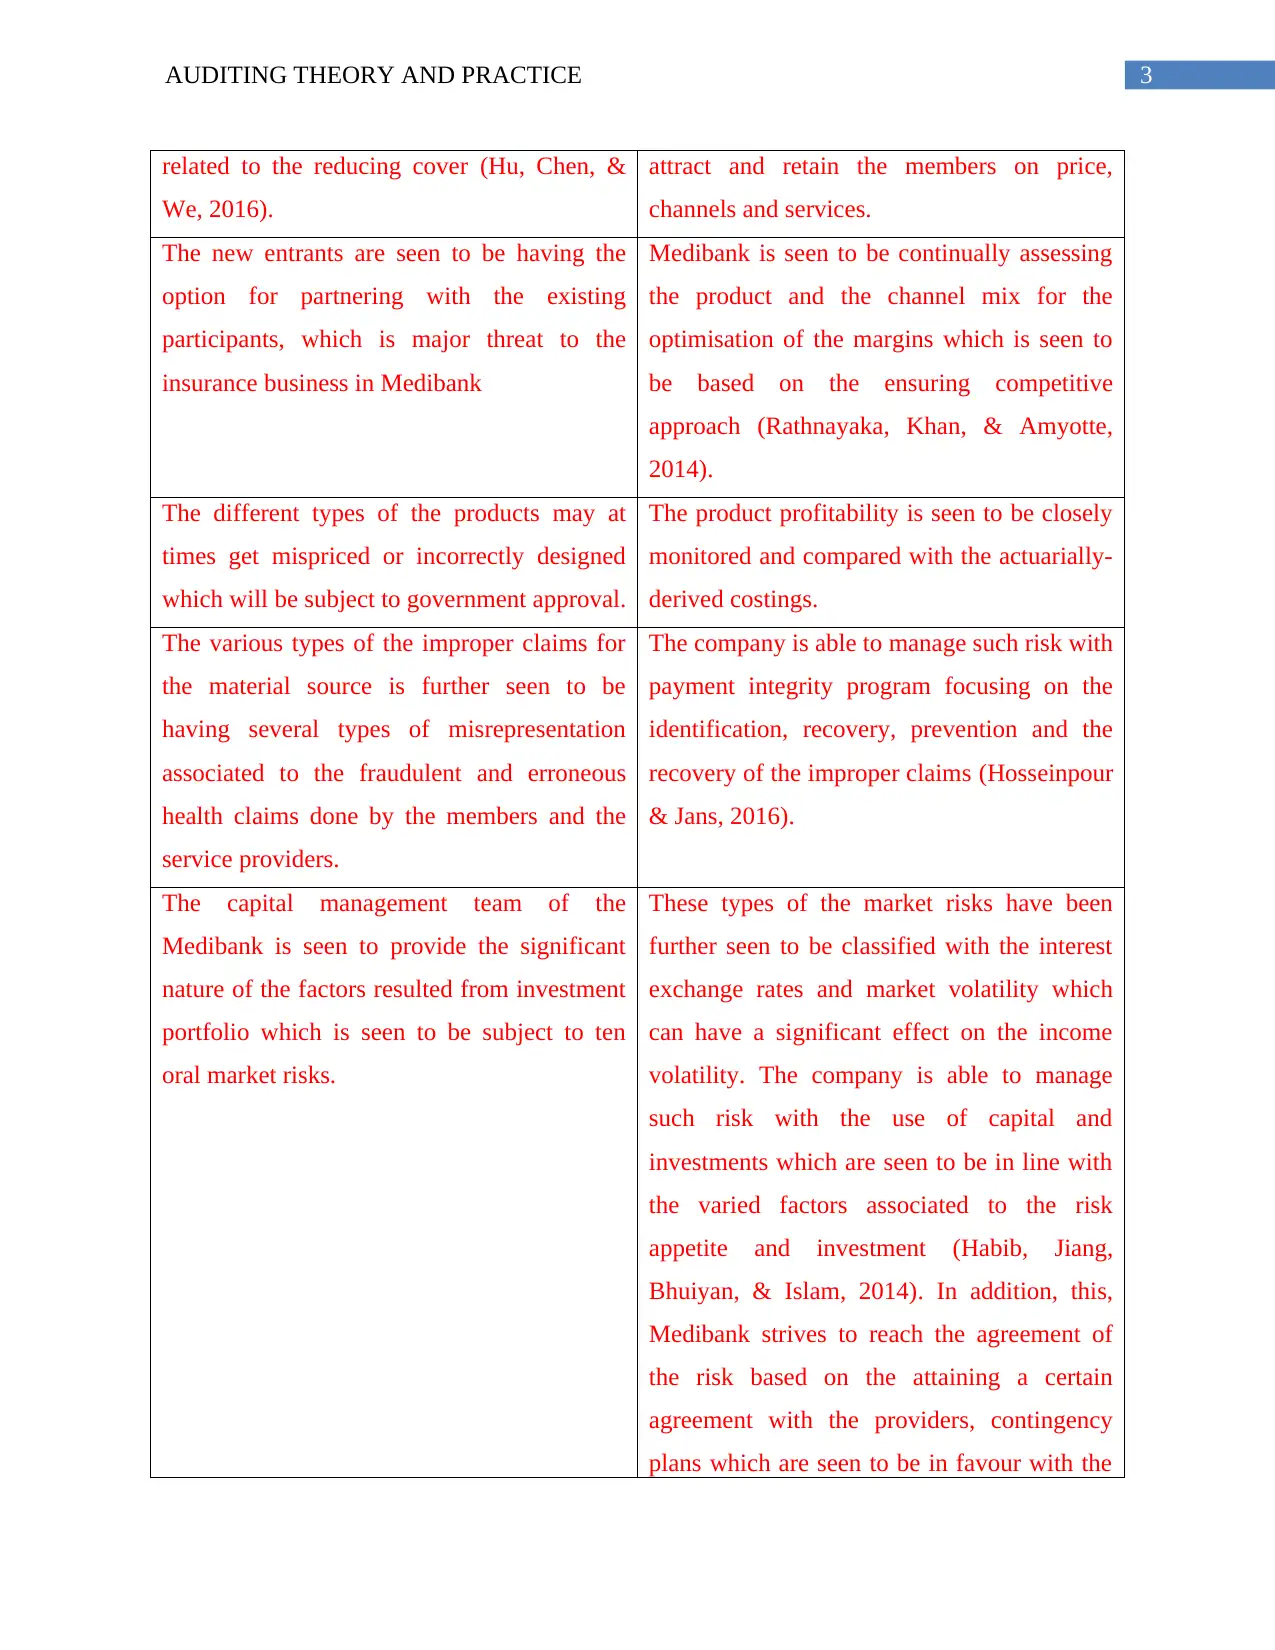
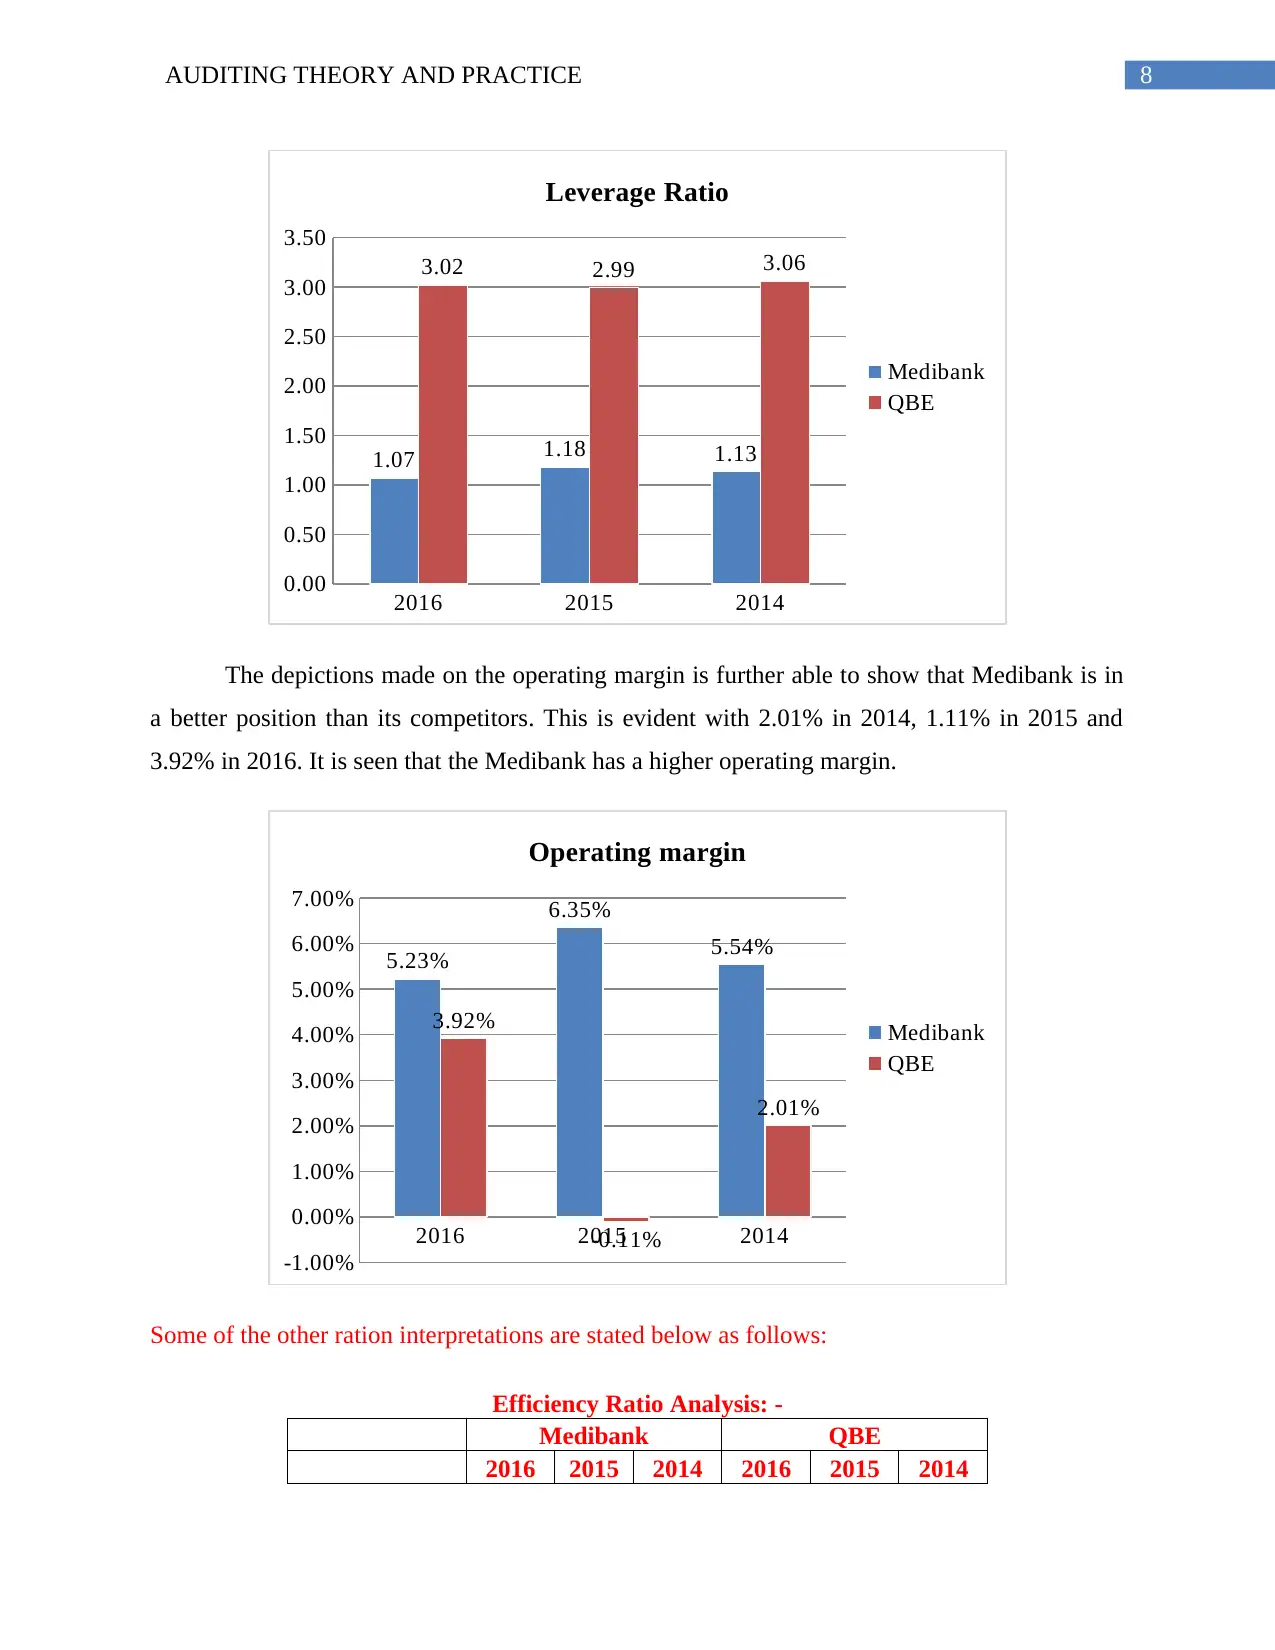
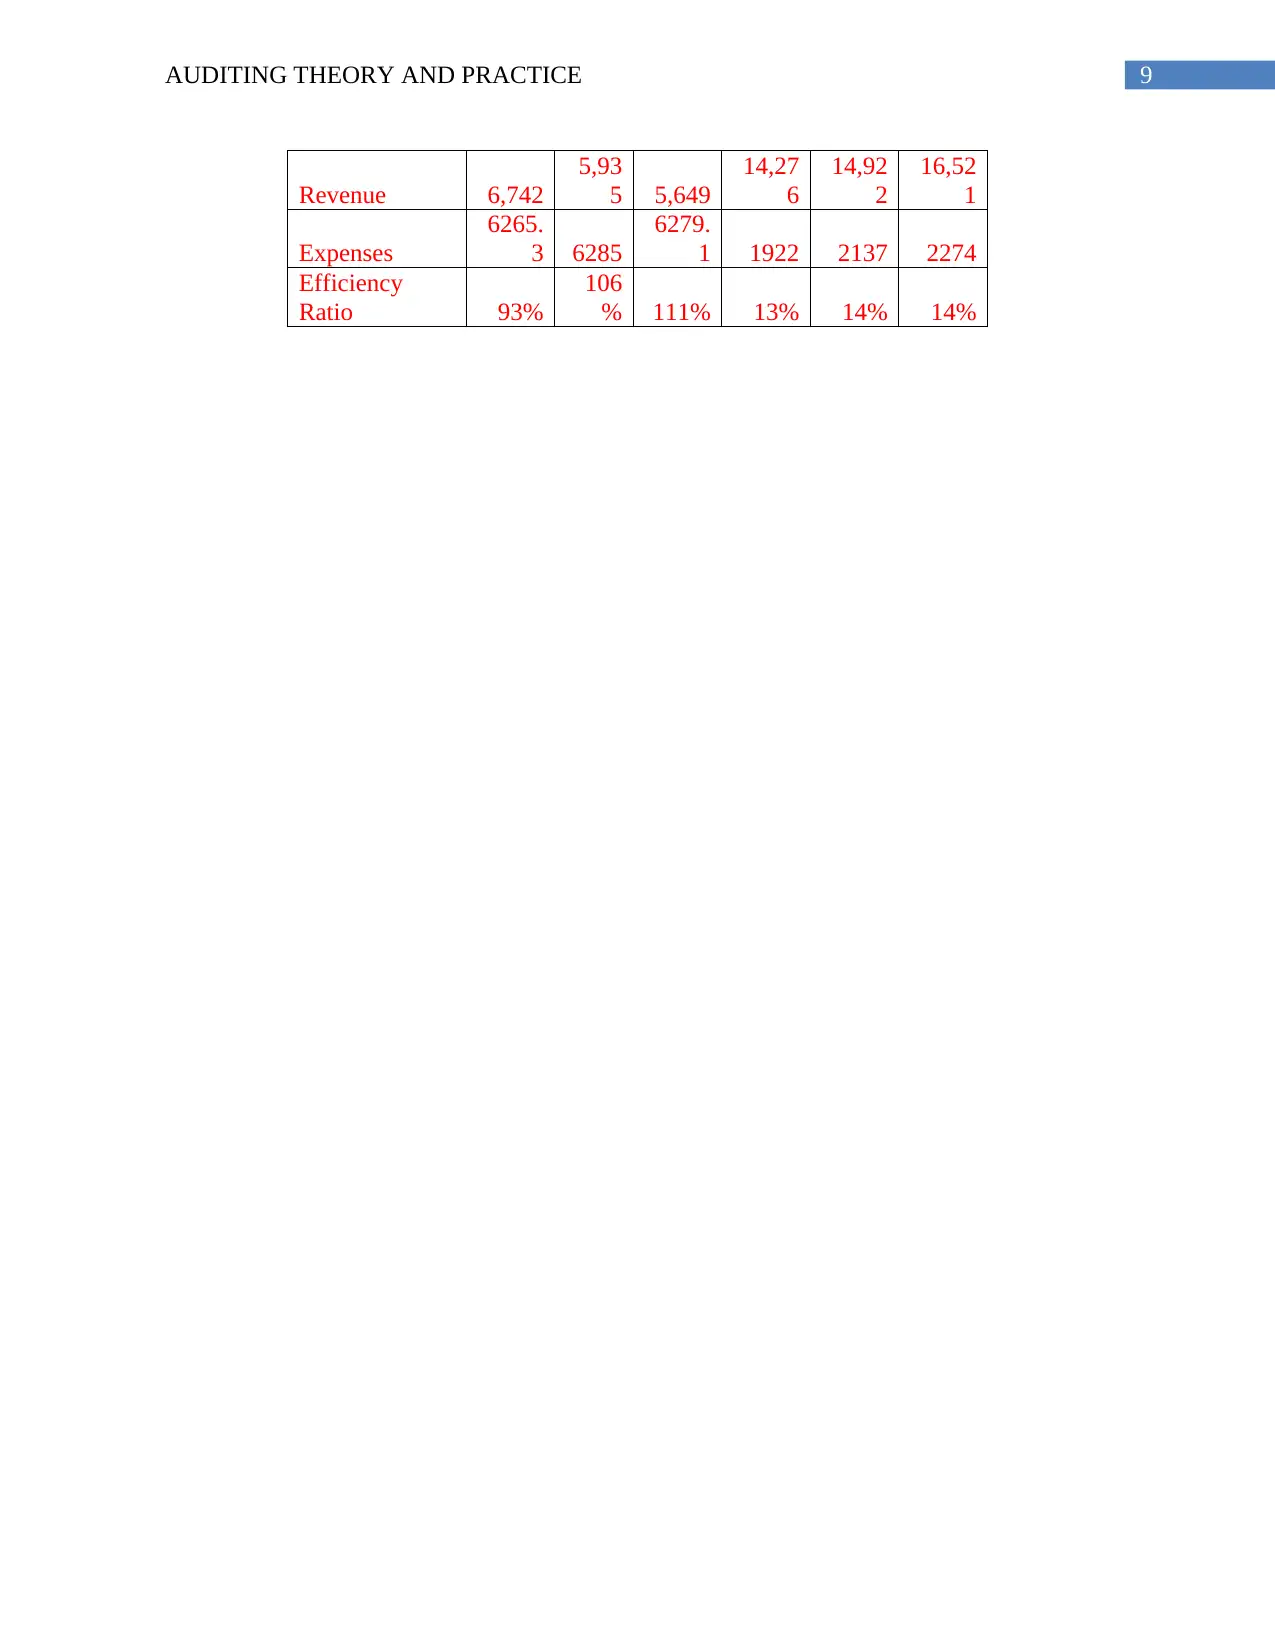
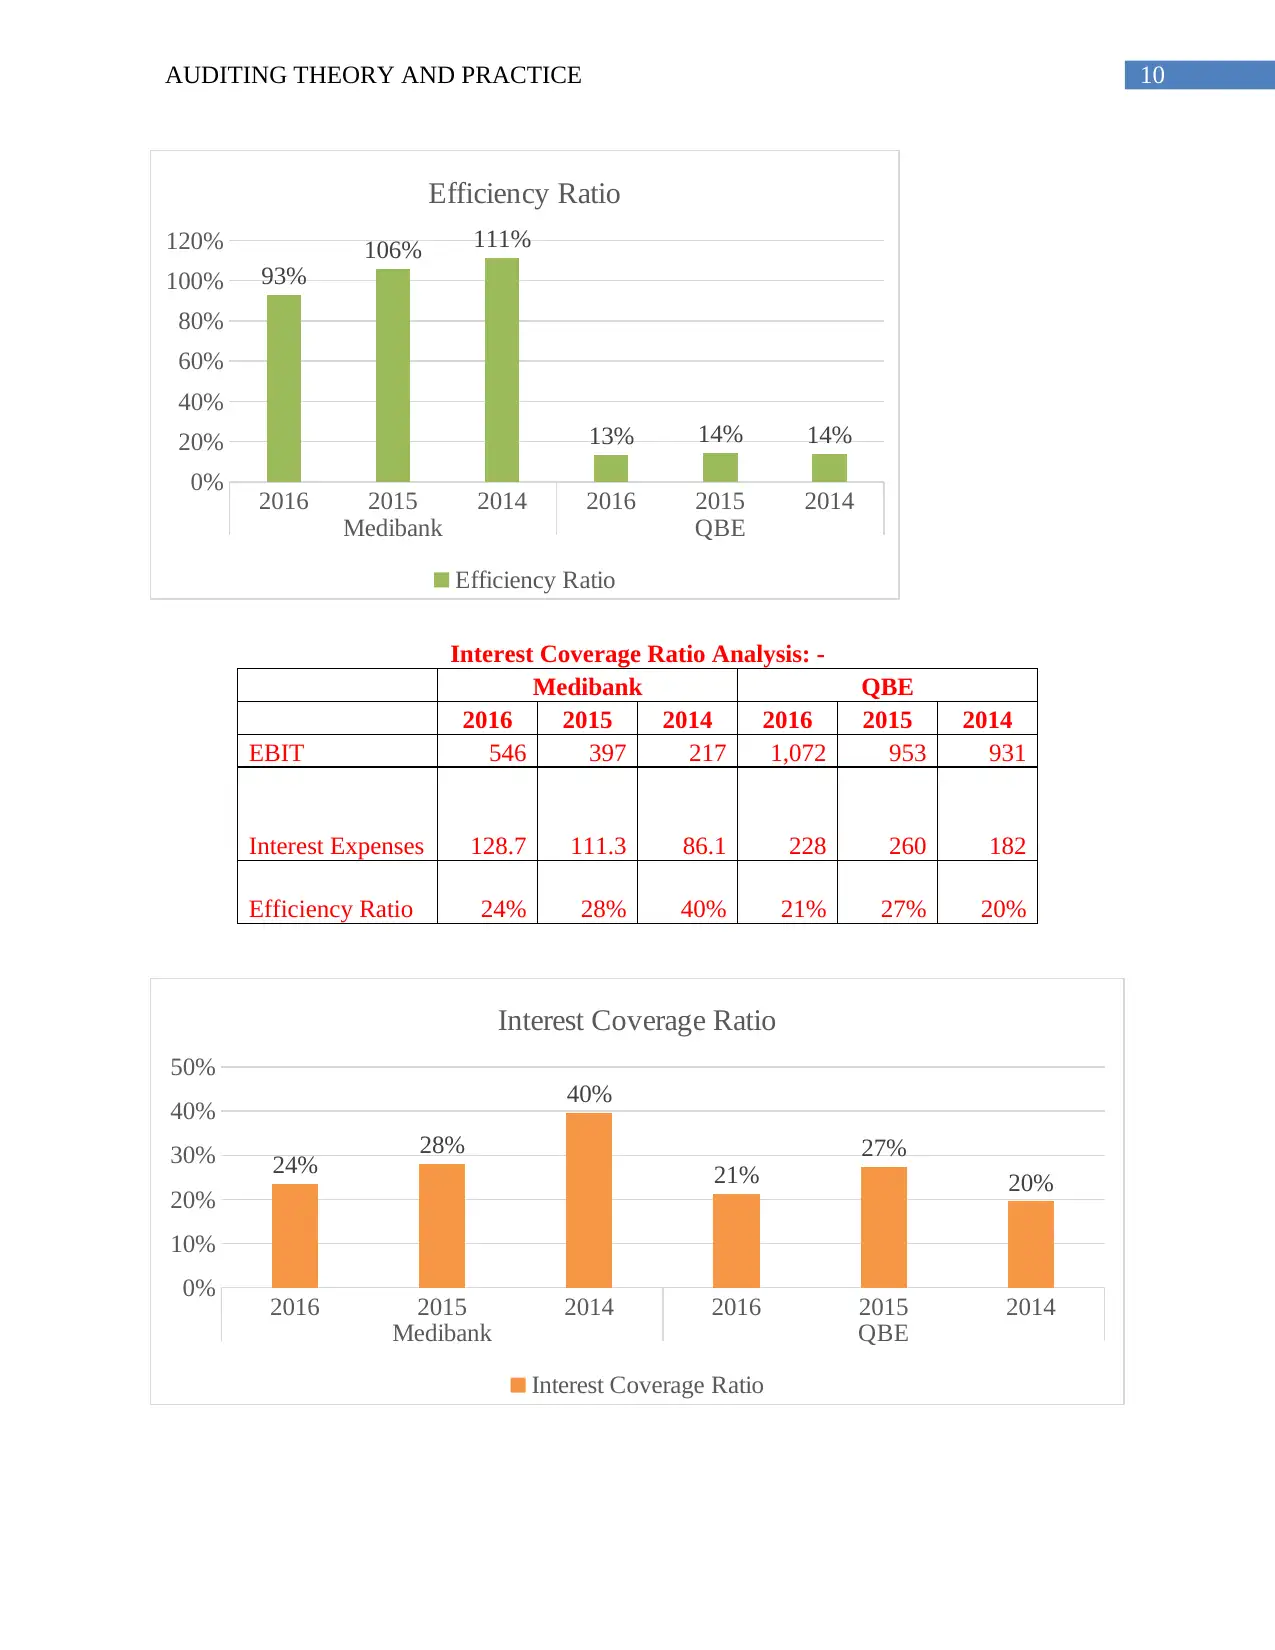
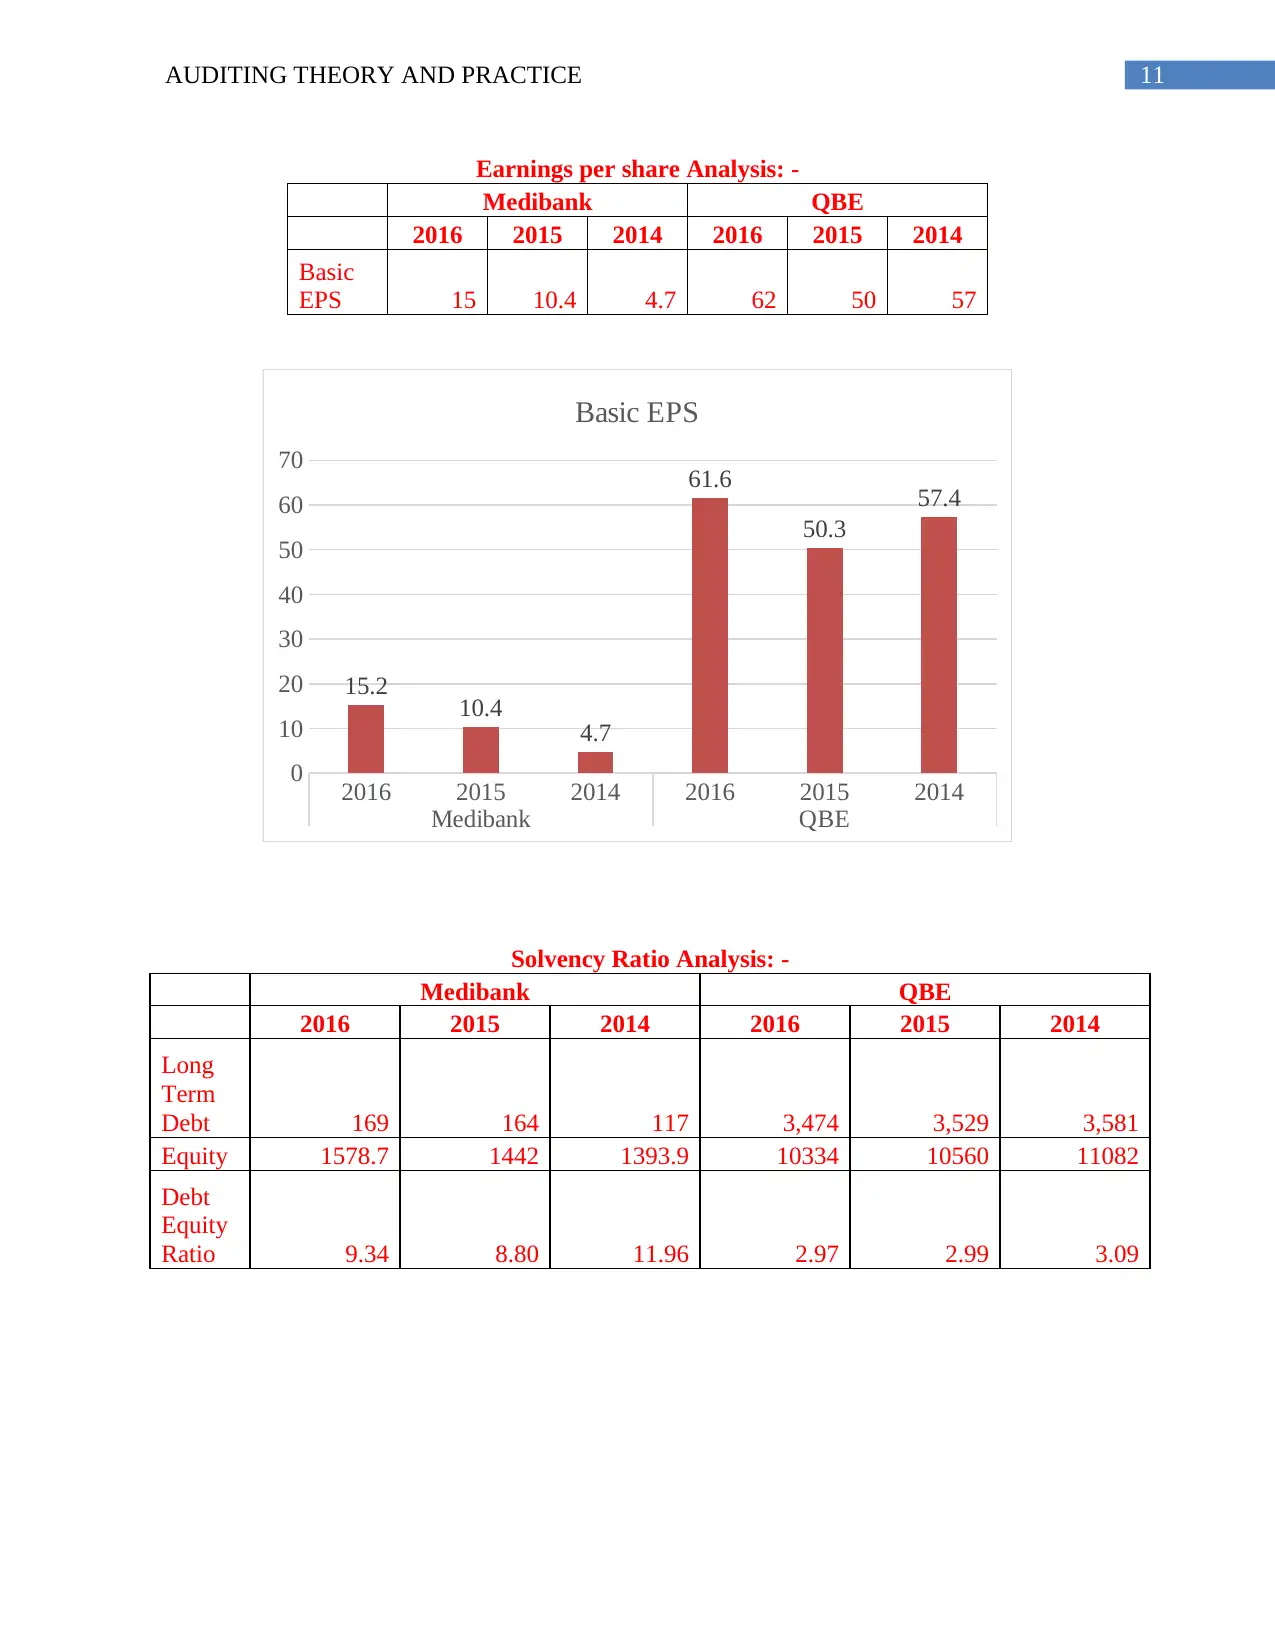
This report provides a comprehensive analysis of Medibank's auditing practices, focusing on risk analysis, evaluation of the control environment, and a comparison of its financial ratios with QBE Insurance Group. The report identifies key business risks, including healthcare costs, competition, product pricing, claims, capital management, and IT vulnerabilities. It examines the risk management framework and control measures implemented by Medibank to mitigate these risks. Furthermore, the report presents a detailed financial ratio analysis, comparing Medibank's profitability, liquidity, leverage, and operating margin with those of QBE Insurance, highlighting Medibank's stronger performance in profitability and liquidity. The conclusion emphasizes Medibank's proactive approach to addressing customer affordability and its efforts to manage risks effectively, supported by the financial data analysis.
Document Page
Running head: AUDITING THEORY AND PRACTICE
Auditing Theory and Practice
Name of Student:
Name of University:
Author’s Note:
tabler-icon-diamond-filled.svg

Paraphrase This Document

Need a fresh take? Get an instant paraphrase of this document with our AI Paraphraser
Document Page
1AUDITING THEORY AND PRACTICE
Table of Contents
Introduction......................................................................................................................................2
Risk Analysis...................................................................................................................................2
Evaluation of risks and control environment...................................................................................4
Conclusion.....................................................................................................................................12
References......................................................................................................................................13
Document Page
2AUDITING THEORY AND PRACTICE
Introduction
Medibank is considered has one of the best private health insurance company operating
in Australia. Some of the main noted services has been seen to be taken into consideration with
online health, telephone and initiatives for coaching programs in Australia. The important form
of the investment activities of the company is seen to be taken into account with the investment
activity in the community programs. The various types of the investment activities have been
further seen to be based on the support provided to the local programs for promoting child
healthcare activities. Some of the important aspects of the report has been able to cover risk
analysis, evaluation of risks and control environment. The several types of the aspects of the
executive report are further compared with QBE Insurance Group (Cannon & Bedard, 2017).
Risk Analysis
As per the capital management and dividends statements it is identified that the various
type of the profile maintained for the strong financial risk profile are seen to be conducive to
meet the financial commitments. From the risk analysis facts given in the annual report of the
company it is discerned that the company’s total health insurance business related to the capital
is seen to be business-related capital of 13.9 percent of premium revenue. Some of the inherent
material business risks of the company has been seen to be taken into account with healthcare
costs and utilisation, competition and customer retention, product pricing and design, improper
claims, capital management, investment returns, healthcare provider agreements, information
technology and regulation (Dennis, 2015).
Inherent Risk Control Measures
Increasing nature of the health care cost and
utilisation are seen to be based on the several
types of the factors which is related to the
increasing healthcare costs and effect on the
product margin. This has seen to erode the
various type of the values which is seen to be
Medibank is seen to be prompt enough for
addressing the long-term affordability of the
customer’s approach which has stated with
the long-term affordability for the customers.
The private health insurers and comparison of
the data is done in the website, competing to
Document Page
3AUDITING THEORY AND PRACTICE
related to the reducing cover (Hu, Chen, &
We, 2016).
attract and retain the members on price,
channels and services.
The new entrants are seen to be having the
option for partnering with the existing
participants, which is major threat to the
insurance business in Medibank
Medibank is seen to be continually assessing
the product and the channel mix for the
optimisation of the margins which is seen to
be based on the ensuring competitive
approach (Rathnayaka, Khan, & Amyotte,
2014).
The different types of the products may at
times get mispriced or incorrectly designed
which will be subject to government approval.
The product profitability is seen to be closely
monitored and compared with the actuarially-
derived costings.
The various types of the improper claims for
the material source is further seen to be
having several types of misrepresentation
associated to the fraudulent and erroneous
health claims done by the members and the
service providers.
The company is able to manage such risk with
payment integrity program focusing on the
identification, recovery, prevention and the
recovery of the improper claims (Hosseinpour
& Jans, 2016).
The capital management team of the
Medibank is seen to provide the significant
nature of the factors resulted from investment
portfolio which is seen to be subject to ten
oral market risks.
These types of the market risks have been
further seen to be classified with the interest
exchange rates and market volatility which
can have a significant effect on the income
volatility. The company is able to manage
such risk with the use of capital and
investments which are seen to be in line with
the varied factors associated to the risk
appetite and investment (Habib, Jiang,
Bhuiyan, & Islam, 2014). In addition, this,
Medibank strives to reach the agreement of
the risk based on the attaining a certain
agreement with the providers, contingency
plans which are seen to be in favour with the
tabler-icon-diamond-filled.svg

Paraphrase This Document

Need a fresh take? Get an instant paraphrase of this document with our AI Paraphraser
Document Page
4AUDITING THEORY AND PRACTICE
negotiation scenarios.
The information technology for Medibank has
been seen to be prone to cyber-attacks and
failure in the critical data, systems and
processes.
The IT controls are under continuous review
which are protected with the use of response
tools and preventive measures. The
government regulation and policy is further
seen to be susceptible to changes potentially
decreasing the effectiveness of the regulatory
incentives resulting in the members reducing
level of cover (Glover, Taylor, & Wu, 2017).
Evaluation of risks and control environment
The risk management framework for Medibank is seen to clearly set out with the number
of the factors which are clearly defined criteria for analysis. The evaluation and the prioritisation
is done as per material business risks. Some of the main factors are included with the systematic
risk consequence in compare to the impact on the clinical governance, safety, position, financial
performance and health. The company is also able to set out the main criteria for assessment of
the effectiveness of the control environment (Khalil, Saffar, & Trabelsi, 2015).
Comparison of the financial ratios with QBE Insurance
QBE Insurance Group Limited is considered as Australia’s one of the largest global
insurers. The company has provided the different aspects for serving in areas such as “Australia,
America, Europe and Asia Pacific region”. The financial ratio analysis is computed as per
profitability, liquidity and Ratio for leverage and operating margin Analysis. QBE is considered
as the main competitor for Medibank (Kachelmeier, Majors, & Williamson, 2014).
Profitability Ratio Analysis: -
Medibank QBE
Document Page
5AUDITING THEORY AND PRACTICE
Particulars 2016 2015 2014 2016 2015 2014
Revenue (A) 6741.8 5934.8 5648.7 14276 14922 16521
Net Profit/Loss (D) 417.6 285.3 130.8 844 687 742
Common Stock(H) 1579 1442 1394 10334 10560 11082
Net Profit Margin (D/A) 6.19% 4.81% 2.32% 5.91% 4.60% 4.49%
Return on Equity (A/H)) 26% 20% 9.38% 8% 7% 7%
Based on the return on equity analysis Medibank is seen to be in a slightly better position
in terms of return on equity. The competitor company QBE is able to achieve only 8% in 2014,
7% in 2015 and 7% in 2016. In compare to this Medibank has achieved 20% profitability ratio in
2015 and 26% profitability ratio in 2016.
The net profit margin analysis clearly shows that Medibank is in a better position in
compare to its competitors. This is seen with the increasing net profit margin of 2.32% in 2014,
4.81% in 2015 and 6.19 in 2016. The risk of Medibank in terms of the Medibank is seen to be
comparatively lesser than QBE insurance.
2016 2015 2014 2016 2015 2014
0%
5%
10%
15%
20%
25%
30% 26%
20%
9%
8% 7% 7%
Return on Equity
Medibank
QBE
Document Page
6AUDITING THEORY AND PRACTICE
2016 2015 2014
0.00%
1.00%
2.00%
3.00%
4.00%
5.00%
6.00%
7.00% 6.19%
4.81%
2.32%
5.91%
4.60% 4.49%
Net Profit Margin
Medibank
QBE
c) Short-Term Liquidity Ratio Analysis: -
Medibank QBE
2016 2015 2014 2016 2015 2014
Total Current Assets (A) 2812.5 2726.6 2557.5 30103
3167
7 33336
Total Current Liabilities (F) 1518.5 1535 1463.9 31249
3161
6 33918
Current Ratio (A/F) 1.85 1.78 1.75 0.96 1.00 0.98
The short-term liquidity analysis depictions have been further able to show that
Medibank has higher assets to cover the liabilities. This is seen to be evident with 1.75 in 2014,
1.78 in 2015 and 1.85 in 2016. It needs to be further discerned that the competitors company
QBE has not been able to meet the liability requirement with only 0.96 current ratio in 2016.
tabler-icon-diamond-filled.svg

Paraphrase This Document

Need a fresh take? Get an instant paraphrase of this document with our AI Paraphraser
Document Page
7AUDITING THEORY AND PRACTICE
2016 2015 2014
0.00
0.20
0.40
0.60
0.80
1.00
1.20
1.40
1.60
1.80
2.00
0.96 1.00 0.98
1.85 1.78 1.75
Current Ratio
QBE
Medibank
Ratio for leverage and operating margin Analysis: -
Medibank QBE
2016 2015 2014 2016 2015 2014
Revenue (C) 6,742 5,935 5,649 14,276 14,922 16,521
Net Profit/Loss (D) 418 285 131 844 687 742
Total Liabilities (K) 1,688 1,699 1,580 31,249 31,616 33,918
Shareholder's Equity (J) 1,579 1,442 1,394 10,334 10,560 11,082
Operating Income (L) 352 377 313 559 -16 332
Total Current Assets (A) 2,813 2,727 2,558 30,103 31,677 33,336
Leverage Ratio (J/K) 1.07 1.18 1.13 3.02 2.99 3.06
Operating Margin (L/C) 5.23% 6.35% 5.54% 3.92%
-
0.11% 2.01%
The depictions made as per the leverage ratio has shown that QBE Insurance is in a better
position. This is evident with 3.06 in 2014, 2.99 in 2015 and 3.02 in 2016. The Medibank
leverage ratio on the other hand is seen to be decreasing with 1.13 in 2014, 1.18 in 2015 and 1.07
in 2016 (Curtis, Humphrey, & Turley, 2016).
Document Page
8AUDITING THEORY AND PRACTICE
2016 2015 2014
0.00
0.50
1.00
1.50
2.00
2.50
3.00
3.50
1.07 1.18 1.13
3.02 2.99 3.06
Leverage Ratio
Medibank
QBE
The depictions made on the operating margin is further able to show that Medibank is in
a better position than its competitors. This is evident with 2.01% in 2014, 1.11% in 2015 and
3.92% in 2016. It is seen that the Medibank has a higher operating margin.
2016 2015 2014
-1.00%
0.00%
1.00%
2.00%
3.00%
4.00%
5.00%
6.00%
7.00%
5.23%
6.35%
5.54%
3.92%
-0.11%
2.01%
Operating margin
Medibank
QBE
Some of the other ration interpretations are stated below as follows:
Efficiency Ratio Analysis: -
Medibank QBE
2016 2015 2014 2016 2015 2014
Document Page
9AUDITING THEORY AND PRACTICE
Revenue 6,742
5,93
5 5,649
14,27
6
14,92
2
16,52
1
Expenses
6265.
3 6285
6279.
1 1922 2137 2274
Efficiency
Ratio 93%
106
% 111% 13% 14% 14%
tabler-icon-diamond-filled.svg

Paraphrase This Document

Need a fresh take? Get an instant paraphrase of this document with our AI Paraphraser
Document Page
10AUDITING THEORY AND PRACTICE
2016 2015 2014 2016 2015 2014
Medibank QBE
0%
20%
40%
60%
80%
100%
120%
93%
106% 111%
13% 14% 14%
Efficiency Ratio
Efficiency Ratio
Interest Coverage Ratio Analysis: -
Medibank QBE
2016 2015 2014 2016 2015 2014
EBIT 546 397 217 1,072 953 931
Interest Expenses 128.7 111.3 86.1 228 260 182
Efficiency Ratio 24% 28% 40% 21% 27% 20%
2016 2015 2014 2016 2015 2014
Medibank QBE
0%
10%
20%
30%
40%
50%
24% 28%
40%
21%
27%
20%
Interest Coverage Ratio
Document Page
11AUDITING THEORY AND PRACTICE
Earnings per share Analysis: -
Medibank QBE
2016 2015 2014 2016 2015 2014
Basic
EPS 15 10.4 4.7 62 50 57
2016 2015 2014 2016 2015 2014
Medibank QBE
0
10
20
30
40
50
60
70
15.2 10.4
4.7
61.6
50.3
57.4
Basic EPS
Solvency Ratio Analysis: -
Medibank QBE
2016 2015 2014 2016 2015 2014
Long
Term
Debt 169 164 117 3,474 3,529 3,581
Equity 1578.7 1442 1393.9 10334 10560 11082
Debt
Equity
Ratio 9.34 8.80 11.96 2.97 2.99 3.09
chevron_up_icon
1 out of 13
circle_padding
hide_on_mobile
zoom_out_icon
[object Object]