Exploring Attitudes & Biases on Medication for Child Mental Health
VerifiedAdded on 2023/06/04
|12
|1846
|376
Report
AI Summary
This research report investigates the attitudes and biases of parents regarding medication and psychotherapy for their children's mental health. A survey was conducted to gather data on parental perceptions, which was then statistically analyzed. The study reveals that older parents often hold misperceptions about psychological treatments for their children. The research explores views on psychotropic drugs and psychotherapy, examining how these biases influence parental behavior and medication procedures. The findings indicate a preference for psychotherapy over medication, with concerns raised about the risks of psychotropic drugs. The report also discusses the limitations of the study, including a small sample size, and suggests future research directions, such as interpretivist studies with semi-structured interviews. Desklib provides access to this document and a wealth of study tools for students.

Running head: PSYCHOLOGY SURVEY
Attitudes and Biases on Medication of Children for Mental Health Purposes
Name of the Student
Name of the University
Author note
Attitudes and Biases on Medication of Children for Mental Health Purposes
Name of the Student
Name of the University
Author note
Paraphrase This Document
Need a fresh take? Get an instant paraphrase of this document with our AI Paraphraser
1PSYCHOLOGY SURVEY
Abstract
The purpose of this research is to analyze the existing perception of parents on medication
and psychotherapy as a prescribed psychological treatment for their child. A survey has been
conducted on target population in order to collect data regarding the opinion of the
participants. Statistical analysis has been used to find the conclusion of the research. The
research has found that most of the older parents have some misperception in psychological
treatments when it comes to the prescribed method for their children.
Keywords: Psychotropic Drugs, children, parents, perception, psychotherapy
2PSYCHOLOGY SURVEY
Table of content
Abstract......................................................................................................................................1
Introduction................................................................................................................................4
Research question...................................................................................................................4
Brief literature review............................................................................................................4
Purpose...................................................................................................................................4
Prediction for Presentation.....................................................................................................5
Method.......................................................................................................................................5
Participants.............................................................................................................................5
Materials.................................................................................................................................5
Procedure................................................................................................................................6
Results........................................................................................................................................6
Discussion..................................................................................................................................6
Description and interpretation of findings relevant with research questions.........................7
Future scope...........................................................................................................................7
References..................................................................................................................................8
Figures........................................................................................................................................9
⊘ This is a preview!⊘
Do you want full access?
Subscribe today to unlock all pages.
Trusted by 1+ million students worldwide
3PSYCHOLOGY SURVEY
Introduction
Several studies have already argued that the parents have different biases and attitude
when it comes to provide the prescribed medication for their children for mental health. The
issue also cover the attitudes on the regular monitoring system on the medication
Research question
1. What are the views of the parent’s psychotropic drugs and the psychotherapy sessions
for the children who have mental illness?
2. How these biasness and attitude changes the behavior of the parents and the
medication procedure required for the children?
Brief literature review
According to Ross, Bridges, Ng, Wagner, Frosch, Reeves, and DosReis (2015), the
likeliness of psychological disorders or mental disorders in the young generation of America
is inclined more on while children rather than Hispanic children where the average
encountered cases have presented the ratio as 3:1. The cultural background and the social
perception play as the major factors behind the attitude and views of the American parents
(Schomerus, Matschinger, Baumeister, Mojtabai & Angermeyer, 2014).
Purpose
The purpose of this research is to explore the views of American parents on
psychotropic drugs and the psychotherapies prescribed for their children as well as how these
perceptions effects the medication procedure of the young generation.
Paraphrase This Document
Need a fresh take? Get an instant paraphrase of this document with our AI Paraphraser
4PSYCHOLOGY SURVEY
Prediction for Presentation
As per the literature review and several other secondary sources it can be predicted
that most of the parents perceive the psychological treatment a less essential issue. Apart
from that, the biased mentality of the parents also implies another prediction that is most of
the parents prefer psychotherapy more than psychotropic drugs. Change in social perception
is a long term evolution procedure of mankind. Therefore, it can be assumed that newer
generation will be more aware of the essentiality of medication and psychotherapy of the
psychological treatment. Hence, the third perdition of this research is Younger parents have
less believe on psychological treatment than older parents do.
Method
Participants
The participants of this research are selected by the random sampling method. The
target participants are aged from nineteen to seventy nine. From the given responses of the
participants twenty three responses have been selected for data analysis. The participants
have diverse demographical and marital status.
Materials
The data collection process of this research has used online survey as the tool. The
structure of the survey comprised of structured questioners. In this survey both
demographical and close ended questions are used with Likert scaling method (Fassinger &
Morrow, 2013). The survey session has been conducted though distributing the survey sheets
as physical documents to all the target participants.
5PSYCHOLOGY SURVEY
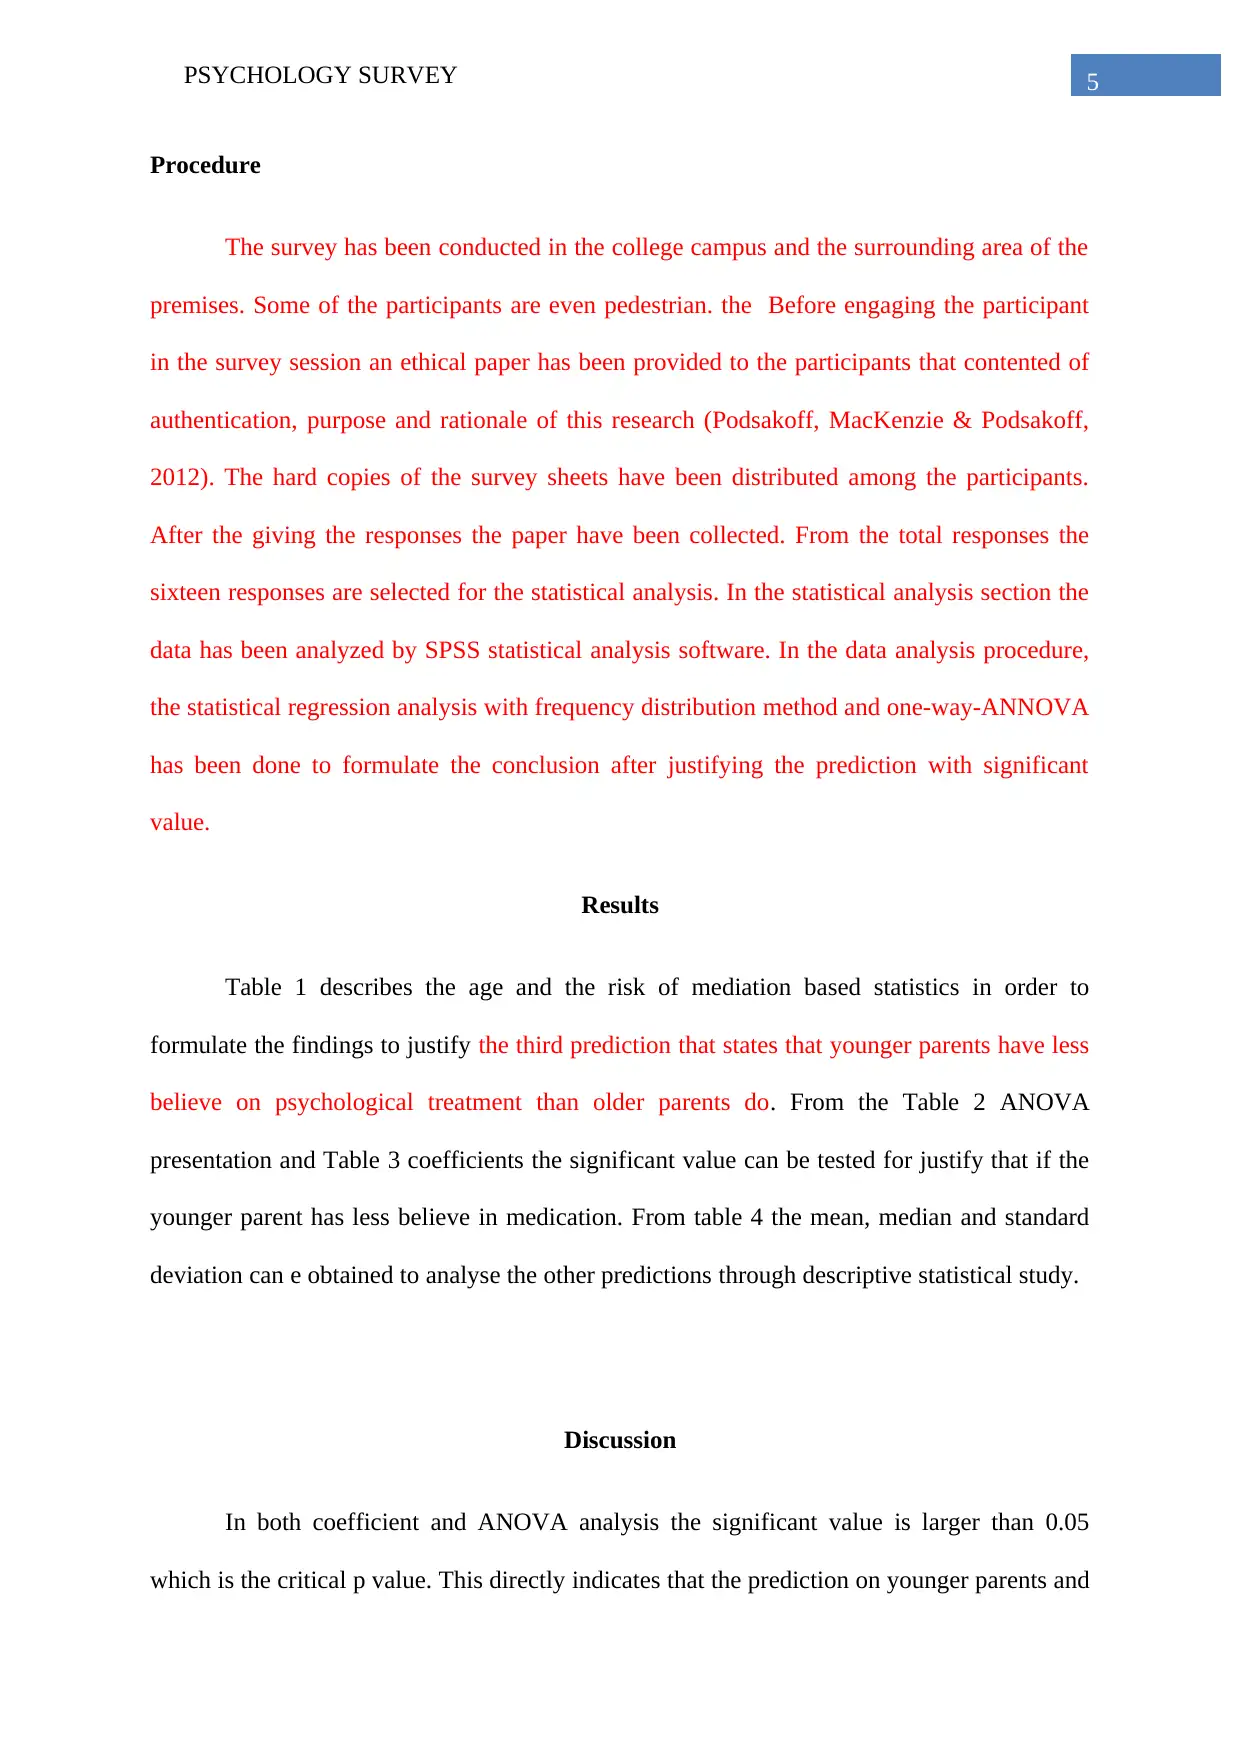
Procedure
The survey has been conducted in the college campus and the surrounding area of the
premises. Some of the participants are even pedestrian. the Before engaging the participant
in the survey session an ethical paper has been provided to the participants that contented of
authentication, purpose and rationale of this research (Podsakoff, MacKenzie & Podsakoff,
2012). The hard copies of the survey sheets have been distributed among the participants.
After the giving the responses the paper have been collected. From the total responses the
sixteen responses are selected for the statistical analysis. In the statistical analysis section the
data has been analyzed by SPSS statistical analysis software. In the data analysis procedure,
the statistical regression analysis with frequency distribution method and one-way-ANNOVA
has been done to formulate the conclusion after justifying the prediction with significant
value.
Results
Table 1 describes the age and the risk of mediation based statistics in order to
formulate the findings to justify the third prediction that states that younger parents have less
believe on psychological treatment than older parents do. From the Table 2 ANOVA
presentation and Table 3 coefficients the significant value can be tested for justify that if the
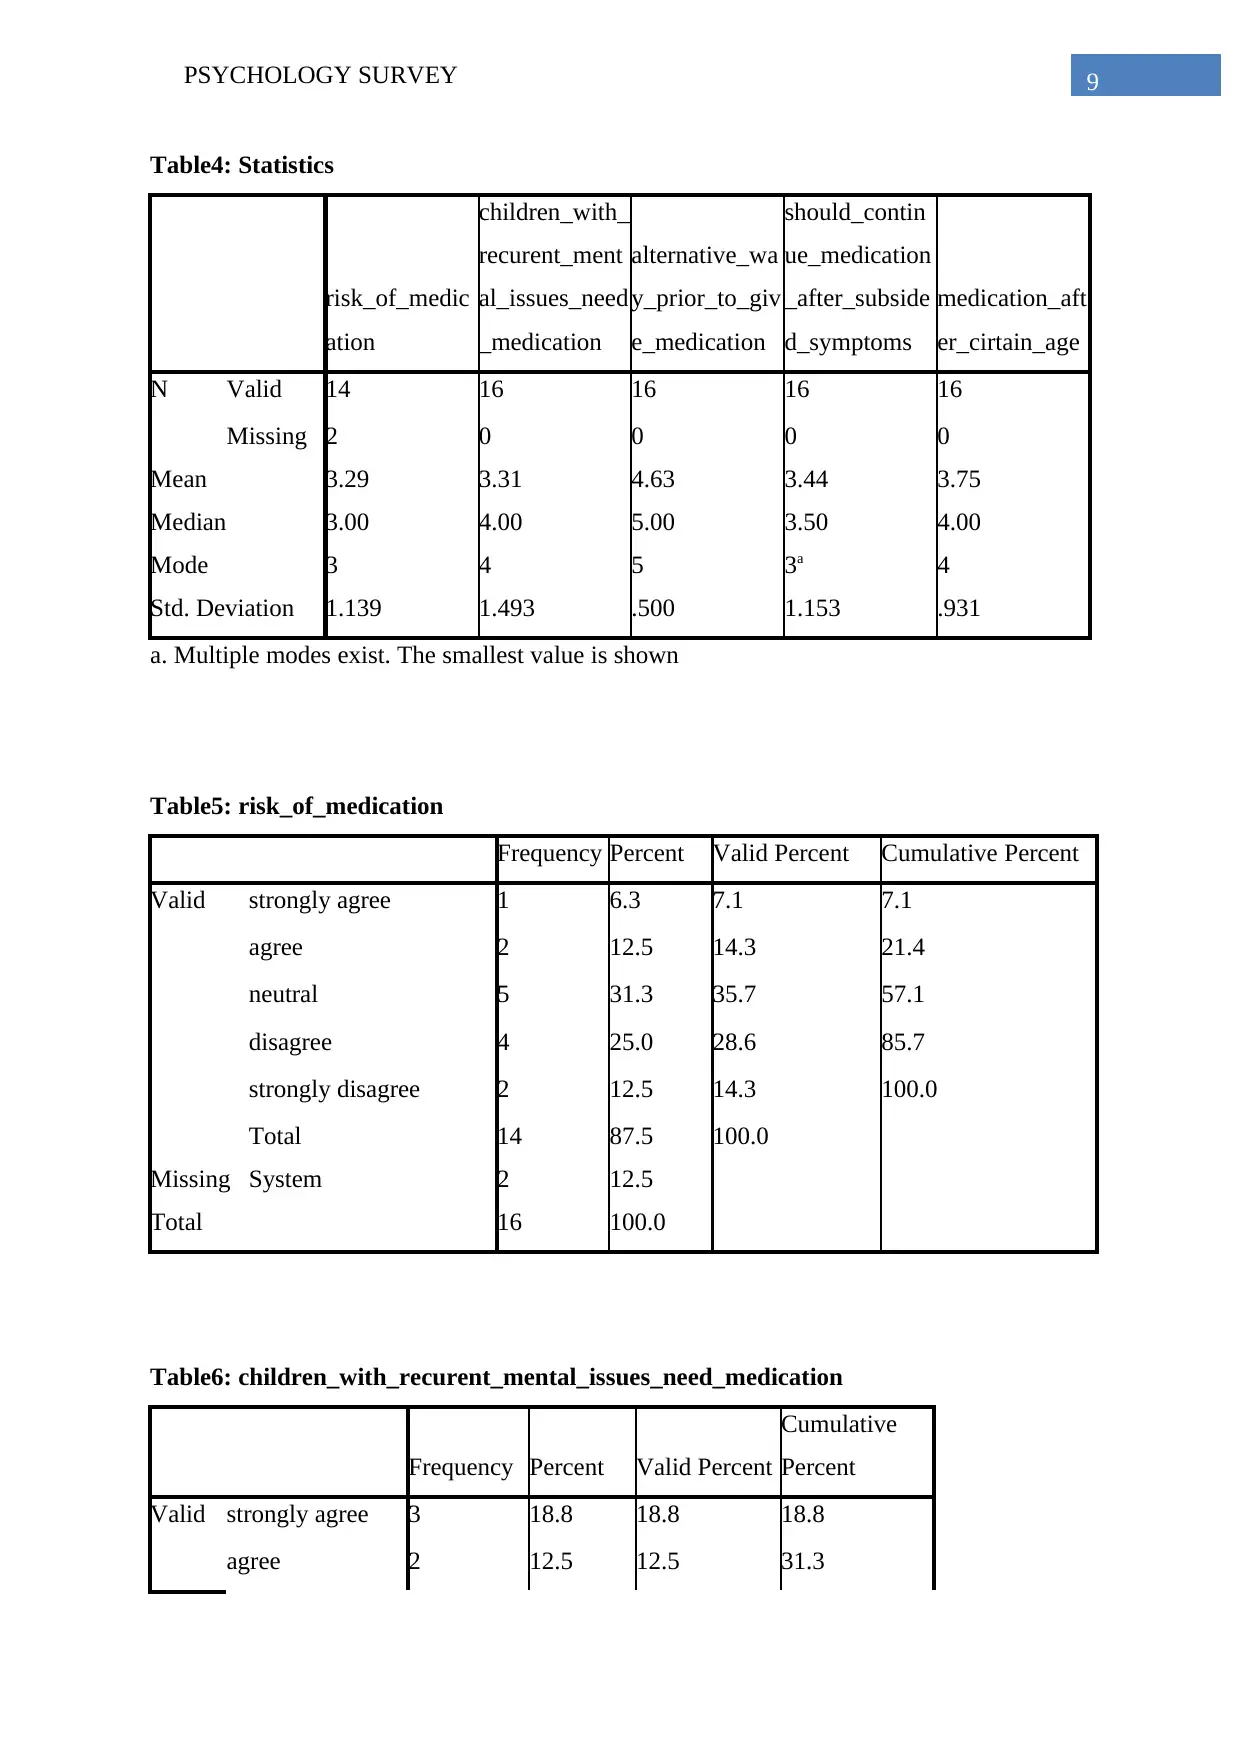
younger parent has less believe in medication. From table 4 the mean, median and standard
deviation can e obtained to analyse the other predictions through descriptive statistical study.
Discussion
In both coefficient and ANOVA analysis the significant value is larger than 0.05
which is the critical p value. This directly indicates that the prediction on younger parents and
Procedure
The survey has been conducted in the college campus and the surrounding area of the
premises. Some of the participants are even pedestrian. the Before engaging the participant
in the survey session an ethical paper has been provided to the participants that contented of
authentication, purpose and rationale of this research (Podsakoff, MacKenzie & Podsakoff,
2012). The hard copies of the survey sheets have been distributed among the participants.
After the giving the responses the paper have been collected. From the total responses the
sixteen responses are selected for the statistical analysis. In the statistical analysis section the
data has been analyzed by SPSS statistical analysis software. In the data analysis procedure,
the statistical regression analysis with frequency distribution method and one-way-ANNOVA
has been done to formulate the conclusion after justifying the prediction with significant
value.
Results
Table 1 describes the age and the risk of mediation based statistics in order to
formulate the findings to justify the third prediction that states that younger parents have less
believe on psychological treatment than older parents do. From the Table 2 ANOVA
presentation and Table 3 coefficients the significant value can be tested for justify that if the
younger parent has less believe in medication. From table 4 the mean, median and standard
deviation can e obtained to analyse the other predictions through descriptive statistical study.
Discussion
In both coefficient and ANOVA analysis the significant value is larger than 0.05
which is the critical p value. This directly indicates that the prediction on younger parents and
⊘ This is a preview!⊘
Do you want full access?
Subscribe today to unlock all pages.
Trusted by 1+ million students worldwide
6PSYCHOLOGY SURVEY
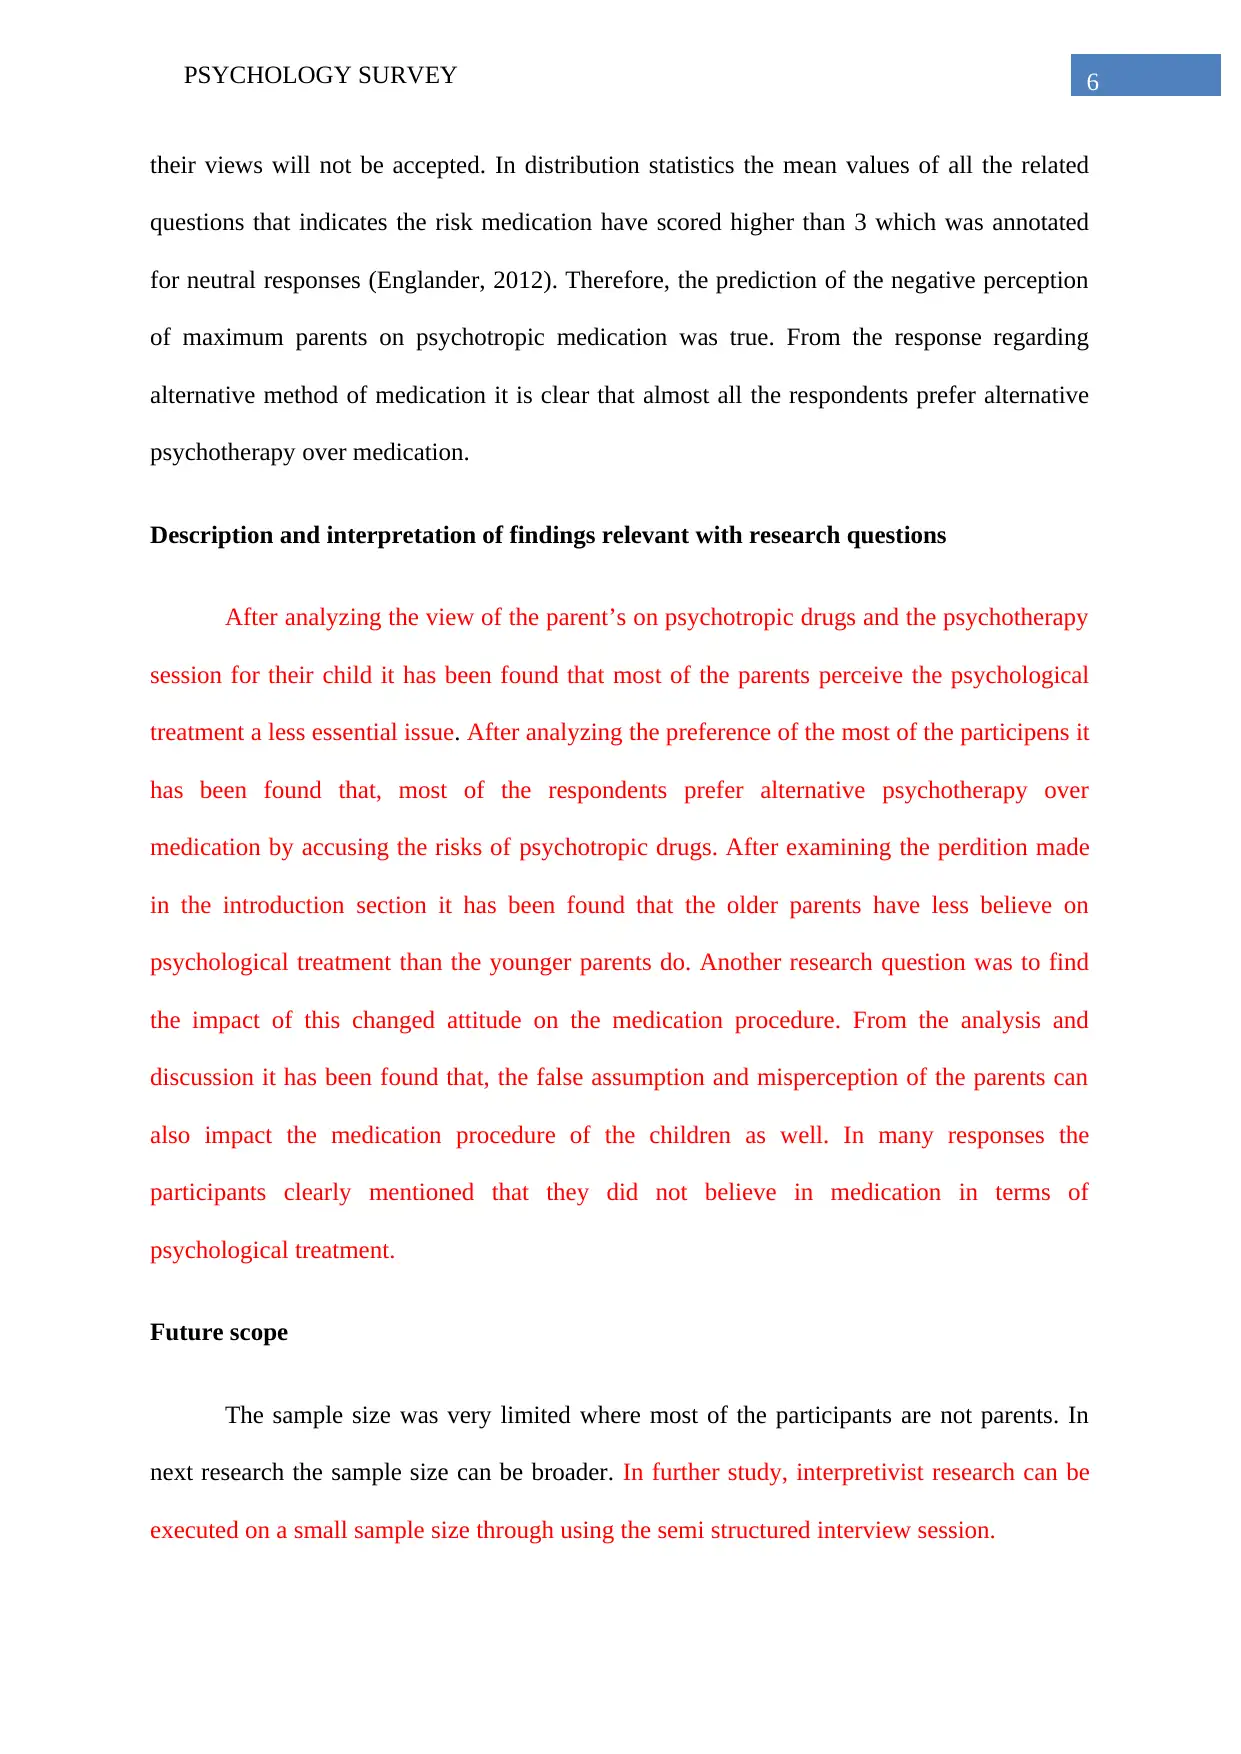
their views will not be accepted. In distribution statistics the mean values of all the related
questions that indicates the risk medication have scored higher than 3 which was annotated
for neutral responses (Englander, 2012). Therefore, the prediction of the negative perception
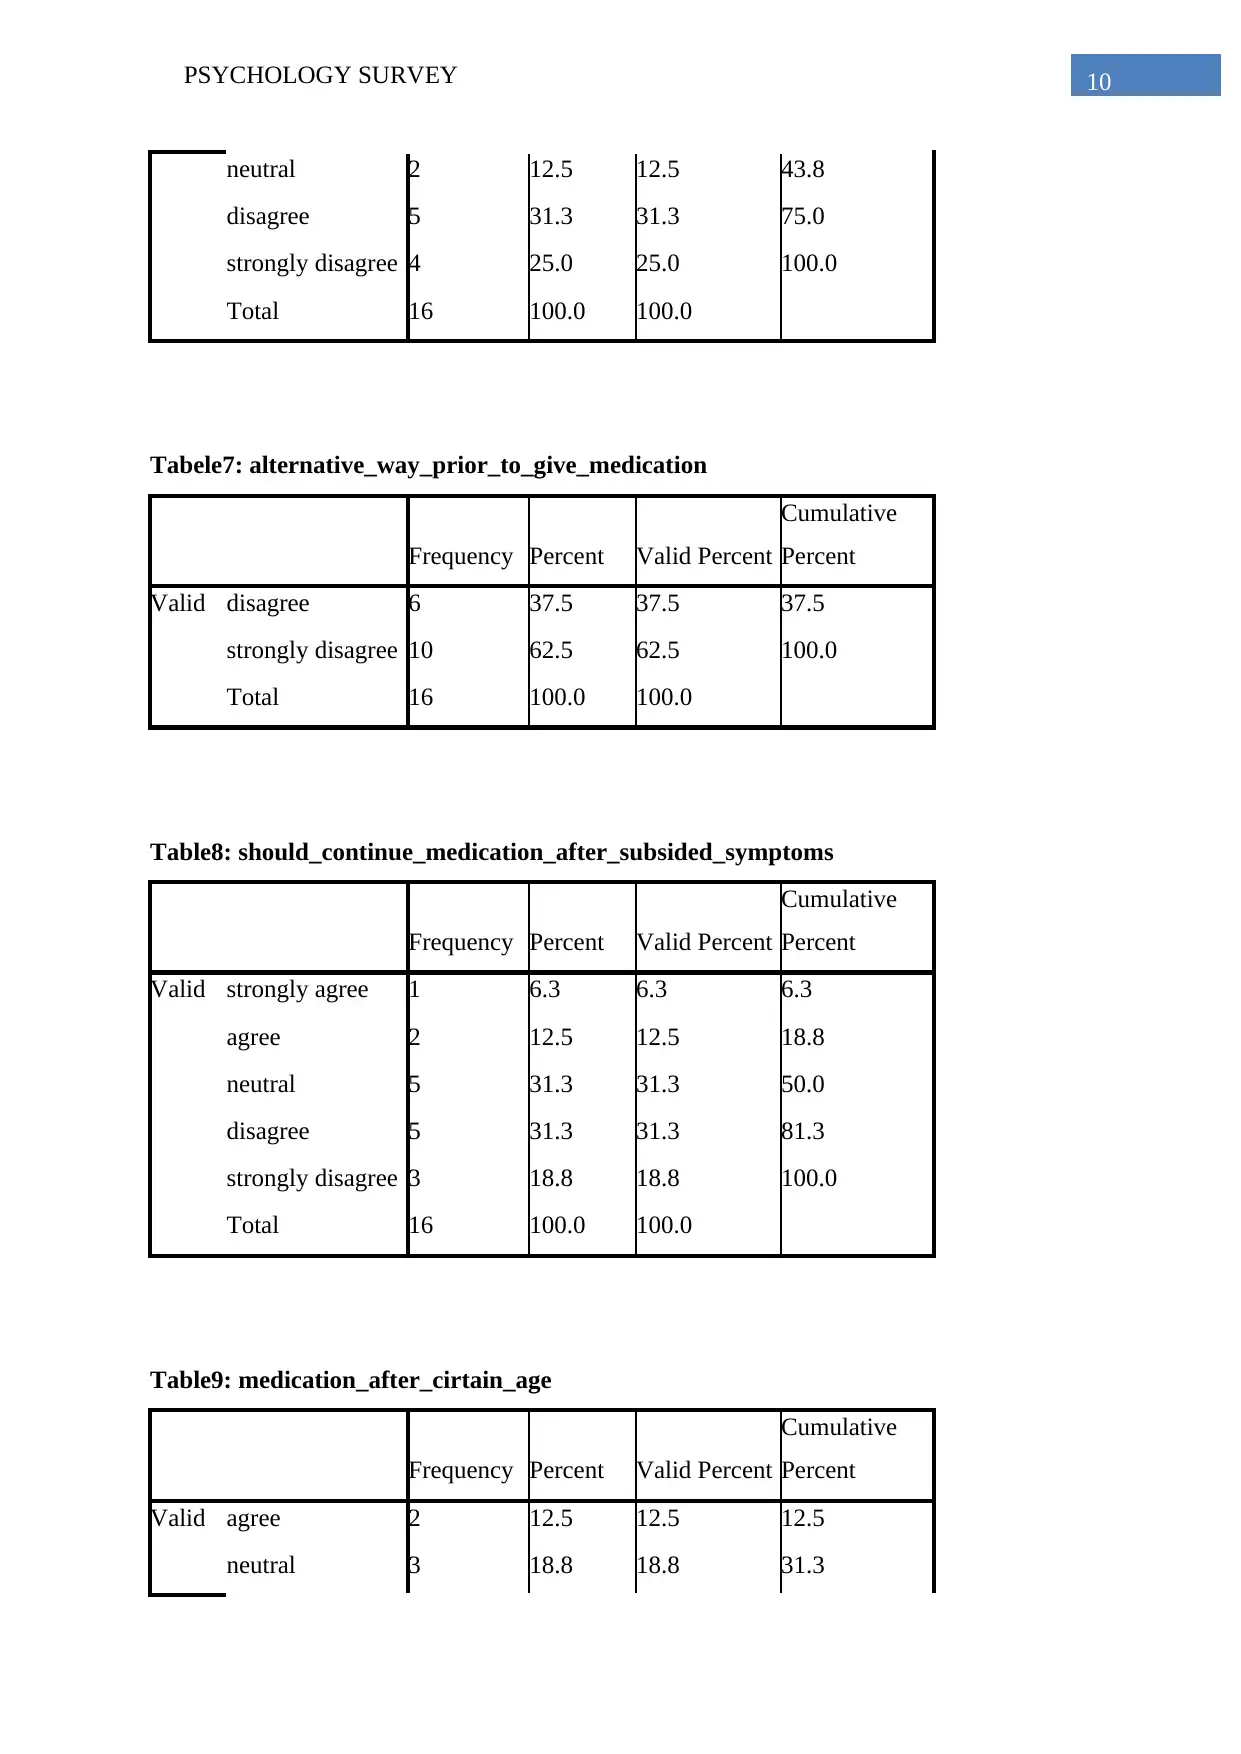
of maximum parents on psychotropic medication was true. From the response regarding
alternative method of medication it is clear that almost all the respondents prefer alternative
psychotherapy over medication.
Description and interpretation of findings relevant with research questions
After analyzing the view of the parent’s on psychotropic drugs and the psychotherapy
session for their child it has been found that most of the parents perceive the psychological
treatment a less essential issue. After analyzing the preference of the most of the participens it
has been found that, most of the respondents prefer alternative psychotherapy over
medication by accusing the risks of psychotropic drugs. After examining the perdition made
in the introduction section it has been found that the older parents have less believe on
psychological treatment than the younger parents do. Another research question was to find
the impact of this changed attitude on the medication procedure. From the analysis and
discussion it has been found that, the false assumption and misperception of the parents can
also impact the medication procedure of the children as well. In many responses the
participants clearly mentioned that they did not believe in medication in terms of
psychological treatment.
Future scope
The sample size was very limited where most of the participants are not parents. In
next research the sample size can be broader. In further study, interpretivist research can be
executed on a small sample size through using the semi structured interview session.
their views will not be accepted. In distribution statistics the mean values of all the related
questions that indicates the risk medication have scored higher than 3 which was annotated
for neutral responses (Englander, 2012). Therefore, the prediction of the negative perception
of maximum parents on psychotropic medication was true. From the response regarding
alternative method of medication it is clear that almost all the respondents prefer alternative
psychotherapy over medication.
Description and interpretation of findings relevant with research questions
After analyzing the view of the parent’s on psychotropic drugs and the psychotherapy
session for their child it has been found that most of the parents perceive the psychological
treatment a less essential issue. After analyzing the preference of the most of the participens it
has been found that, most of the respondents prefer alternative psychotherapy over
medication by accusing the risks of psychotropic drugs. After examining the perdition made
in the introduction section it has been found that the older parents have less believe on
psychological treatment than the younger parents do. Another research question was to find
the impact of this changed attitude on the medication procedure. From the analysis and
discussion it has been found that, the false assumption and misperception of the parents can
also impact the medication procedure of the children as well. In many responses the
participants clearly mentioned that they did not believe in medication in terms of
psychological treatment.
Future scope
The sample size was very limited where most of the participants are not parents. In
next research the sample size can be broader. In further study, interpretivist research can be
executed on a small sample size through using the semi structured interview session.
Paraphrase This Document
Need a fresh take? Get an instant paraphrase of this document with our AI Paraphraser
7PSYCHOLOGY SURVEY
References
Englander, M. (2012). The interview: Data collection in descriptive phenomenological
human scientific research. Journal of phenomenological psychology, 43(1), 13-35.
Fassinger, R., & Morrow, S. L. (2013). Toward Best Practices in Quantitative, Qualitative,
and Mixed-Method Research: A Social Justice Perspective. Journal for Social Action
in Counseling & Psychology, 5(2).
Podsakoff, P. M., MacKenzie, S. B., & Podsakoff, N. P. (2012). Sources of method bias in
social science research and recommendations on how to control it. Annual review of
psychology, 63, 539-569.
Ross, M., Bridges, J. F., Ng, X., Wagner, L. D., Frosch, E., Reeves, G., & DosReis, S.
(2015). A best-worst scaling experiment to prioritize caregiver concerns about ADHD
medication for children. Psychiatric Services, 66(2), 208-211.
Schomerus, G., Matschinger, H., Baumeister, S. E., Mojtabai, R., & Angermeyer, M. C.
(2014). Public attitudes towards psychiatric medication: a comparison between United
States and Germany. World Psychiatry, 13(3), 320-321.
8PSYCHOLOGY SURVEY
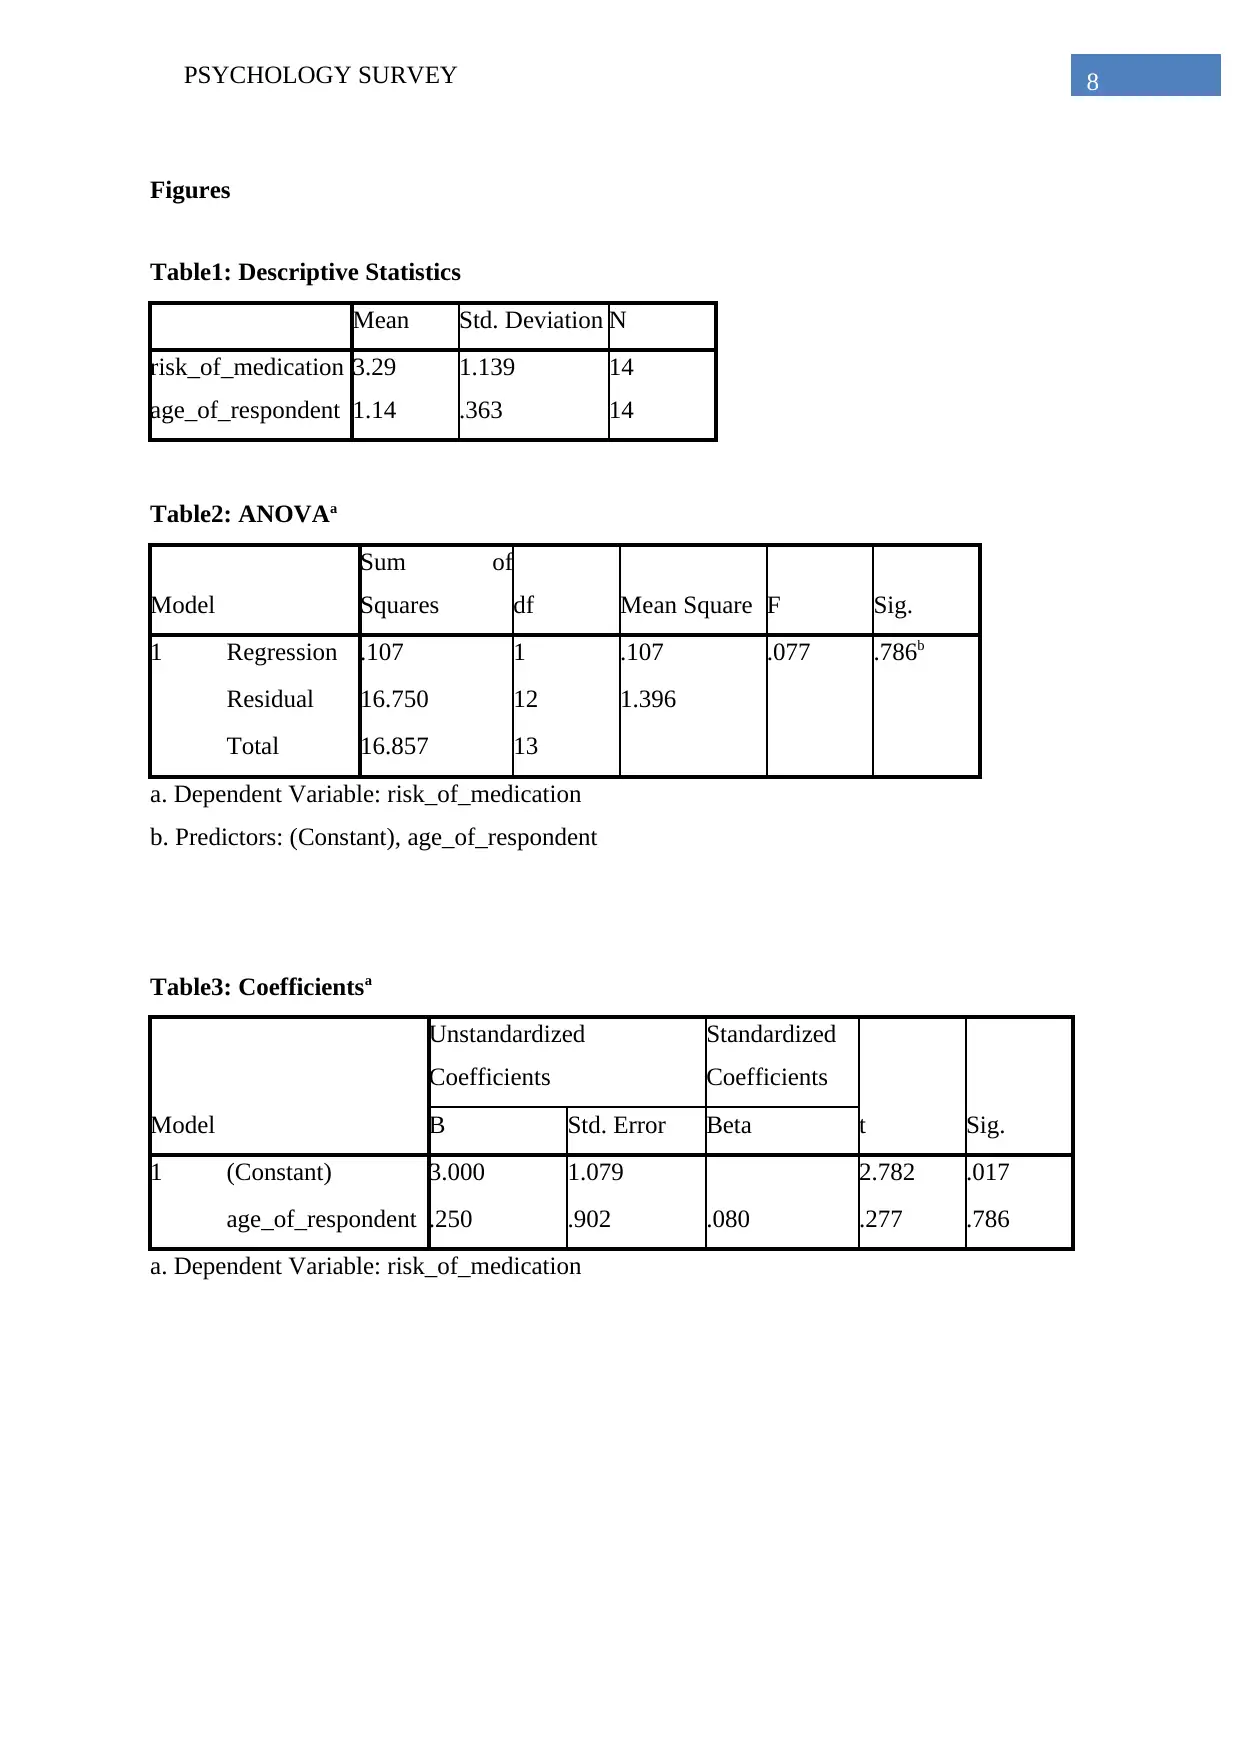
Figures
Table1: Descriptive Statistics
Mean Std. Deviation N
risk_of_medication 3.29 1.139 14
age_of_respondent 1.14 .363 14
Table2: ANOVAa
Model
Sum of
Squares df Mean Square F Sig.
1 Regression .107 1 .107 .077 .786b
Residual 16.750 12 1.396
Total 16.857 13
a. Dependent Variable: risk_of_medication
b. Predictors: (Constant), age_of_respondent
Table3: Coefficientsa
Model
Unstandardized
Coefficients
Standardized
Coefficients
t Sig.B Std. Error Beta
1 (Constant) 3.000 1.079 2.782 .017
age_of_respondent .250 .902 .080 .277 .786
a. Dependent Variable: risk_of_medication
⊘ This is a preview!⊘
Do you want full access?
Subscribe today to unlock all pages.
Trusted by 1+ million students worldwide
9PSYCHOLOGY SURVEY
Table4: Statistics
risk_of_medic
ation
children_with_
recurent_ment
al_issues_need
_medication
alternative_wa
y_prior_to_giv
e_medication
should_contin
ue_medication
_after_subside
d_symptoms
medication_aft
er_cirtain_age
N Valid 14 16 16 16 16
Missing 2 0 0 0 0
Mean 3.29 3.31 4.63 3.44 3.75
Median 3.00 4.00 5.00 3.50 4.00
Mode 3 4 5 3a 4
Std. Deviation 1.139 1.493 .500 1.153 .931
a. Multiple modes exist. The smallest value is shown
Table5: risk_of_medication
Frequency Percent Valid Percent Cumulative Percent
Valid strongly agree 1 6.3 7.1 7.1
agree 2 12.5 14.3 21.4
neutral 5 31.3 35.7 57.1
disagree 4 25.0 28.6 85.7
strongly disagree 2 12.5 14.3 100.0
Total 14 87.5 100.0
Missing System 2 12.5
Total 16 100.0
Table6: children_with_recurent_mental_issues_need_medication
Frequency Percent Valid Percent
Cumulative
Percent
Valid strongly agree 3 18.8 18.8 18.8
agree 2 12.5 12.5 31.3
Paraphrase This Document
Need a fresh take? Get an instant paraphrase of this document with our AI Paraphraser
10PSYCHOLOGY SURVEY
neutral 2 12.5 12.5 43.8
disagree 5 31.3 31.3 75.0
strongly disagree 4 25.0 25.0 100.0
Total 16 100.0 100.0
Tabele7: alternative_way_prior_to_give_medication
Frequency Percent Valid Percent
Cumulative
Percent
Valid disagree 6 37.5 37.5 37.5
strongly disagree 10 62.5 62.5 100.0
Total 16 100.0 100.0
Table8: should_continue_medication_after_subsided_symptoms
Frequency Percent Valid Percent
Cumulative
Percent
Valid strongly agree 1 6.3 6.3 6.3
agree 2 12.5 12.5 18.8
neutral 5 31.3 31.3 50.0
disagree 5 31.3 31.3 81.3
strongly disagree 3 18.8 18.8 100.0
Total 16 100.0 100.0
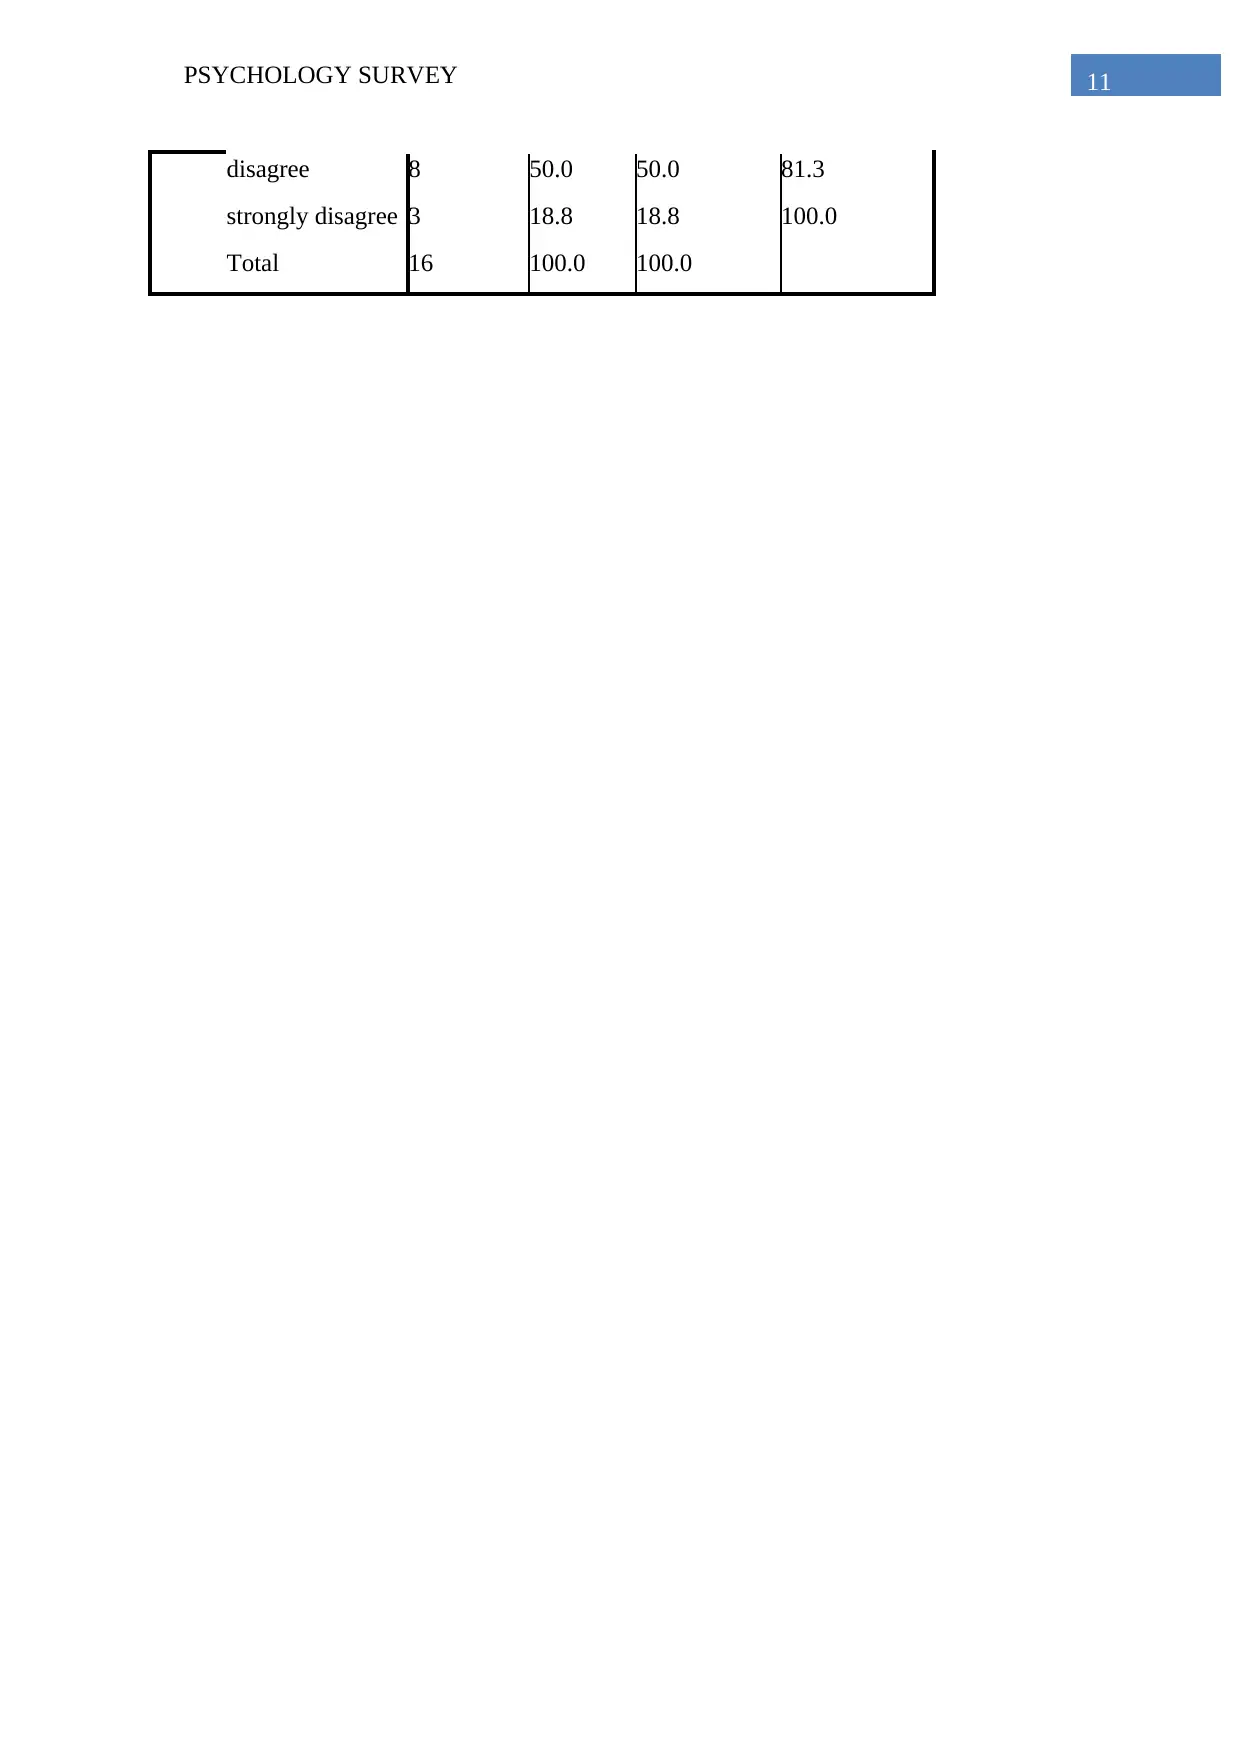
Table9: medication_after_cirtain_age
Frequency Percent Valid Percent
Cumulative
Percent
Valid agree 2 12.5 12.5 12.5
neutral 3 18.8 18.8 31.3
neutral 2 12.5 12.5 43.8
disagree 5 31.3 31.3 75.0
strongly disagree 4 25.0 25.0 100.0
Total 16 100.0 100.0
Tabele7: alternative_way_prior_to_give_medication
Frequency Percent Valid Percent
Cumulative
Percent
Valid disagree 6 37.5 37.5 37.5
strongly disagree 10 62.5 62.5 100.0
Total 16 100.0 100.0
Table8: should_continue_medication_after_subsided_symptoms
Frequency Percent Valid Percent
Cumulative
Percent
Valid strongly agree 1 6.3 6.3 6.3
agree 2 12.5 12.5 18.8
neutral 5 31.3 31.3 50.0
disagree 5 31.3 31.3 81.3
strongly disagree 3 18.8 18.8 100.0
Total 16 100.0 100.0
Table9: medication_after_cirtain_age
Frequency Percent Valid Percent
Cumulative
Percent
Valid agree 2 12.5 12.5 12.5
neutral 3 18.8 18.8 31.3
11PSYCHOLOGY SURVEY
disagree 8 50.0 50.0 81.3
strongly disagree 3 18.8 18.8 100.0
Total 16 100.0 100.0
disagree 8 50.0 50.0 81.3
strongly disagree 3 18.8 18.8 100.0
Total 16 100.0 100.0
⊘ This is a preview!⊘
Do you want full access?
Subscribe today to unlock all pages.
Trusted by 1+ million students worldwide
1 out of 12
Related Documents


Your All-in-One AI-Powered Toolkit for Academic Success.
+13062052269
info@desklib.com
Available 24*7 on WhatsApp / Email
![[object Object]](/_next/static/media/star-bottom.7253800d.svg)
Unlock your academic potential
Copyright © 2020–2026 A2Z Services. All Rights Reserved. Developed and managed by ZUCOL.