Data Analysis Report: Customer Shopping Patterns at Medistore

Verified

Added on  2022/09/21

|6
|694
|22
Report
AI Summary
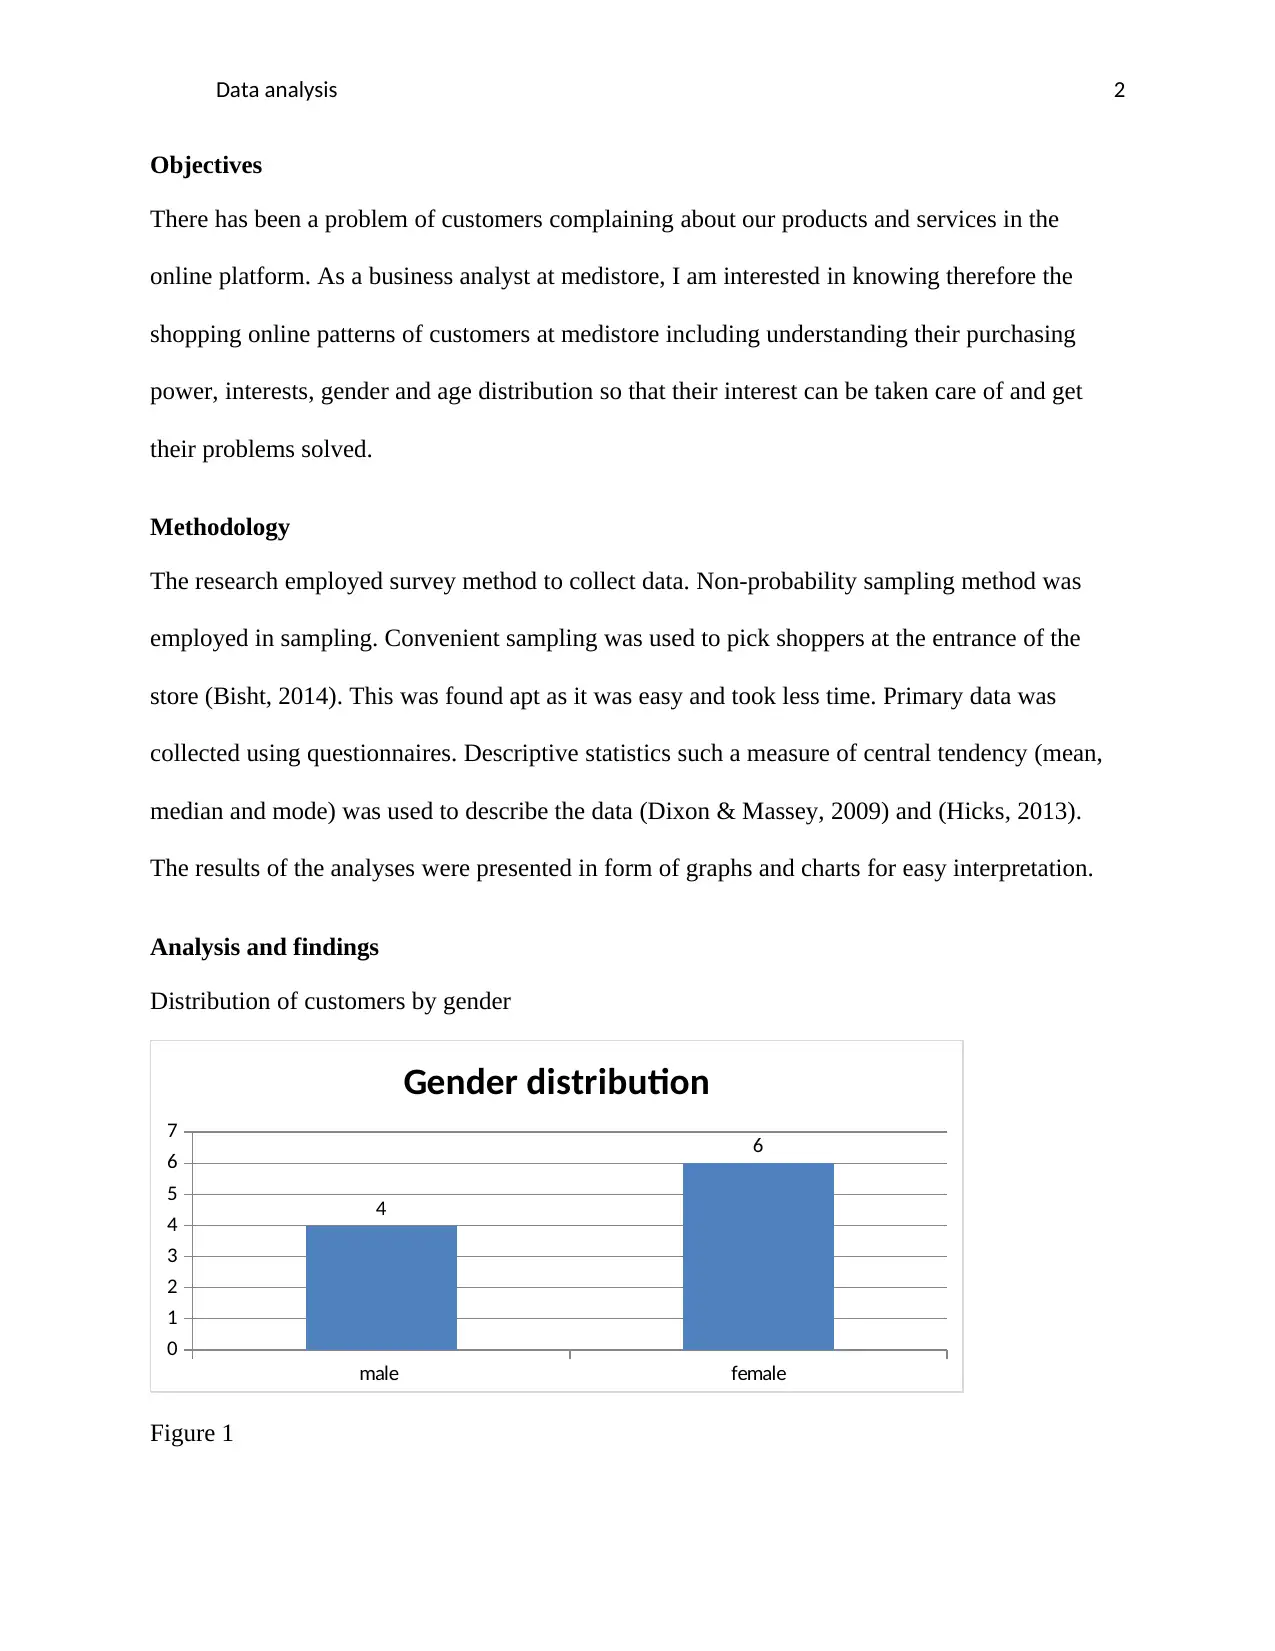
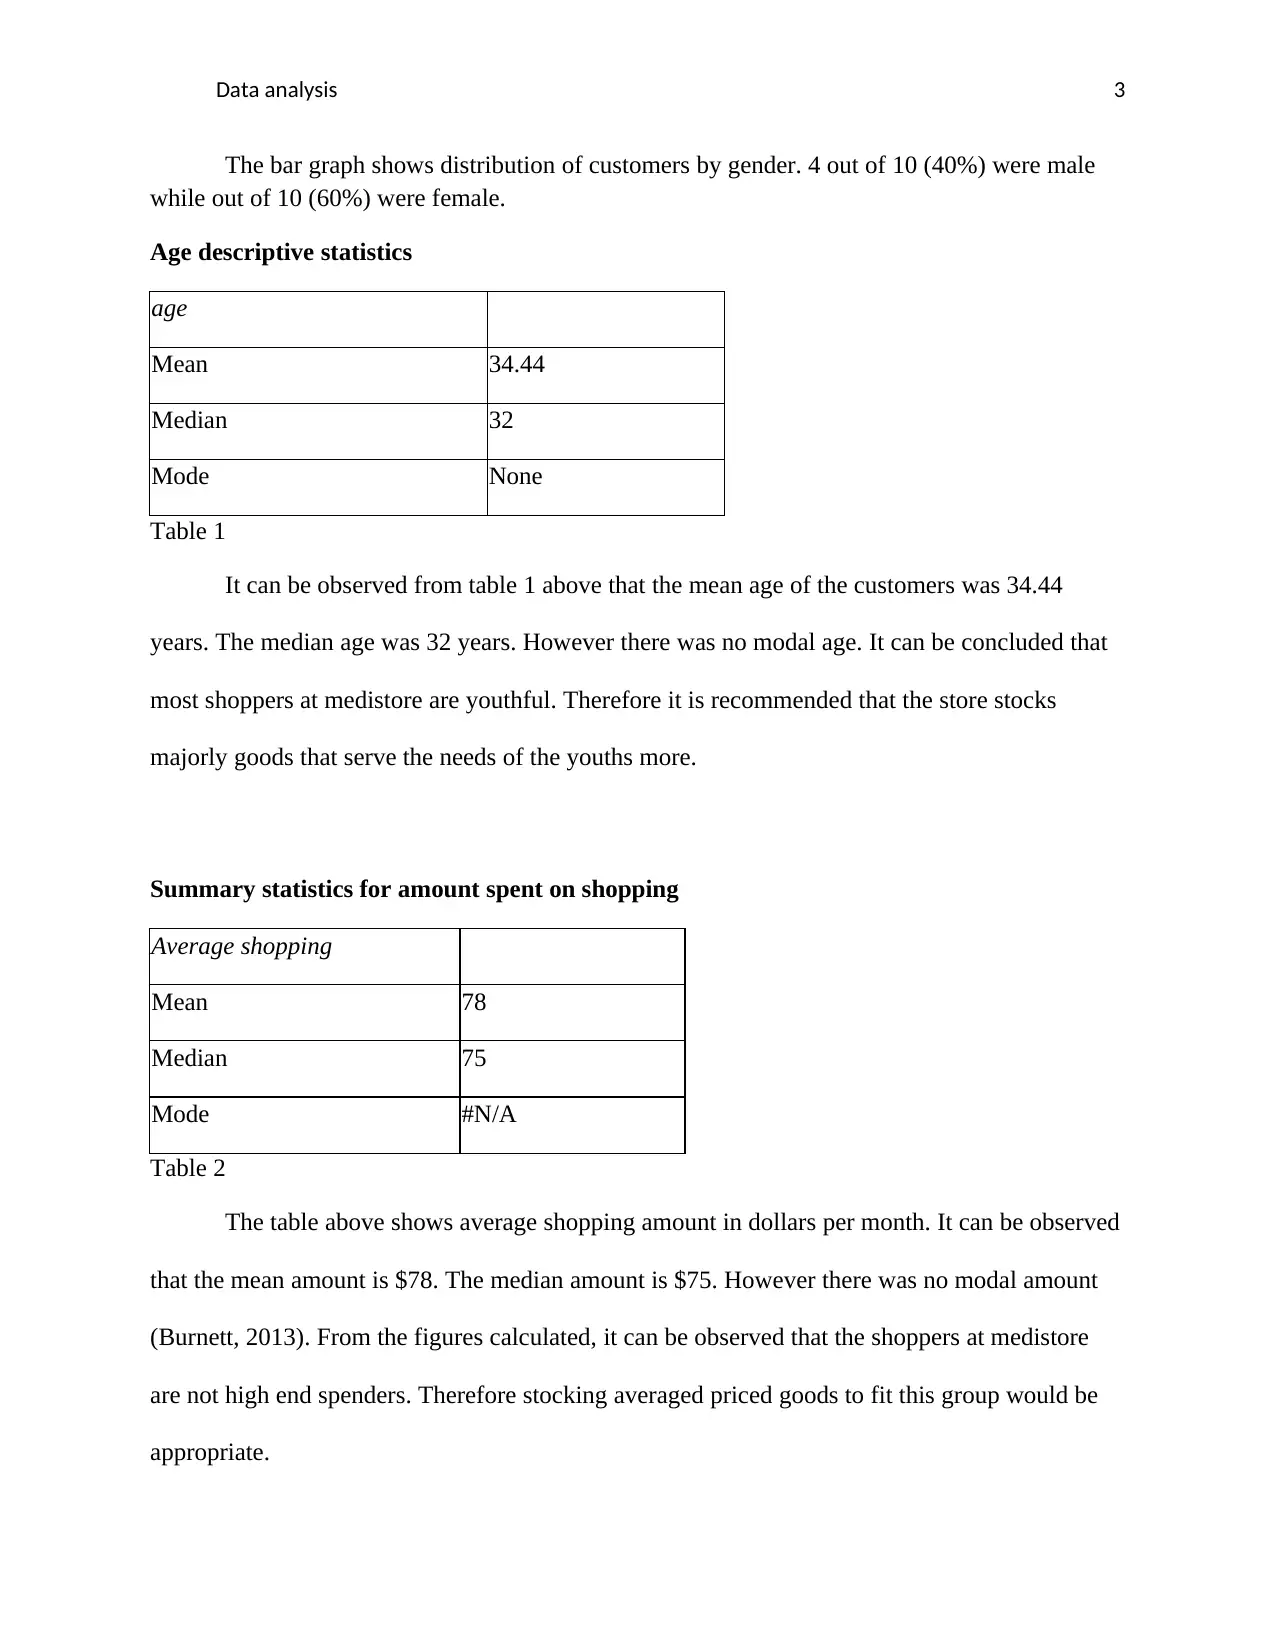
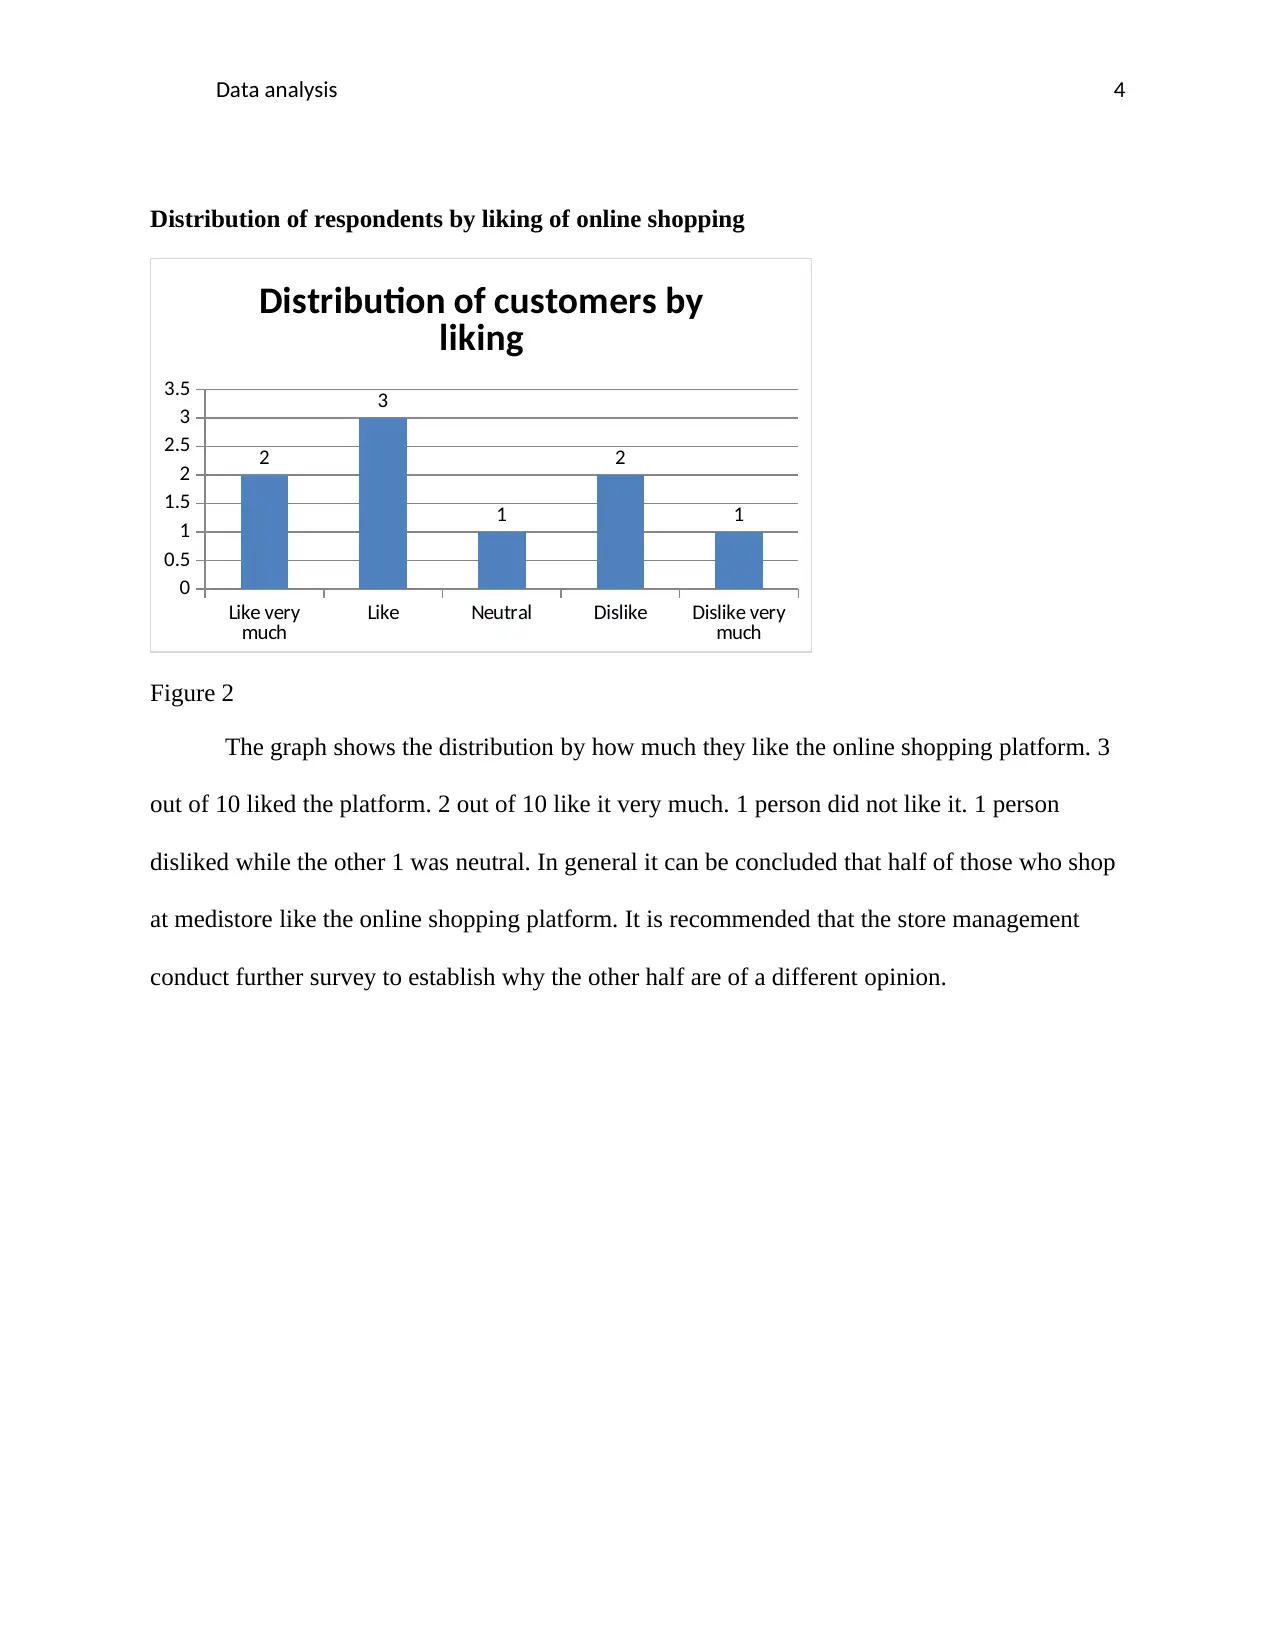
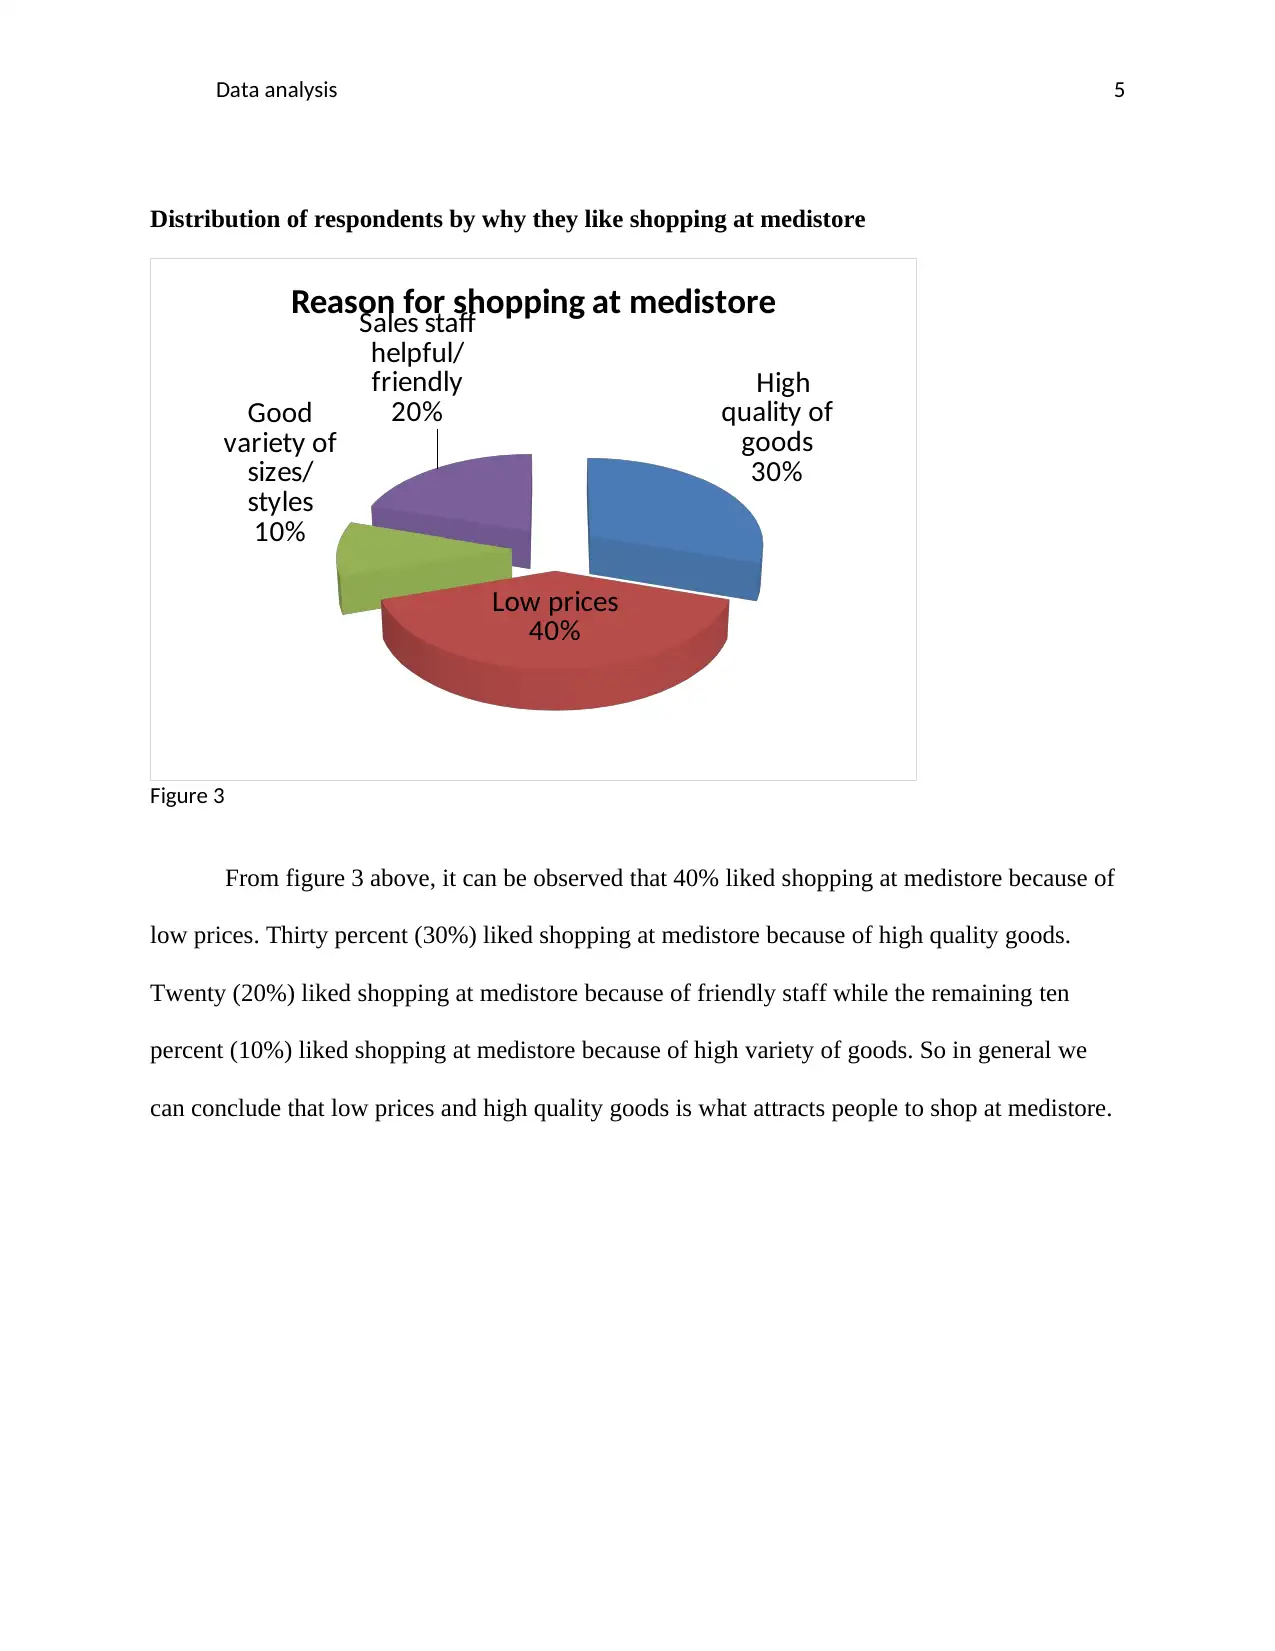
This report presents an analysis of customer shopping patterns at Medistore, based on a survey conducted to understand customer preferences and online behavior. The methodology involved a survey using a non-probability sampling method, with data collected through questionnaires and analyzed using descriptive statistics. The findings reveal the distribution of customers by gender, age, and spending habits. The mean age of customers was found to be 34.44 years, with no modal age, indicating a youthful customer base. The average shopping amount was $78, with a median of $75, suggesting that shoppers are not high-end spenders. The report also explores customer preferences for online shopping, with half of the respondents liking the platform. Key drivers for shopping at Medistore were identified as low prices and high-quality goods. The report concludes with recommendations for stocking products that serve the needs of the youth, averaging priced goods and conducting further surveys to understand the other half of the customers' opinions about online shopping. The analysis includes charts and graphs to present the data in an easily interpretable format, supporting the conclusions and recommendations made.
Document Page
Running head: Data analysis 1
Data Analysis
Course code:
Student:
Tutor:
tabler-icon-diamond-filled.svg

Paraphrase This Document

Need a fresh take? Get an instant paraphrase of this document with our AI Paraphraser
Document Page
Data analysis 2
Objectives
There has been a problem of customers complaining about our products and services in the
online platform. As a business analyst at medistore, I am interested in knowing therefore the
shopping online patterns of customers at medistore including understanding their purchasing
power, interests, gender and age distribution so that their interest can be taken care of and get
their problems solved.
Methodology
The research employed survey method to collect data. Non-probability sampling method was
employed in sampling. Convenient sampling was used to pick shoppers at the entrance of the
store (Bisht, 2014). This was found apt as it was easy and took less time. Primary data was
collected using questionnaires. Descriptive statistics such a measure of central tendency (mean,
median and mode) was used to describe the data (Dixon & Massey, 2009) and (Hicks, 2013).
The results of the analyses were presented in form of graphs and charts for easy interpretation.
Analysis and findings
Distribution of customers by gender
male female
0
1
2
3
4
5
6
7
4
6
Gender distribution
Figure 1
Document Page
Data analysis 3
The bar graph shows distribution of customers by gender. 4 out of 10 (40%) were male
while out of 10 (60%) were female.
Age descriptive statistics
age
Mean 34.44
Median 32
Mode None
Table 1
It can be observed from table 1 above that the mean age of the customers was 34.44
years. The median age was 32 years. However there was no modal age. It can be concluded that
most shoppers at medistore are youthful. Therefore it is recommended that the store stocks
majorly goods that serve the needs of the youths more.
Summary statistics for amount spent on shopping
Average shopping
Mean 78
Median 75
Mode #N/A
Table 2
The table above shows average shopping amount in dollars per month. It can be observed
that the mean amount is $78. The median amount is $75. However there was no modal amount
(Burnett, 2013). From the figures calculated, it can be observed that the shoppers at medistore
are not high end spenders. Therefore stocking averaged priced goods to fit this group would be
appropriate.
Document Page
Data analysis 4
Distribution of respondents by liking of online shopping
Like very
much Like Neutral Dislike Dislike very
much
0
0.5
1
1.5
2
2.5
3
3.5
2
3
1
2
1
Distribution of customers by
liking
Figure 2
The graph shows the distribution by how much they like the online shopping platform. 3
out of 10 liked the platform. 2 out of 10 like it very much. 1 person did not like it. 1 person
disliked while the other 1 was neutral. In general it can be concluded that half of those who shop
at medistore like the online shopping platform. It is recommended that the store management
conduct further survey to establish why the other half are of a different opinion.
tabler-icon-diamond-filled.svg

Paraphrase This Document

Need a fresh take? Get an instant paraphrase of this document with our AI Paraphraser
Document Page
Data analysis 5
Distribution of respondents by why they like shopping at medistore
High
quality of
goods
30%
Low prices
40%
Good
variety of
sizes/
styles
10%
Sales staff
helpful/
friendly
20%
Reason for shopping at medistore
Figure 3
From figure 3 above, it can be observed that 40% liked shopping at medistore because of
low prices. Thirty percent (30%) liked shopping at medistore because of high quality goods.
Twenty (20%) liked shopping at medistore because of friendly staff while the remaining ten
percent (10%) liked shopping at medistore because of high variety of goods. So in general we
can conclude that low prices and high quality goods is what attracts people to shop at medistore.
Document Page
Data analysis 6
Dixon , W. J., & Massey, F. J. (2009). Introduction to Statistical Analysis. New York: McGraw-
Hill.
Hicks, C. R. (2013). Fundamental Concepts in the Design of Experiments. New-York: Rhinehart
and Winston.
Bisht, M. S. (2014). Factors Influencing Buying Decision of Rural Consumers. Vedaang, 50- 52.
Burnett, J. (2013). Marketing Research: An Aid to Decision Making
chevron_up_icon
1 out of 6
circle_padding
hide_on_mobile
zoom_out_icon
[object Object]