Civil Engineering Project: Analyzing Schedule and Costs for Apartments

Verified

Added on  2023/06/14

|7
|1153
|128
Project
AI Summary
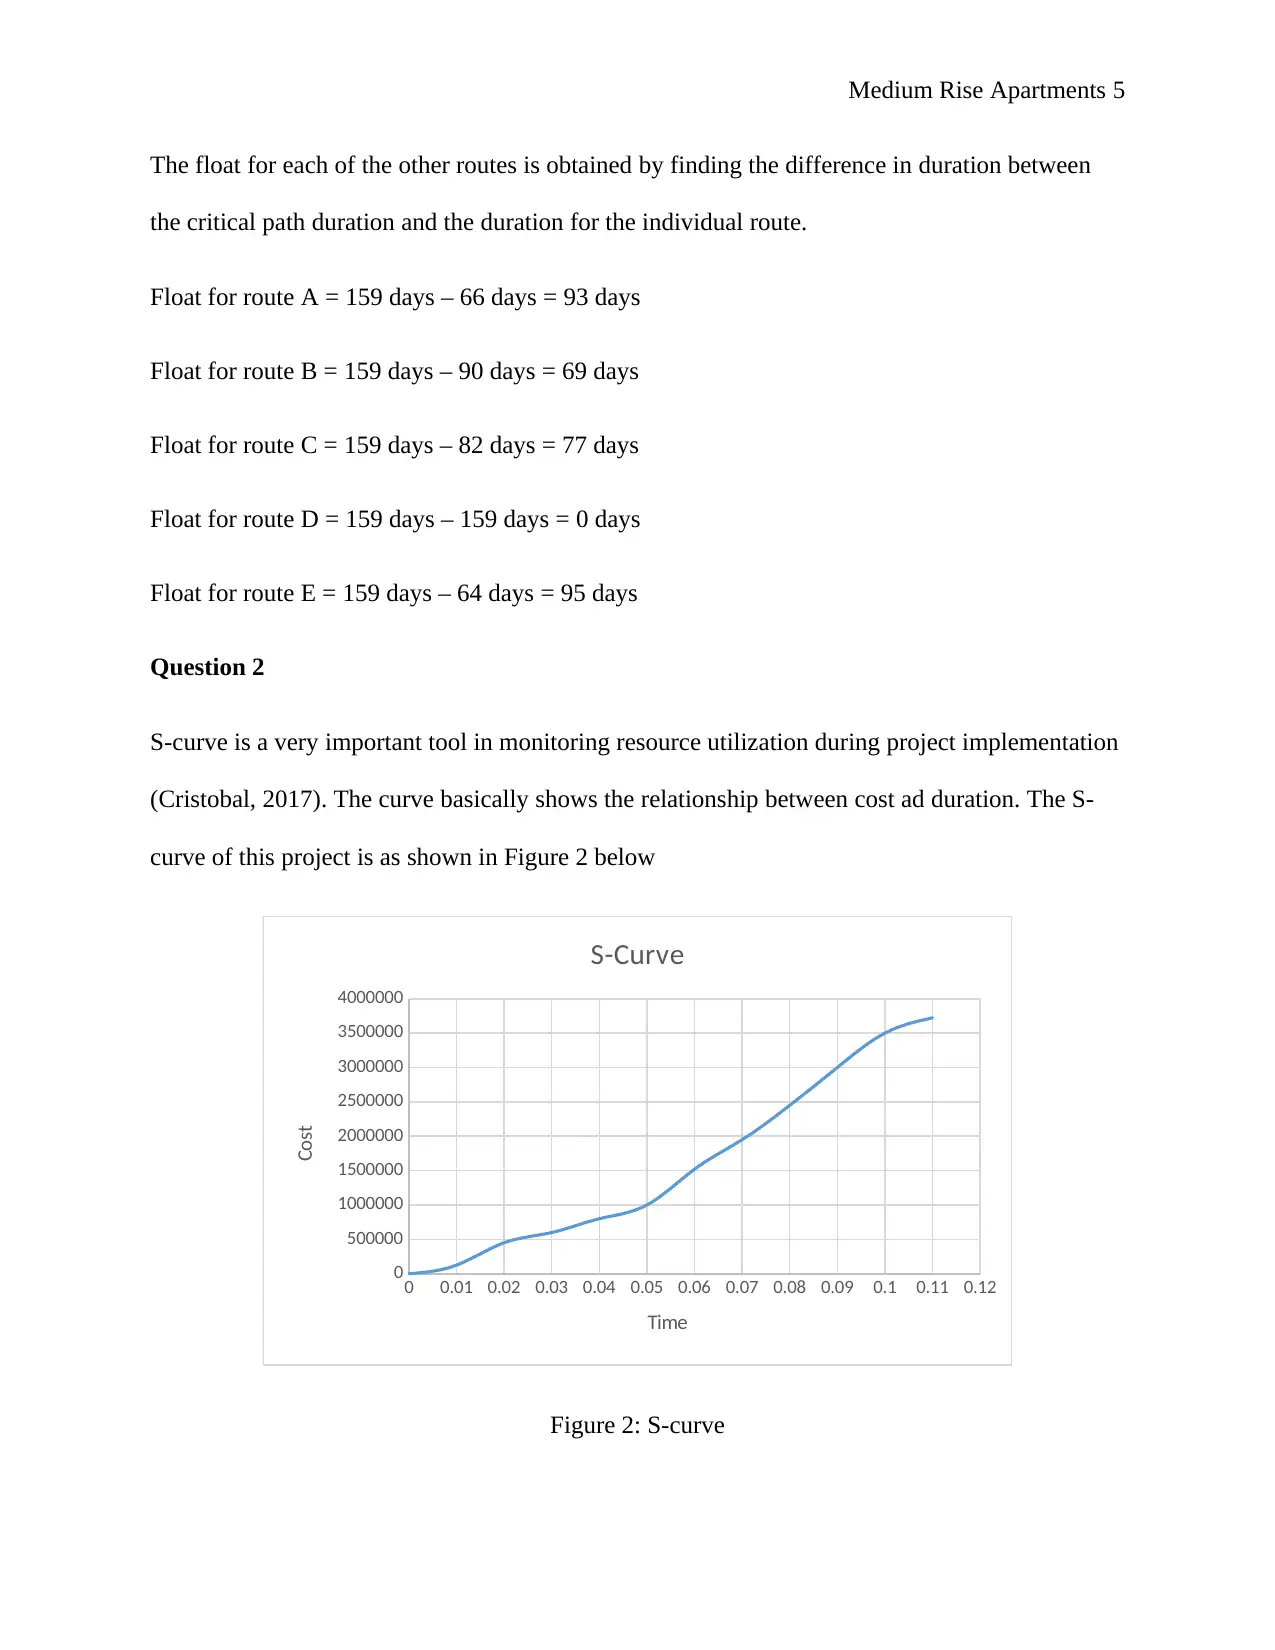
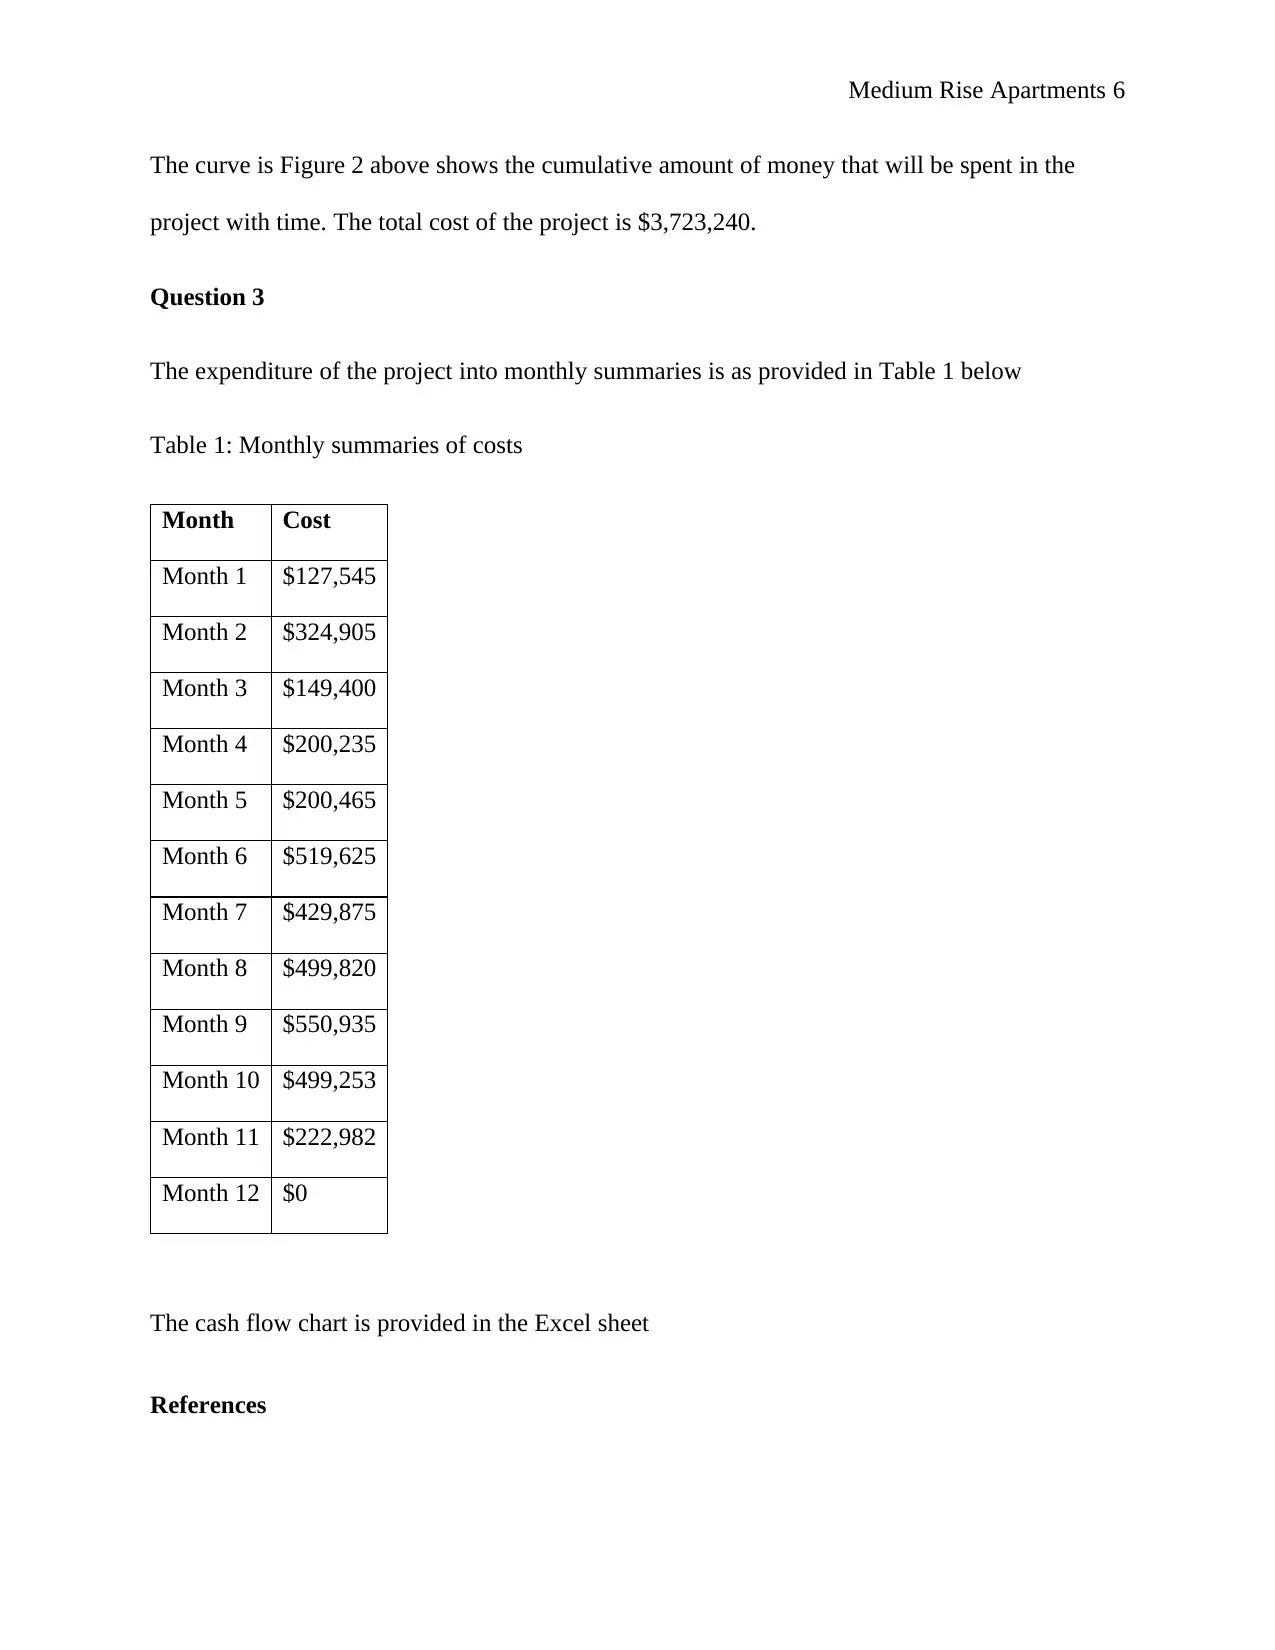
This assignment solution provides a detailed analysis of a medium rise apartment construction project. It includes a precedence diagram to identify and schedule activities, determines the critical path as route D with a duration of 159 days, and calculates early start/finish and late start/finish dates. The analysis also covers float for various routes, highlighting the critical path's zero float. Additionally, the solution presents an S-curve illustrating the relationship between cost and duration, with a total project cost of $3,723,240. Monthly cost summaries are provided in a table, offering insights into the project's expenditure over time. Desklib provides access to this and other solved assignments to aid students in their studies.
Document Page
Medium Rise Apartments 1
MEDIUM RISE APARTMENTS
Name
Course
Professor
University
City/state
Date
tabler-icon-diamond-filled.svg

Secure Best Marks with AI Grader

Need help grading? Try our AI Grader for instant feedback on your assignments.
Document Page
Medium Rise Apartments 2
Medium Rise Apartments
Question 1: Precedence Diagram
A precedence diagram
Precedence diagram is a very crucial tool in project management as it helps in identifying all
activities and scheduling them appropriately (Pintzos, et al., 2016). The diagram basically
comprises of boxes (known as nodes) that represent activities/tasks connected by arrows showing
how each activity depends on the other. This project has a total of 135 activities, making its
precedence diagram appear to be quite congested. The precedence diagram is as shown in Figure
1 below
Figure 1: Precedence diagram
Document Page
Medium Rise Apartments 3
Critical path
Critical path is the longest path of the precedence diagram.
Duration for route A = 0 + 1 + 4 + 4 + 4 + 4 + 4 + 3 + 3 + 2 + 2 + 2 + 2 + 2 + 2 + 2 + 2 + 3 + 20
+ 0 + 0 = 66 days
Duration for route B = 0 + 1 + 8 + 8 + 8 + 8 + 8 + 4 + 3 + 3 + 2 + 2 + 2 + 2 + 2 + 2 + 2 + 2 + 3 +
20 + 0 + 0 = 90 days
Duration for route C = 0 + 21 + 5 + 5 + 5 + 5 + 5 + 5 + 3 + 3 + 2 + 3 + 20 + 0 + 0 = 82 days
Duration for route D = 0 + 21 + 5+ 7 + 13 + 13 + 13 + 13 + 13 + 7 + 5 + 3 + 3 + 6 + 17 + 20 + 0
+ 0 = 159 days
Duration for route E = 0 + 1 + 1 + 1 + 1 + 1 + 1 + 1 + 8 + 4 + 3 + 3 + 2 + 2 + 2 + 2 + 2 + 2 + 2 +
2 + 3 + 20 + 0 + 0 = 64 days
Therefore critical path is the route with the longest duration i.e. route D.
Early start/early finish
Early start is the earliest date that a task or activity can be scheduled to commence provided the
schedule’s constraints and logic. In this project, early start is on 13th January 2014.
Early finish is the earliest date that a task or activity can be scheduled to be completed provided
the schedule’s constraints and logic. Early schedule is the schedule comprising of early start and
early finish for each activity in the project schedule.
To determine early finish, we are going to use the route with the shortest duration i.e. route E (64
days).
Document Page
Medium Rise Apartments 4
Remember that we are using a 5 day calendar. So 64 days are equivalent to 12.8 weeks. Since
early start is 13th January 2014, early finish is obtained by adding the number of weeks or days
(duration of the project) to the early start date.
Early finish = early start + number of days = 13th January, 2014 + 64 days = 10th April, 2014.
Late start/late finish
Late start is the latest date that a project task or activity can be scheduled to be commenced
without rescheduling the project’s calculated early finish. In this project, late start is on 13th
January 2014.
Late finish is the latest that a project task or activity can be completed without rescheduling the
project’s calculated late finish. Late schedule is the schedule comprising of late start and late
finish for each activity in the project schedule.
To determine late finish, we are going to use the route with the longest duration i.e. route D (159
days).
Remember that we are using a 5 day calendar. So 159 days are equivalent to 31.8 weeks. Since
late start is 13th January 2014, late finish is obtained by adding the number of weeks or days
(duration of the project) to the late start date.
Late finish = late start + number of days = 13th January, 2014 + 159 days = 21st August, 2014.
Float
This is the amount of time within which a project can be delayed without necessarily causing
delay to subsequent activities or completion date of the project. Critical path does not have float.
tabler-icon-diamond-filled.svg

Secure Best Marks with AI Grader

Need help grading? Try our AI Grader for instant feedback on your assignments.
Document Page
Medium Rise Apartments 5
The float for each of the other routes is obtained by finding the difference in duration between
the critical path duration and the duration for the individual route.
Float for route A = 159 days – 66 days = 93 days
Float for route B = 159 days – 90 days = 69 days
Float for route C = 159 days – 82 days = 77 days
Float for route D = 159 days – 159 days = 0 days
Float for route E = 159 days – 64 days = 95 days
Question 2
S-curve is a very important tool in monitoring resource utilization during project implementation
(Cristobal, 2017). The curve basically shows the relationship between cost ad duration. The S-
curve of this project is as shown in Figure 2 below
0 0.01 0.02 0.03 0.04 0.05 0.06 0.07 0.08 0.09 0.1 0.11 0.12
0
500000
1000000
1500000
2000000
2500000
3000000
3500000
4000000
S-Curve
Time
Cost
Figure 2: S-curve
Document Page
Medium Rise Apartments 6
The curve is Figure 2 above shows the cumulative amount of money that will be spent in the
project with time. The total cost of the project is $3,723,240.
Question 3
The expenditure of the project into monthly summaries is as provided in Table 1 below
Table 1: Monthly summaries of costs
Month Cost
Month 1 $127,545
Month 2 $324,905
Month 3 $149,400
Month 4 $200,235
Month 5 $200,465
Month 6 $519,625
Month 7 $429,875
Month 8 $499,820
Month 9 $550,935
Month 10 $499,253
Month 11 $222,982
Month 12 $0
The cash flow chart is provided in the Excel sheet
References
Document Page
Medium Rise Apartments 7
Cristobal, J., 2017. The S-curve Envelope as a Tool for Monitoring and Control of Projects.
Procedia Computer Science, Volume 121, pp. 756-761.
Pintzos, G. et al., 2016. Assembly precedence diagram generation through assembly tiers
determination. International Journal of Computer Integrated Manufacturing, 29(10), pp. 1045-
1057.
chevron_up_icon
1 out of 7
circle_padding
hide_on_mobile
zoom_out_icon
logo.png

Your All-in-One AI-Powered Toolkit for Academic Success.

Available 24*7 on WhatsApp / Email

[object Object]