Mel's Business: Journal Entries, Ledger, Trial Balance, Financials
VerifiedAdded on 2021/01/02
|12
|3472
|152
Homework Assignment
AI Summary
This assignment presents a detailed financial analysis of Mel's business transactions. It begins with the recording of transactions in journal entries, followed by posting these entries to the general ledger. The assignment then progresses to the preparation of a trial balance, income statement, and statement of financial position. Furthermore, the report includes the calculation of various financial ratios to provide a comparative analysis of Mel's financial performance. The content covers the entire accounting cycle, from initial transaction recording to the final preparation of financial statements, offering a comprehensive understanding of financial accounting principles. The report also includes a comparative analysis using financial ratios.

RECORDING BUSINESS
TRANSACTION
TRANSACTION
Paraphrase This Document
Need a fresh take? Get an instant paraphrase of this document with our AI Paraphraser
Table of Contents
INTRODUCTION...........................................................................................................................3
PART A...........................................................................................................................................3
(a) Journal Entries of Mel...........................................................................................................3
(b) General Ledger of Mel..........................................................................................................5
(c) Trial Balance of Mel..............................................................................................................7
(d) Income Statement of Mel......................................................................................................8
(e) Statement of Financial Position of Mel.................................................................................8
PART B............................................................................................................................................9
Ratios calculation for Mel :.........................................................................................................9
Systematic comparison of various ratios of Mel with competitors average:............................10
CONCLUSION..............................................................................................................................11
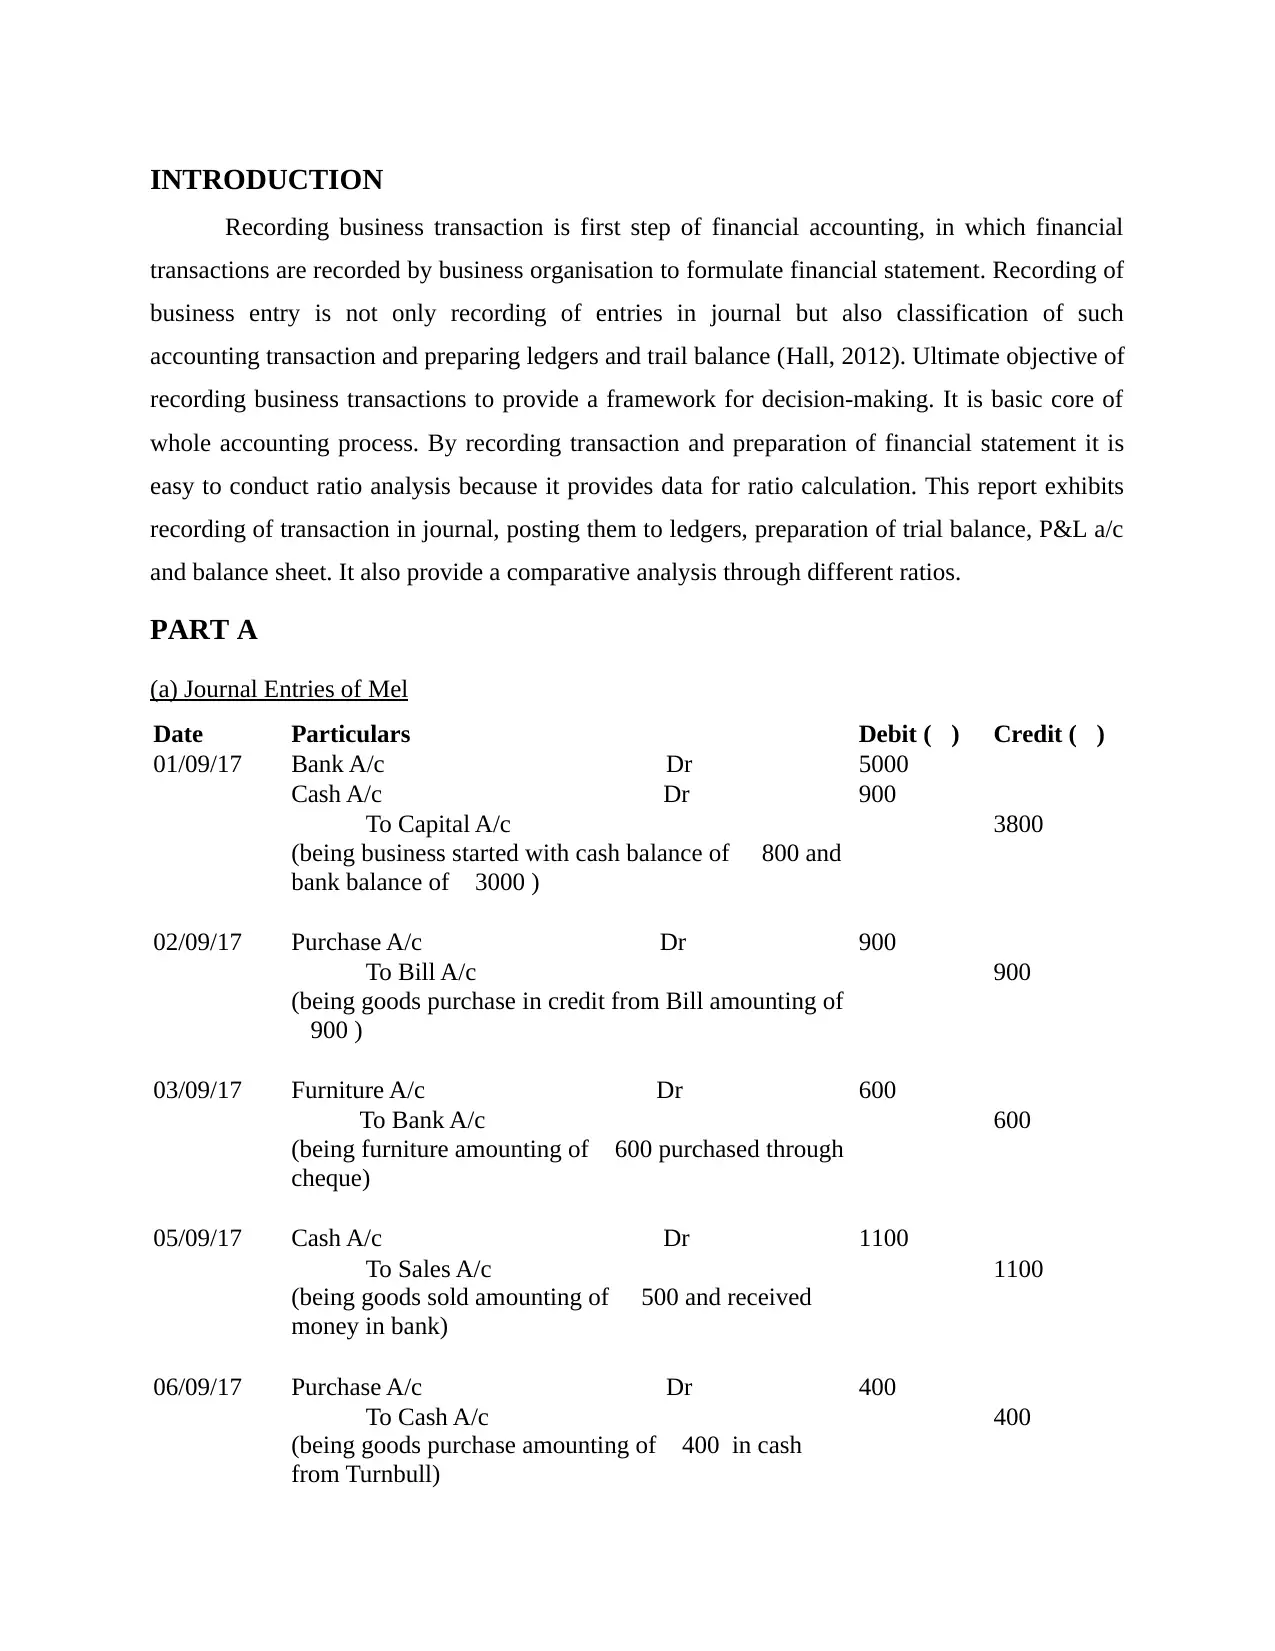
INTRODUCTION
Recording business transaction is first step of financial accounting, in which financial
transactions are recorded by business organisation to formulate financial statement. Recording of
business entry is not only recording of entries in journal but also classification of such
accounting transaction and preparing ledgers and trail balance (Hall, 2012). Ultimate objective of
recording business transactions to provide a framework for decision-making. It is basic core of
whole accounting process. By recording transaction and preparation of financial statement it is
easy to conduct ratio analysis because it provides data for ratio calculation. This report exhibits
recording of transaction in journal, posting them to ledgers, preparation of trial balance, P&L a/c
and balance sheet. It also provide a comparative analysis through different ratios.
PART A
(a) Journal Entries of Mel
Date Particulars Debit (£) Credit (£)
01/09/17 Bank A/c Dr 5000
Cash A/c Dr 900
To Capital A/c 3800
(being business started with cash balance of £ 800 and
bank balance of £3000 )
02/09/17 Purchase A/c Dr 900
To Bill A/c 900
(being goods purchase in credit from Bill amounting of
£900 )
03/09/17 Furniture A/c Dr 600
To Bank A/c 600
(being furniture amounting of £600 purchased through
cheque)
05/09/17 Cash A/c Dr 1100
To Sales A/c 1100
(being goods sold amounting of £ 500 and received
money in bank)
06/09/17 Purchase A/c Dr 400
To Cash A/c 400
(being goods purchase amounting of £400 in cash
from Turnbull)
⊘ This is a preview!⊘
Do you want full access?
Subscribe today to unlock all pages.
Trusted by 1+ million students worldwide
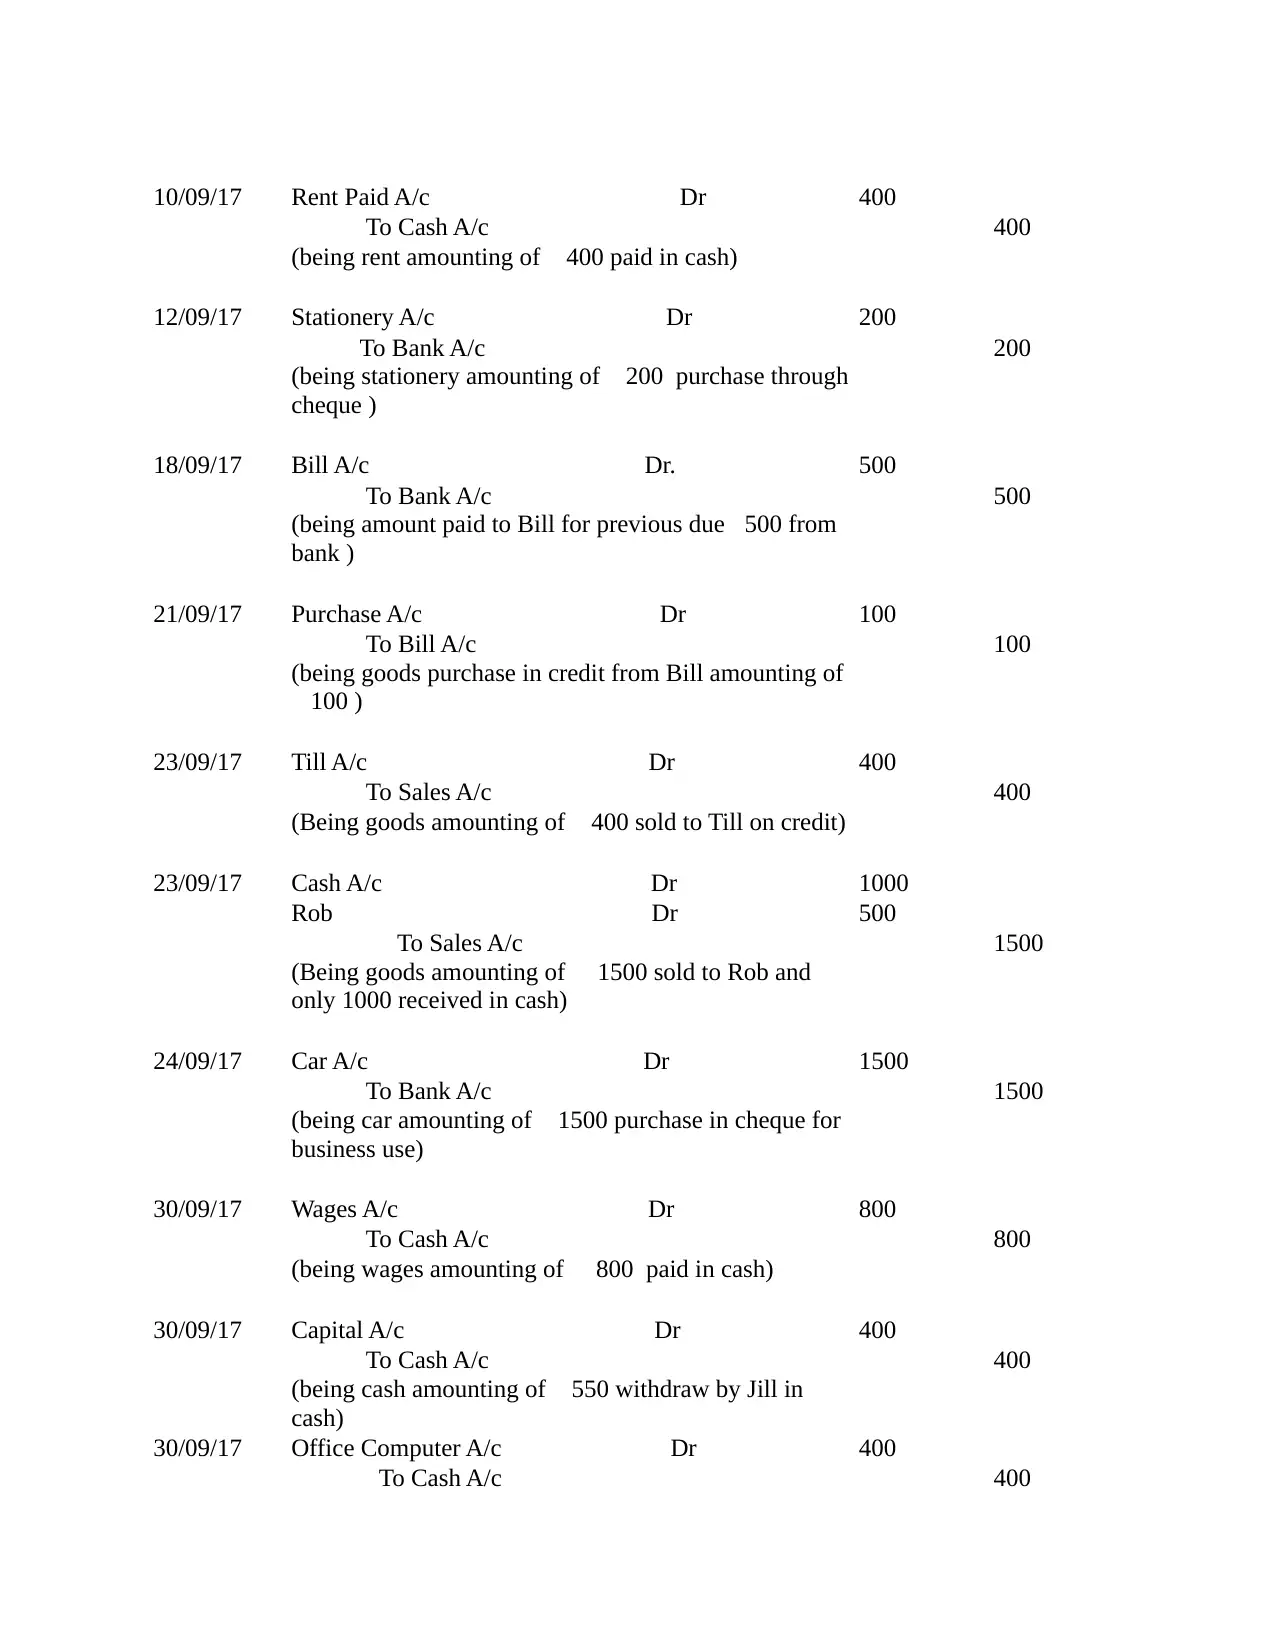
10/09/17 Rent Paid A/c Dr 400
To Cash A/c 400
(being rent amounting of £400 paid in cash)
12/09/17 Stationery A/c Dr 200
To Bank A/c 200
(being stationery amounting of £200 purchase through
cheque )
18/09/17 Bill A/c Dr. 500
To Bank A/c 500
(being amount paid to Bill for previous due£500 from
bank )
21/09/17 Purchase A/c Dr 100
To Bill A/c 100
(being goods purchase in credit from Bill amounting of
£100 )
23/09/17 Till A/c Dr 400
To Sales A/c 400
(Being goods amounting of £400 sold to Till on credit)
23/09/17 Cash A/c Dr 1000
Rob Dr 500
To Sales A/c 1500
(Being goods amounting of £ 1500 sold to Rob and
only 1000 received in cash)
24/09/17 Car A/c Dr 1500
To Bank A/c 1500
(being car amounting of £1500 purchase in cheque for
business use)
30/09/17 Wages A/c Dr 800
To Cash A/c 800
(being wages amounting of £ 800 paid in cash)
30/09/17 Capital A/c Dr 400
To Cash A/c 400
(being cash amounting of £550 withdraw by Jill in
cash)
30/09/17 Office Computer A/c Dr 400
To Cash A/c 400
To Cash A/c 400
(being rent amounting of £400 paid in cash)
12/09/17 Stationery A/c Dr 200
To Bank A/c 200
(being stationery amounting of £200 purchase through
cheque )
18/09/17 Bill A/c Dr. 500
To Bank A/c 500
(being amount paid to Bill for previous due£500 from
bank )
21/09/17 Purchase A/c Dr 100
To Bill A/c 100
(being goods purchase in credit from Bill amounting of
£100 )
23/09/17 Till A/c Dr 400
To Sales A/c 400
(Being goods amounting of £400 sold to Till on credit)
23/09/17 Cash A/c Dr 1000
Rob Dr 500
To Sales A/c 1500
(Being goods amounting of £ 1500 sold to Rob and
only 1000 received in cash)
24/09/17 Car A/c Dr 1500
To Bank A/c 1500
(being car amounting of £1500 purchase in cheque for
business use)
30/09/17 Wages A/c Dr 800
To Cash A/c 800
(being wages amounting of £ 800 paid in cash)
30/09/17 Capital A/c Dr 400
To Cash A/c 400
(being cash amounting of £550 withdraw by Jill in
cash)
30/09/17 Office Computer A/c Dr 400
To Cash A/c 400
Paraphrase This Document
Need a fresh take? Get an instant paraphrase of this document with our AI Paraphraser
(Being amount paid for office computer)
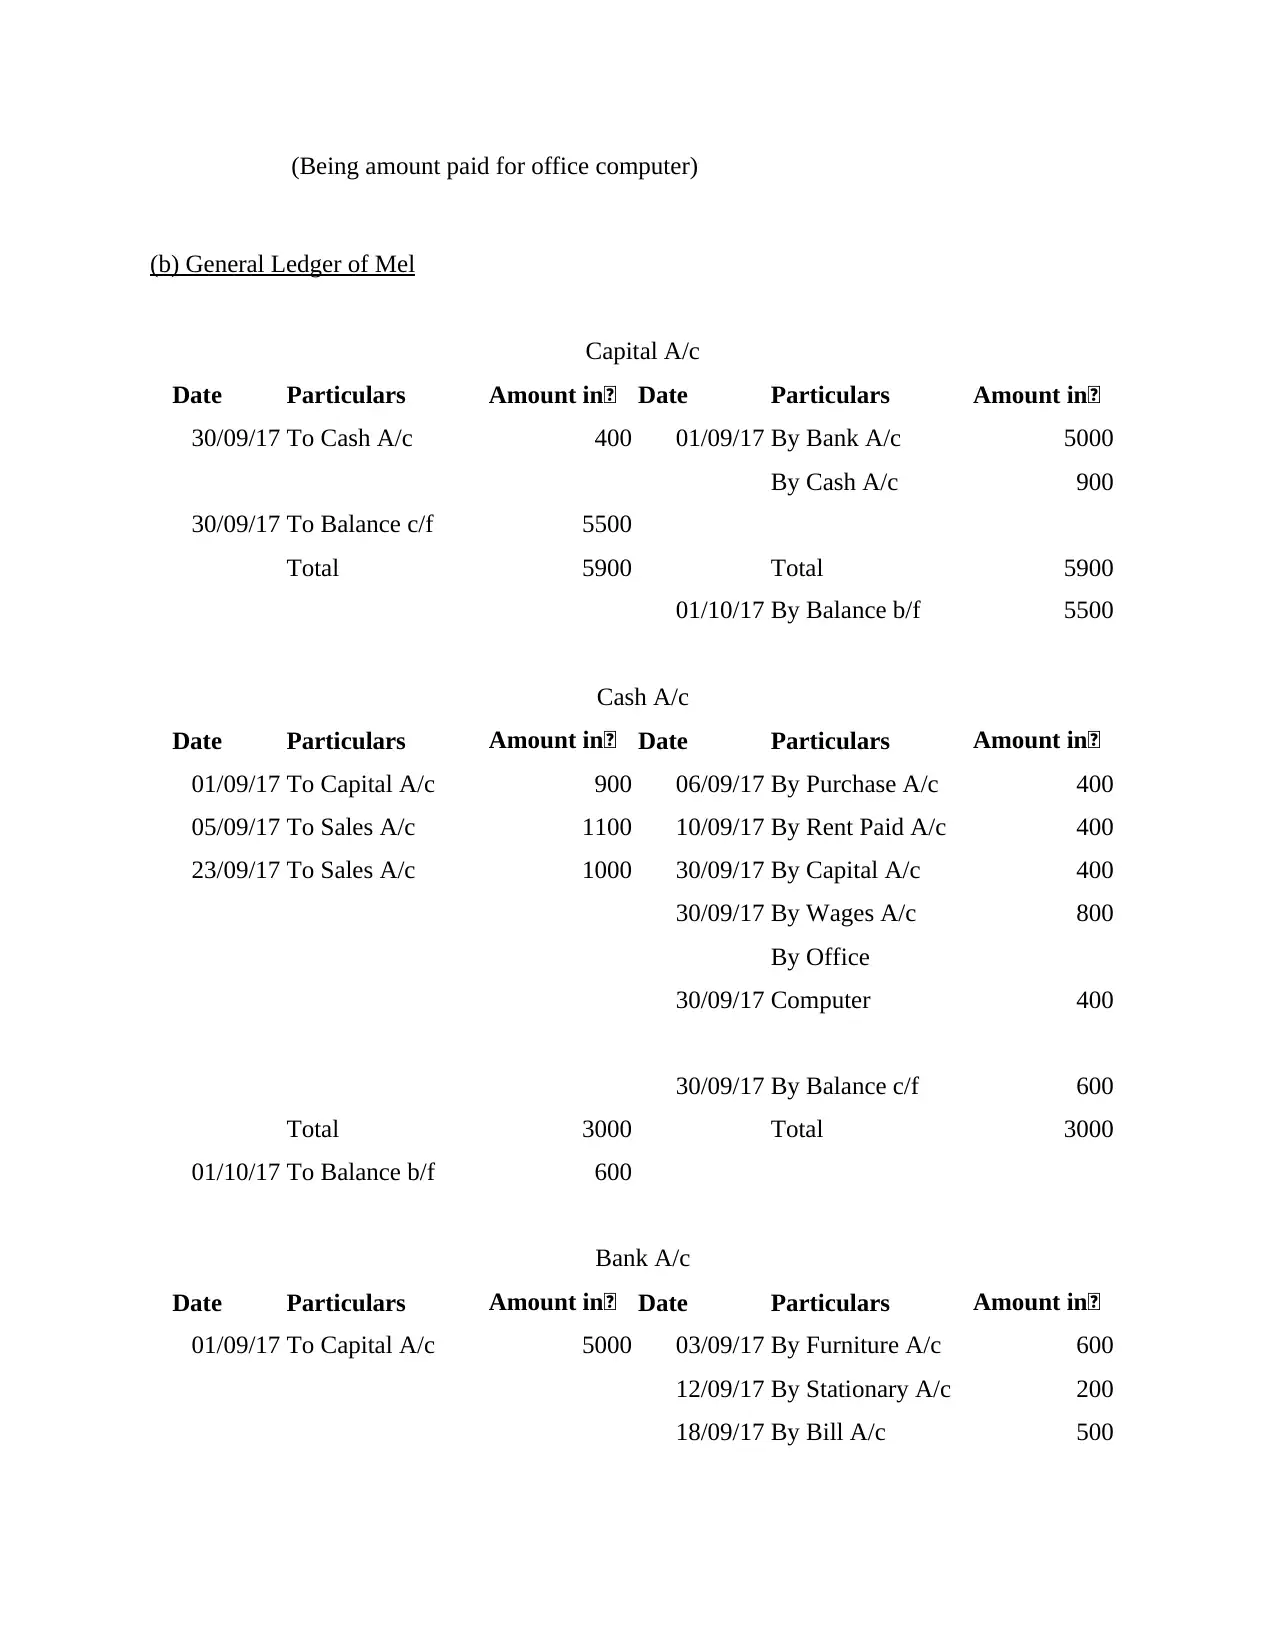
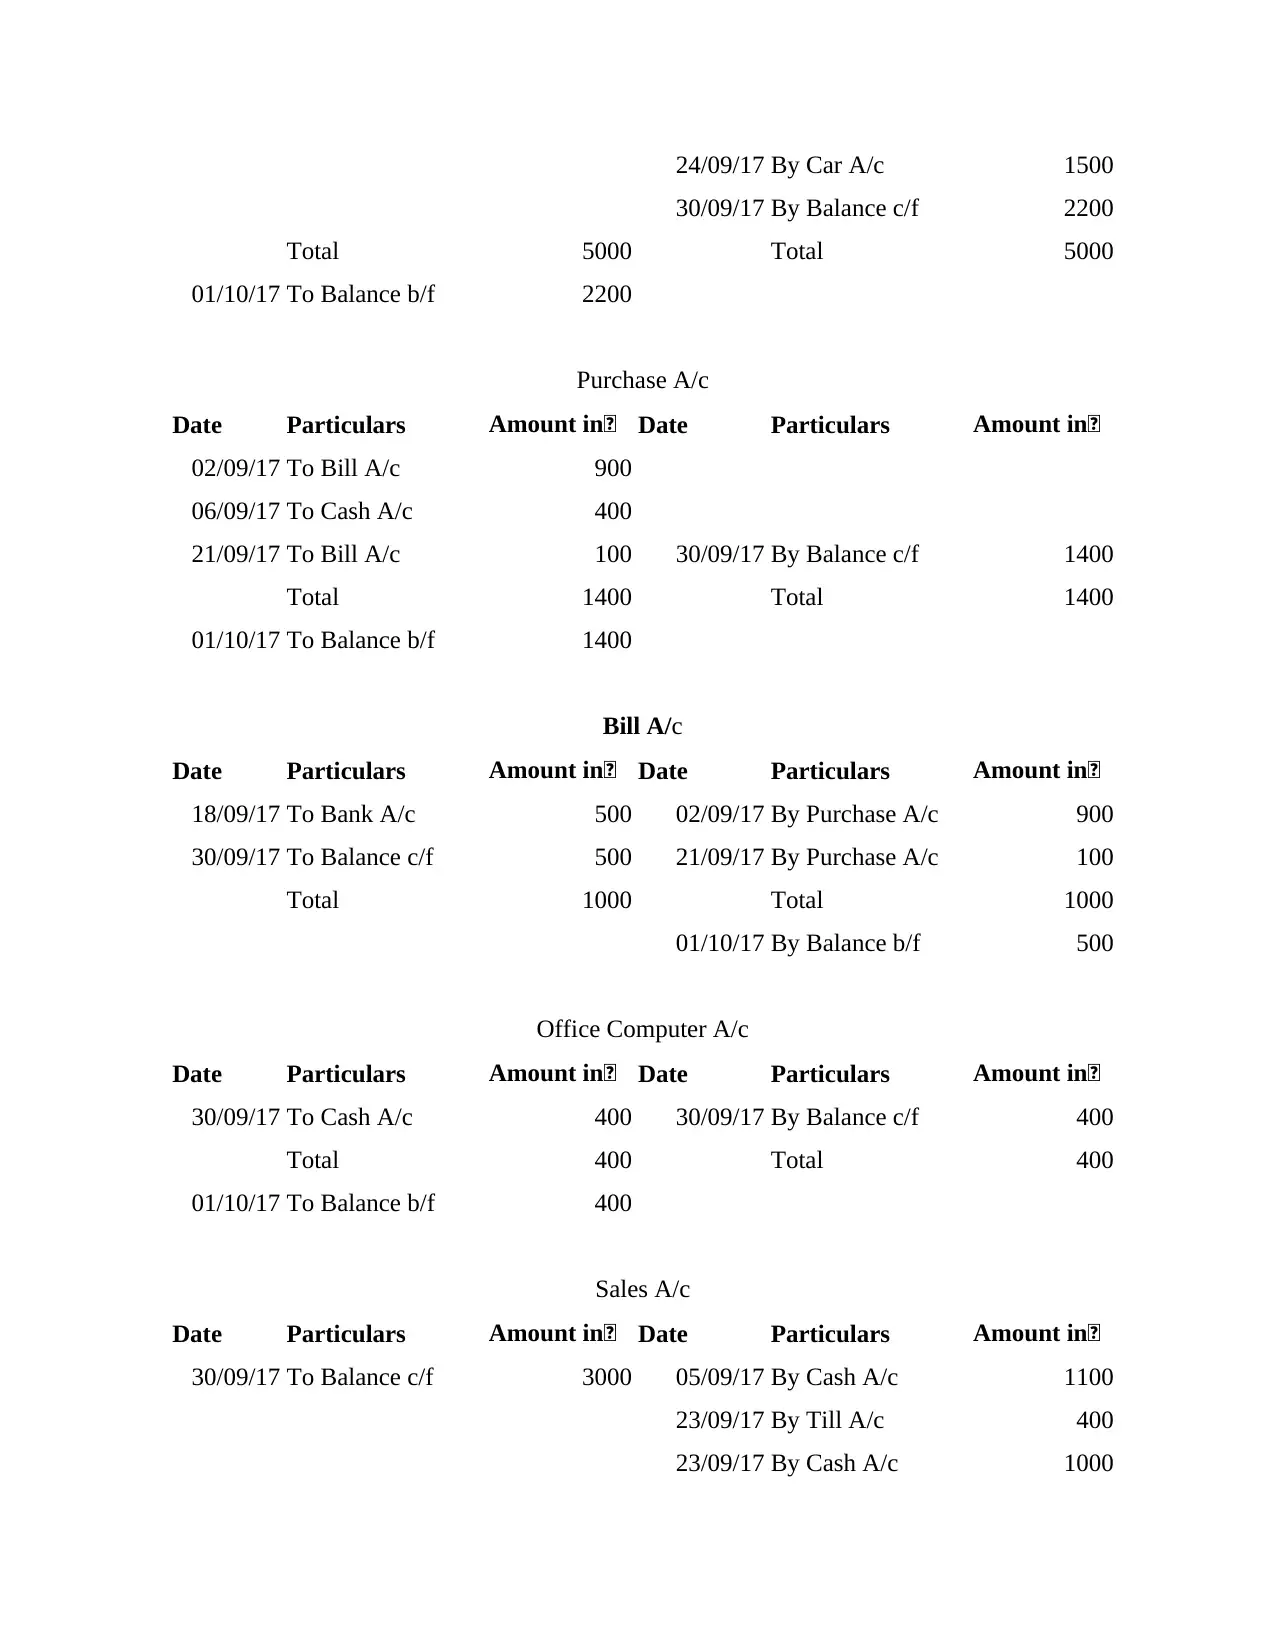
(b) General Ledger of Mel
Capital A/c
Date Particulars Amount in£ Date Particulars Amount in£
30/09/17 To Cash A/c 400 01/09/17 By Bank A/c 5000
By Cash A/c 900
30/09/17 To Balance c/f 5500
Total 5900 Total 5900
01/10/17 By Balance b/f 5500
Cash A/c
Date Particulars Amount in£ Date Particulars Amount in£
01/09/17 To Capital A/c 900 06/09/17 By Purchase A/c 400
05/09/17 To Sales A/c 1100 10/09/17 By Rent Paid A/c 400
23/09/17 To Sales A/c 1000 30/09/17 By Capital A/c 400
30/09/17 By Wages A/c 800
30/09/17
By Office
Computer 400
30/09/17 By Balance c/f 600
Total 3000 Total 3000
01/10/17 To Balance b/f 600
Bank A/c
Date Particulars Amount in£ Date Particulars Amount in£
01/09/17 To Capital A/c 5000 03/09/17 By Furniture A/c 600
12/09/17 By Stationary A/c 200
18/09/17 By Bill A/c 500
24/09/17 By Car A/c 1500
30/09/17 By Balance c/f 2200
Total 5000 Total 5000
01/10/17 To Balance b/f 2200
Purchase A/c
Date Particulars Amount in£ Date Particulars Amount in£
02/09/17 To Bill A/c 900
06/09/17 To Cash A/c 400
21/09/17 To Bill A/c 100 30/09/17 By Balance c/f 1400
Total 1400 Total 1400
01/10/17 To Balance b/f 1400
Bill A/c
Date Particulars Amount in£ Date Particulars Amount in£
18/09/17 To Bank A/c 500 02/09/17 By Purchase A/c 900
30/09/17 To Balance c/f 500 21/09/17 By Purchase A/c 100
Total 1000 Total 1000
01/10/17 By Balance b/f 500
Office Computer A/c
Date Particulars Amount in£ Date Particulars Amount in£
30/09/17 To Cash A/c 400 30/09/17 By Balance c/f 400
Total 400 Total 400
01/10/17 To Balance b/f 400
Sales A/c
Date Particulars Amount in£ Date Particulars Amount in£
30/09/17 To Balance c/f 3000 05/09/17 By Cash A/c 1100
23/09/17 By Till A/c 400
23/09/17 By Cash A/c 1000
⊘ This is a preview!⊘
Do you want full access?
Subscribe today to unlock all pages.
Trusted by 1+ million students worldwide
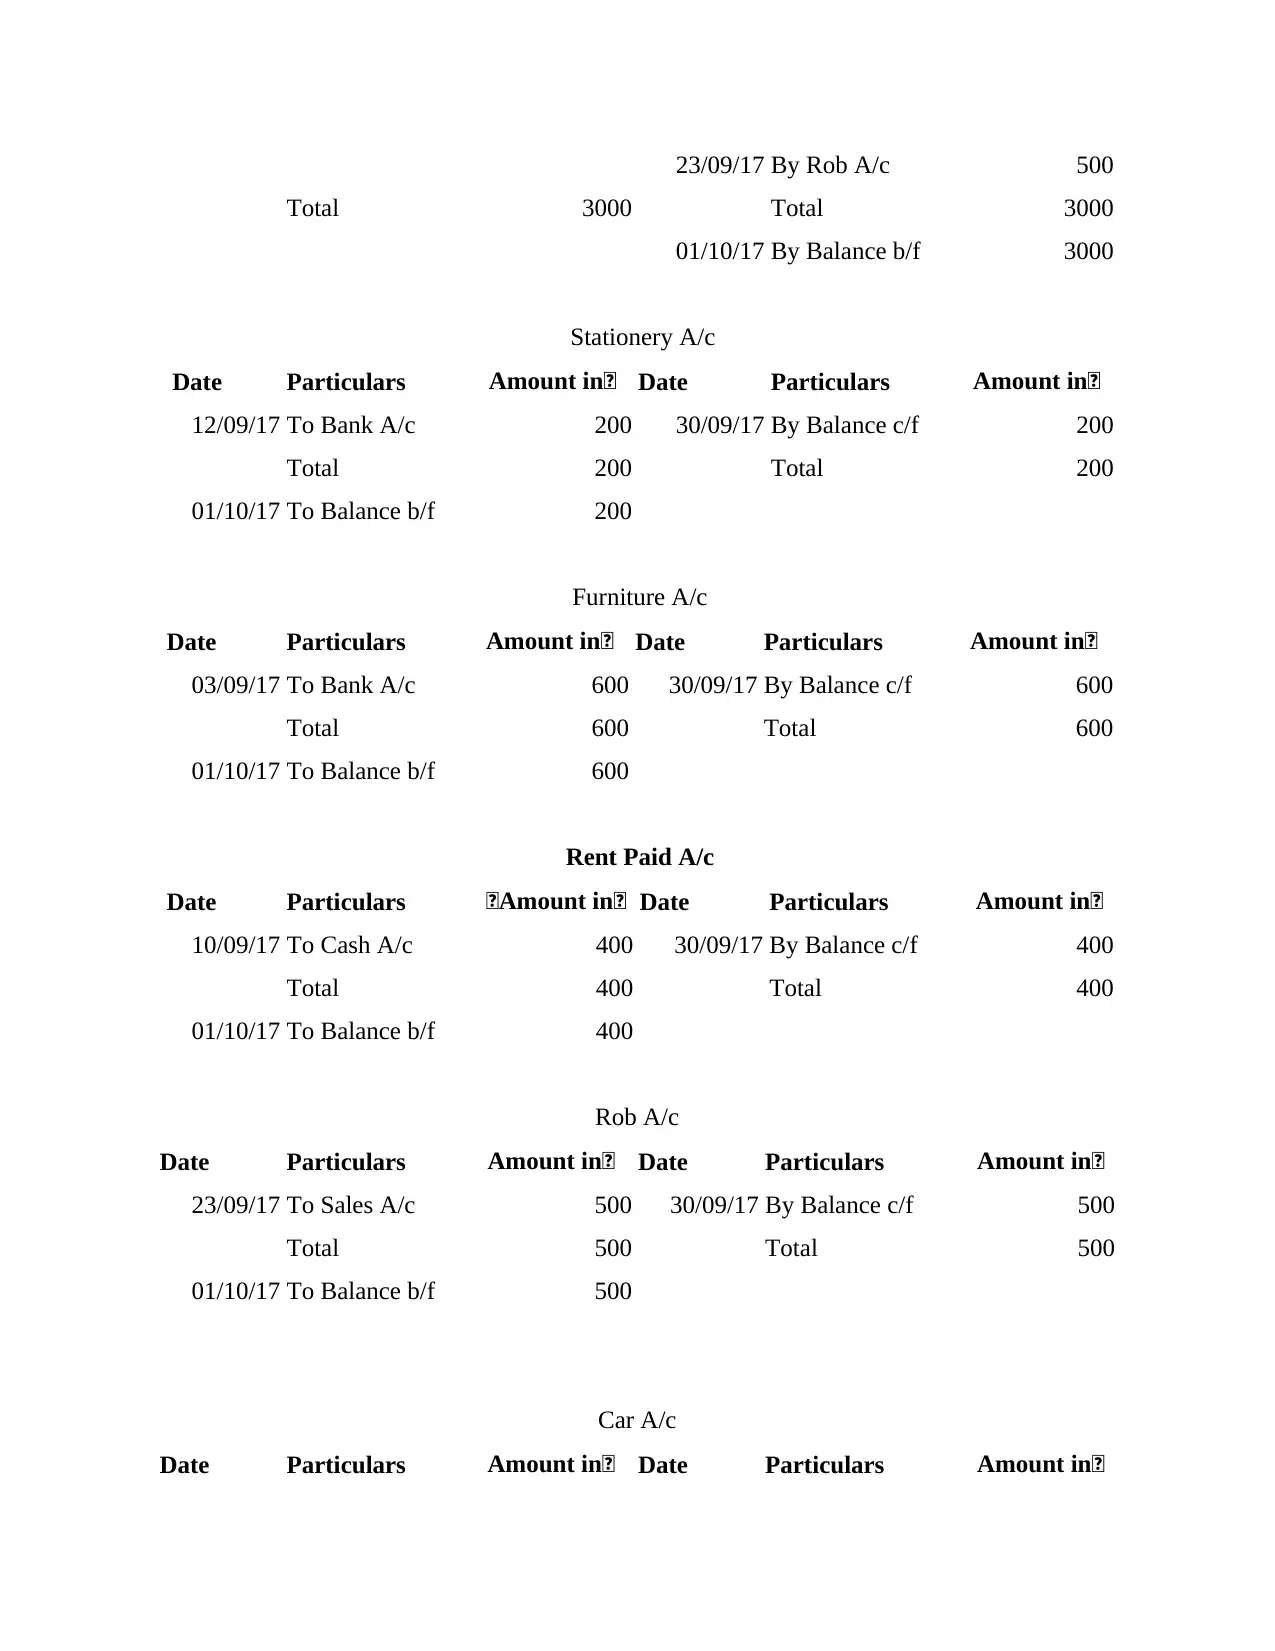
23/09/17 By Rob A/c 500
Total 3000 Total 3000
01/10/17 By Balance b/f 3000
Stationery A/c
Date Particulars Amount in£ Date Particulars Amount in£
12/09/17 To Bank A/c 200 30/09/17 By Balance c/f 200
Total 200 Total 200
01/10/17 To Balance b/f 200
Furniture A/c
Date Particulars Amount in£ Date Particulars Amount in£
03/09/17 To Bank A/c 600 30/09/17 By Balance c/f 600
Total 600 Total 600
01/10/17 To Balance b/f 600
Rent Paid A/c
Date Particulars £Amount in£ Date Particulars Amount in£
10/09/17 To Cash A/c 400 30/09/17 By Balance c/f 400
Total 400 Total 400
01/10/17 To Balance b/f 400
Rob A/c
Date Particulars Amount in£ Date Particulars Amount in£
23/09/17 To Sales A/c 500 30/09/17 By Balance c/f 500
Total 500 Total 500
01/10/17 To Balance b/f 500
Car A/c
Date Particulars Amount in£ Date Particulars Amount in£
Paraphrase This Document
Need a fresh take? Get an instant paraphrase of this document with our AI Paraphraser
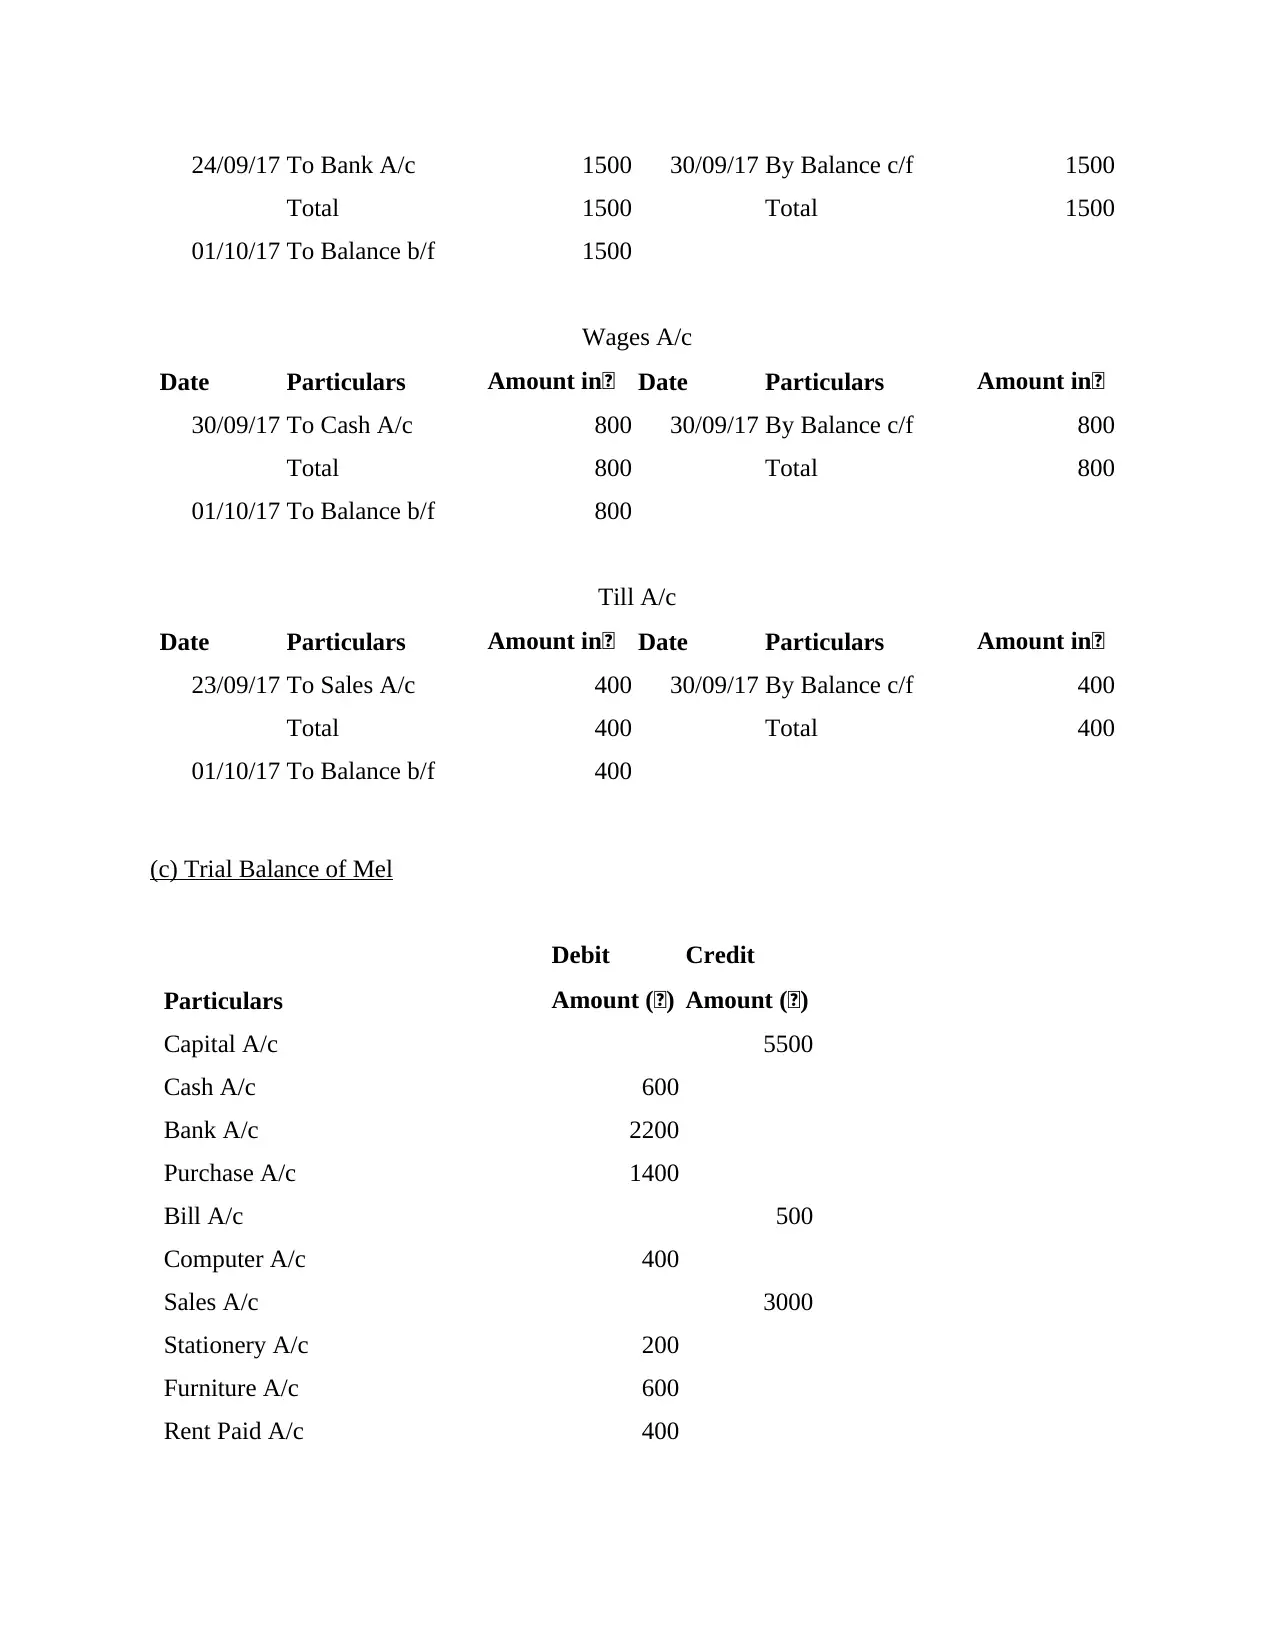
24/09/17 To Bank A/c 1500 30/09/17 By Balance c/f 1500
Total 1500 Total 1500
01/10/17 To Balance b/f 1500
Wages A/c
Date Particulars Amount in£ Date Particulars Amount in£
30/09/17 To Cash A/c 800 30/09/17 By Balance c/f 800
Total 800 Total 800
01/10/17 To Balance b/f 800
Till A/c
Date Particulars Amount in£ Date Particulars Amount in£
23/09/17 To Sales A/c 400 30/09/17 By Balance c/f 400
Total 400 Total 400
01/10/17 To Balance b/f 400
(c) Trial Balance of Mel
Particulars
Debit
Amount (£)
Credit
Amount (£)
Capital A/c 5500
Cash A/c 600
Bank A/c 2200
Purchase A/c 1400
Bill A/c 500
Computer A/c 400
Sales A/c 3000
Stationery A/c 200
Furniture A/c 600
Rent Paid A/c 400
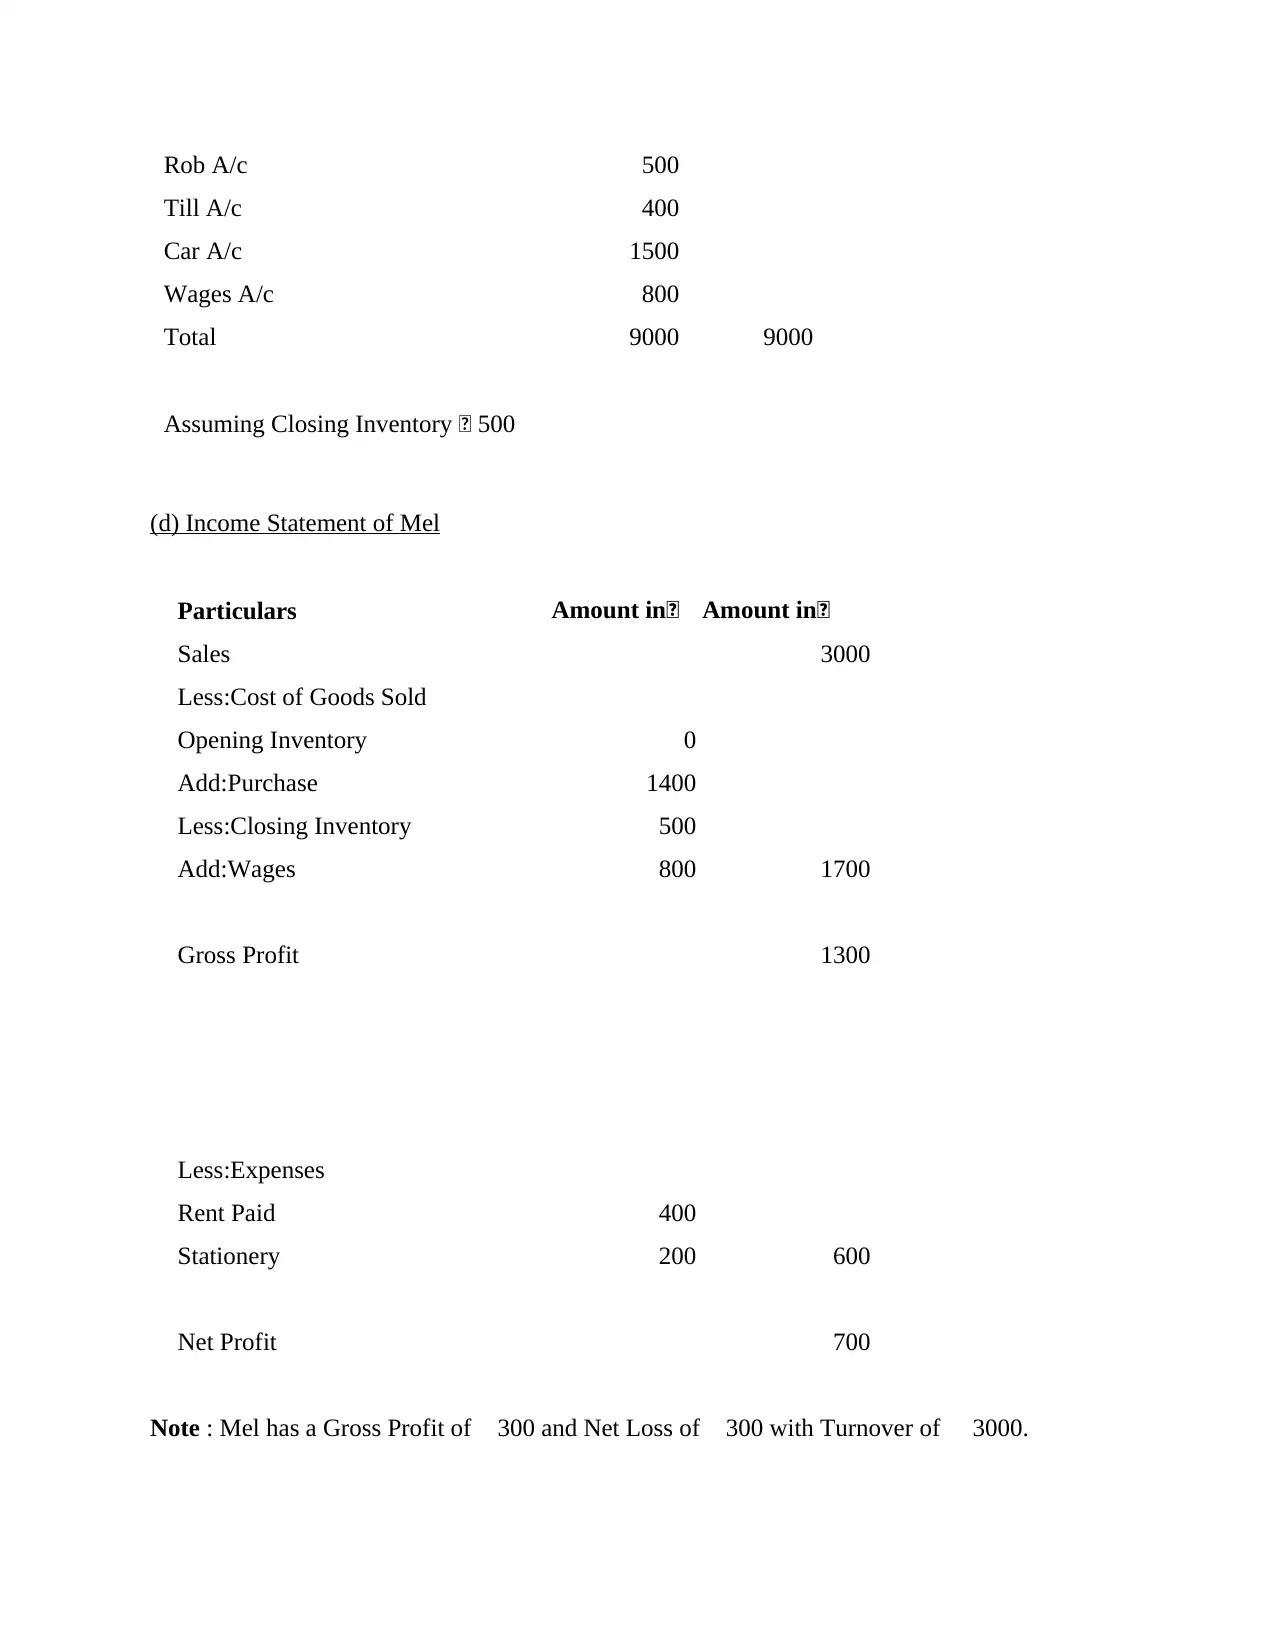
Rob A/c 500
Till A/c 400
Car A/c 1500
Wages A/c 800
Total 9000 9000
Assuming Closing Inventory £ 500
(d) Income Statement of Mel
Particulars Amount in£ Amount in£
Sales 3000
Less:Cost of Goods Sold
Opening Inventory 0
Add:Purchase 1400
Less:Closing Inventory 500
Add:Wages 800 1700
Gross Profit 1300
Less:Expenses
Rent Paid 400
Stationery 200 600
Net Profit 700
Note : Mel has a Gross Profit of £300 and Net Loss of £300 with Turnover of £ 3000.
⊘ This is a preview!⊘
Do you want full access?
Subscribe today to unlock all pages.
Trusted by 1+ million students worldwide
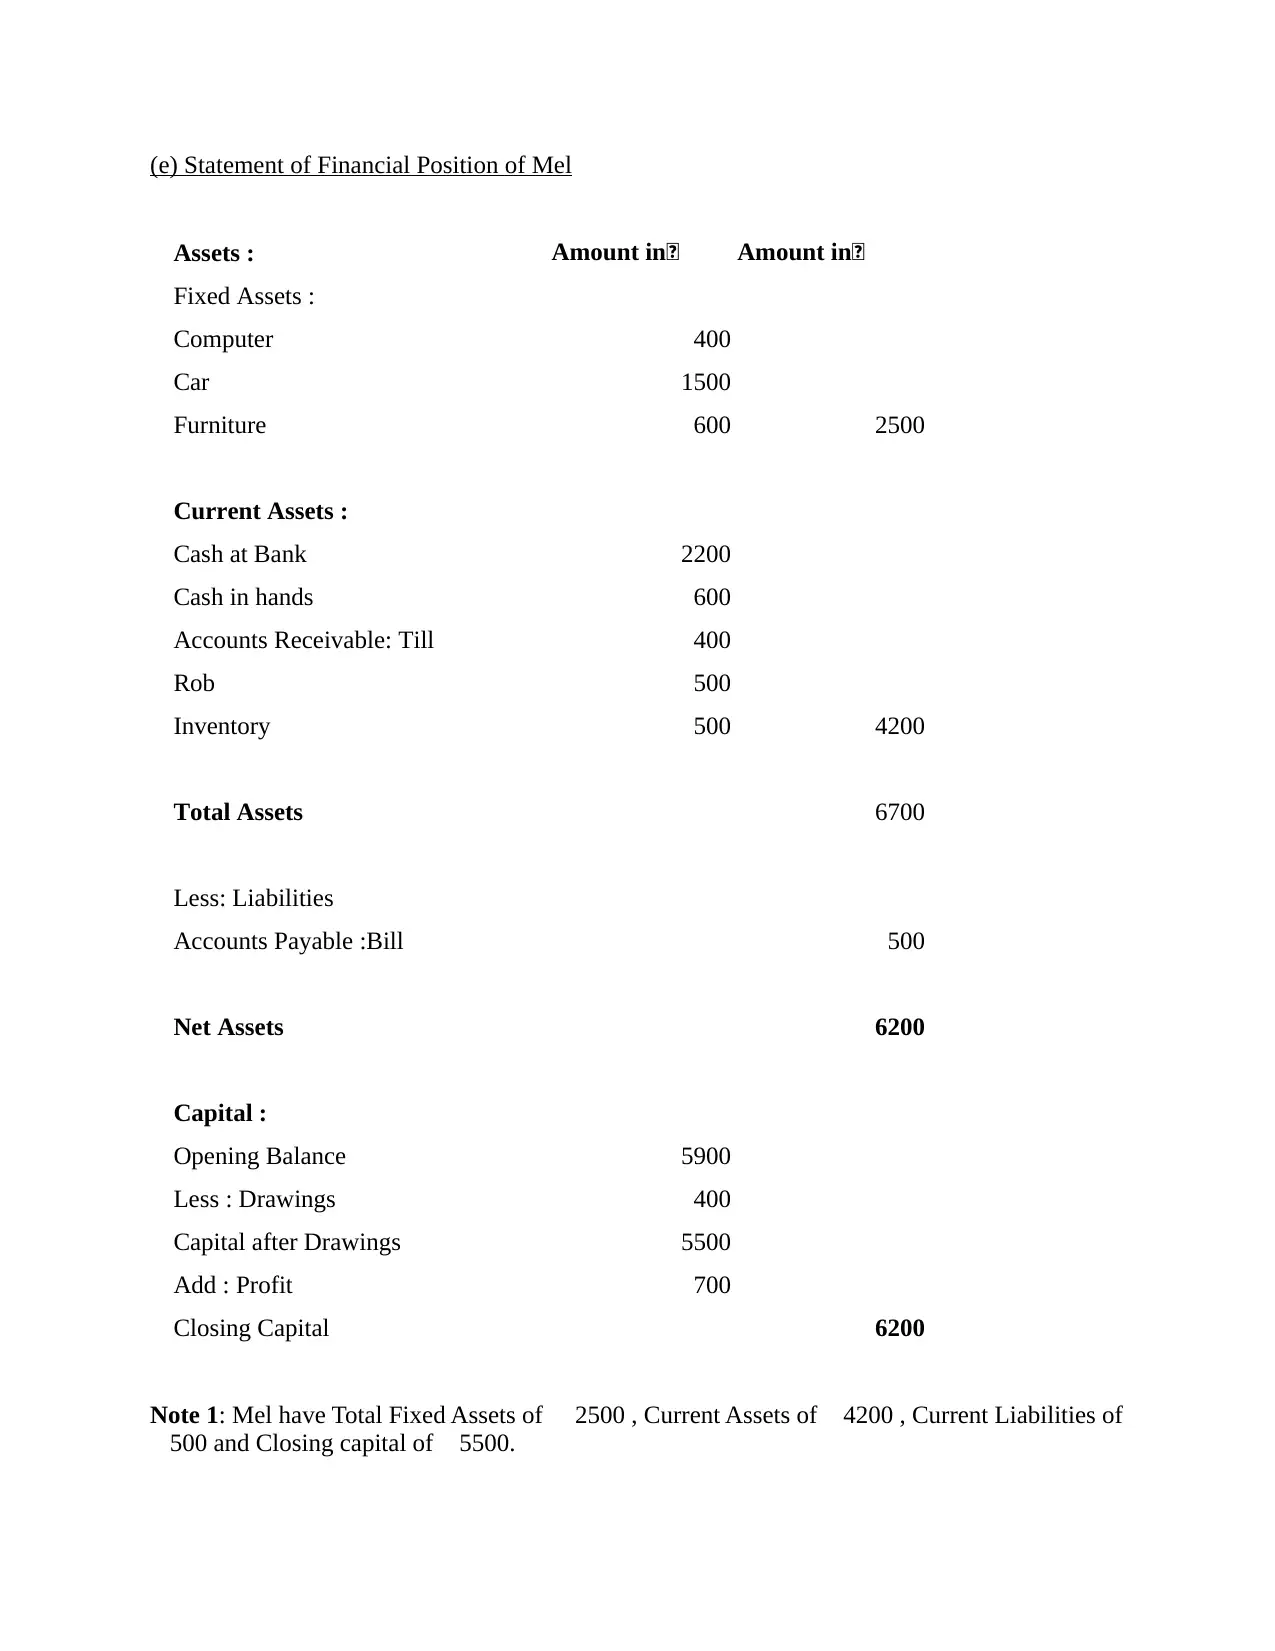
(e) Statement of Financial Position of Mel
Assets : Amount in£ Amount in£
Fixed Assets :
Computer 400
Car 1500
Furniture 600 2500
Current Assets :
Cash at Bank 2200
Cash in hands 600
Accounts Receivable: Till 400
Rob 500
Inventory 500 4200
Total Assets 6700
Less: Liabilities
Accounts Payable :Bill 500
Net Assets 6200
Capital :
Opening Balance 5900
Less : Drawings 400
Capital after Drawings 5500
Add : Profit 700
Closing Capital 6200
Note 1: Mel have Total Fixed Assets of £ 2500 , Current Assets of £4200 , Current Liabilities of
£500 and Closing capital of £5500.
Paraphrase This Document
Need a fresh take? Get an instant paraphrase of this document with our AI Paraphraser
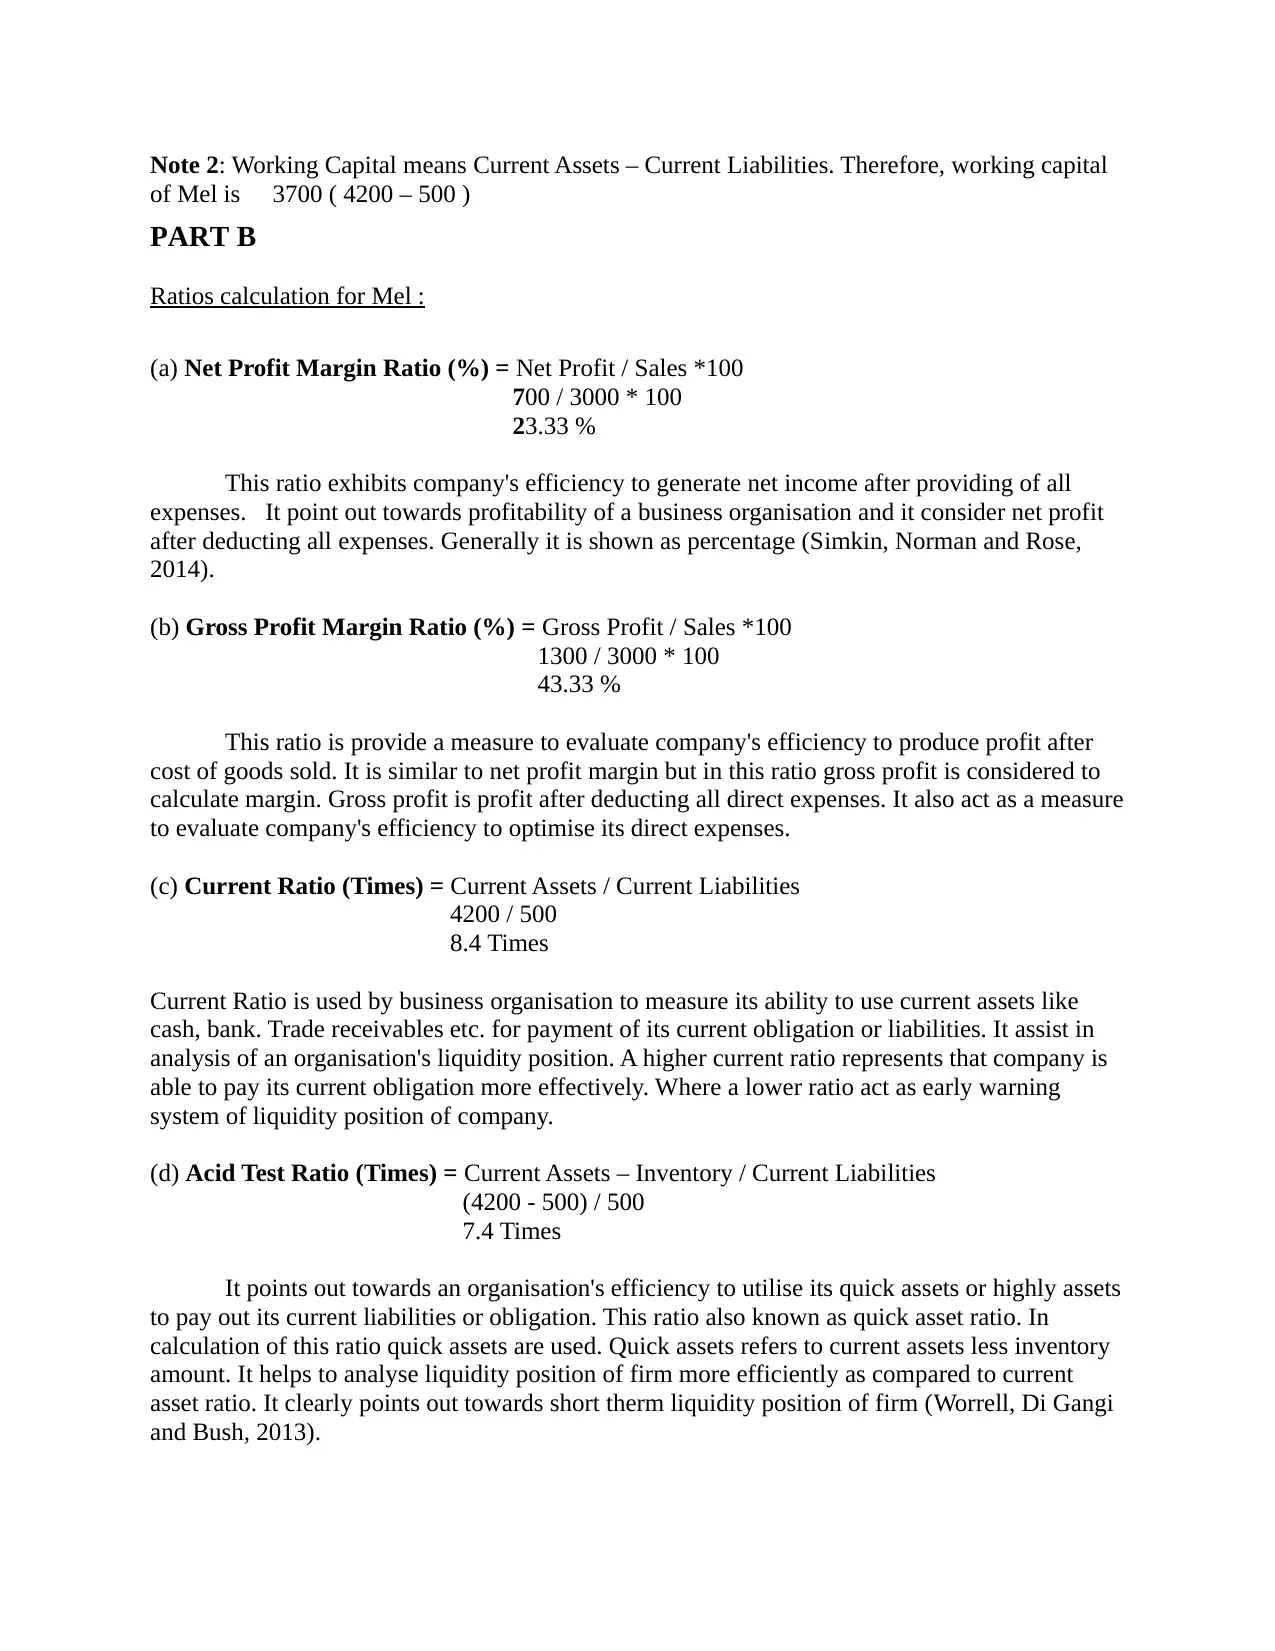
Note 2: Working Capital means Current Assets – Current Liabilities. Therefore, working capital
of Mel is £ 3700 ( 4200 – 500 )
PART B
Ratios calculation for Mel :
(a) Net Profit Margin Ratio (%) = Net Profit / Sales *100
700 / 3000 * 100
23.33 %
This ratio exhibits company's efficiency to generate net income after providing of all
expenses. It point out towards profitability of a business organisation and it consider net profit
after deducting all expenses. Generally it is shown as percentage (Simkin, Norman and Rose,
2014).
(b) Gross Profit Margin Ratio (%) = Gross Profit / Sales *100
1300 / 3000 * 100
43.33 %
This ratio is provide a measure to evaluate company's efficiency to produce profit after
cost of goods sold. It is similar to net profit margin but in this ratio gross profit is considered to
calculate margin. Gross profit is profit after deducting all direct expenses. It also act as a measure
to evaluate company's efficiency to optimise its direct expenses.
(c) Current Ratio (Times) = Current Assets / Current Liabilities
4200 / 500
8.4 Times
Current Ratio is used by business organisation to measure its ability to use current assets like
cash, bank. Trade receivables etc. for payment of its current obligation or liabilities. It assist in
analysis of an organisation's liquidity position. A higher current ratio represents that company is
able to pay its current obligation more effectively. Where a lower ratio act as early warning
system of liquidity position of company.
(d) Acid Test Ratio (Times) = Current Assets – Inventory / Current Liabilities
(4200 - 500) / 500
7.4 Times
It points out towards an organisation's efficiency to utilise its quick assets or highly assets
to pay out its current liabilities or obligation. This ratio also known as quick asset ratio. In
calculation of this ratio quick assets are used. Quick assets refers to current assets less inventory
amount. It helps to analyse liquidity position of firm more efficiently as compared to current
asset ratio. It clearly points out towards short therm liquidity position of firm (Worrell, Di Gangi
and Bush, 2013).
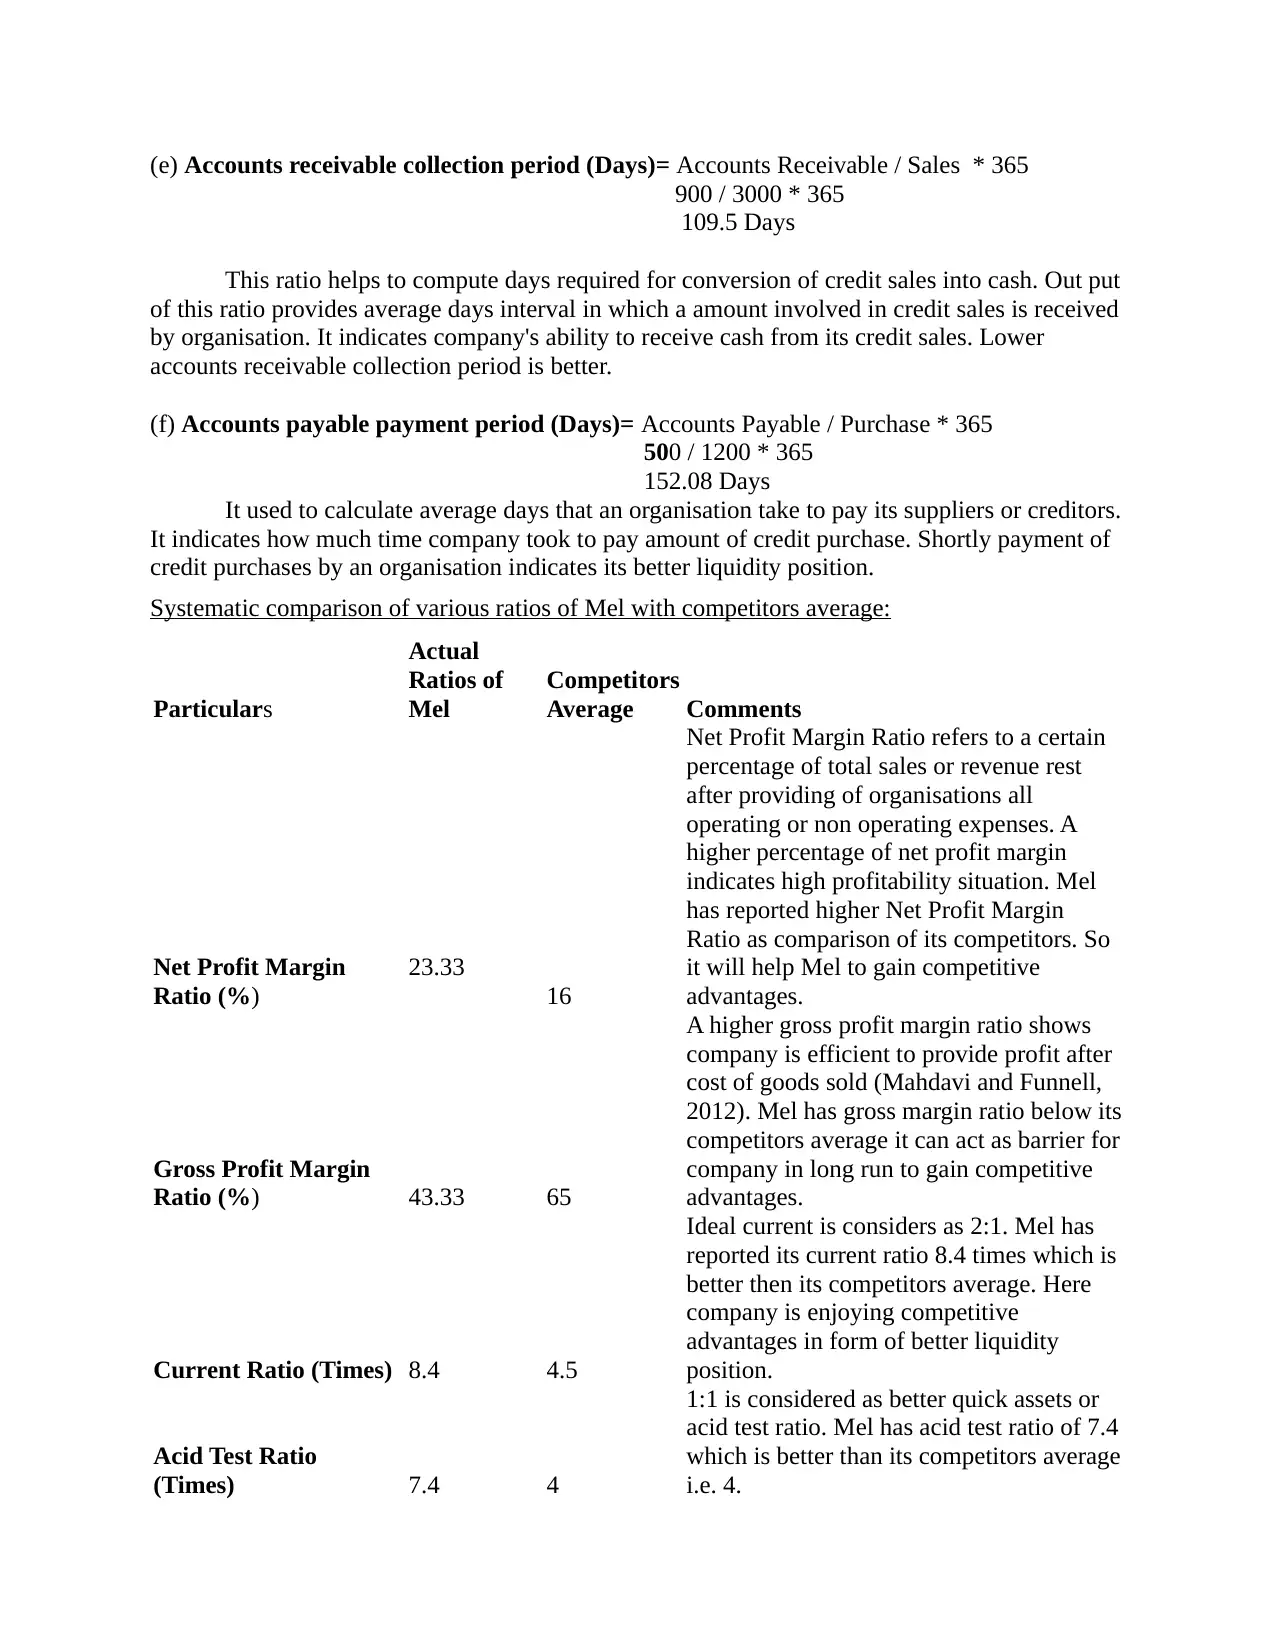
(e) Accounts receivable collection period (Days)= Accounts Receivable / Sales * 365
900 / 3000 * 365
109.5 Days
This ratio helps to compute days required for conversion of credit sales into cash. Out put
of this ratio provides average days interval in which a amount involved in credit sales is received
by organisation. It indicates company's ability to receive cash from its credit sales. Lower
accounts receivable collection period is better.
(f) Accounts payable payment period (Days)= Accounts Payable / Purchase * 365
500 / 1200 * 365
152.08 Days
It used to calculate average days that an organisation take to pay its suppliers or creditors.
It indicates how much time company took to pay amount of credit purchase. Shortly payment of
credit purchases by an organisation indicates its better liquidity position.
Systematic comparison of various ratios of Mel with competitors average:
Particulars
Actual
Ratios of
Mel
Competitors
Average Comments
Net Profit Margin
Ratio (%)
23.33
16
Net Profit Margin Ratio refers to a certain
percentage of total sales or revenue rest
after providing of organisations all
operating or non operating expenses. A
higher percentage of net profit margin
indicates high profitability situation. Mel
has reported higher Net Profit Margin
Ratio as comparison of its competitors. So
it will help Mel to gain competitive
advantages.
Gross Profit Margin
Ratio (%) 43.33 65
A higher gross profit margin ratio shows
company is efficient to provide profit after
cost of goods sold (Mahdavi and Funnell,
2012). Mel has gross margin ratio below its
competitors average it can act as barrier for
company in long run to gain competitive
advantages.
Current Ratio (Times) 8.4 4.5
Ideal current is considers as 2:1. Mel has
reported its current ratio 8.4 times which is
better then its competitors average. Here
company is enjoying competitive
advantages in form of better liquidity
position.
Acid Test Ratio
(Times) 7.4 4
1:1 is considered as better quick assets or
acid test ratio. Mel has acid test ratio of 7.4
which is better than its competitors average
i.e. 4.
⊘ This is a preview!⊘
Do you want full access?
Subscribe today to unlock all pages.
Trusted by 1+ million students worldwide
1 out of 12
Related Documents


Your All-in-One AI-Powered Toolkit for Academic Success.
+13062052269
info@desklib.com
Available 24*7 on WhatsApp / Email
![[object Object]](/_next/static/media/star-bottom.7253800d.svg)
Unlock your academic potential
Copyright © 2020–2026 A2Z Services. All Rights Reserved. Developed and managed by ZUCOL.