BAC115 Quantitative Methods: Gourmet Delight Service Time Analysis

Verified

Added on  2023/06/03

|7
|475
|411
Report
AI Summary
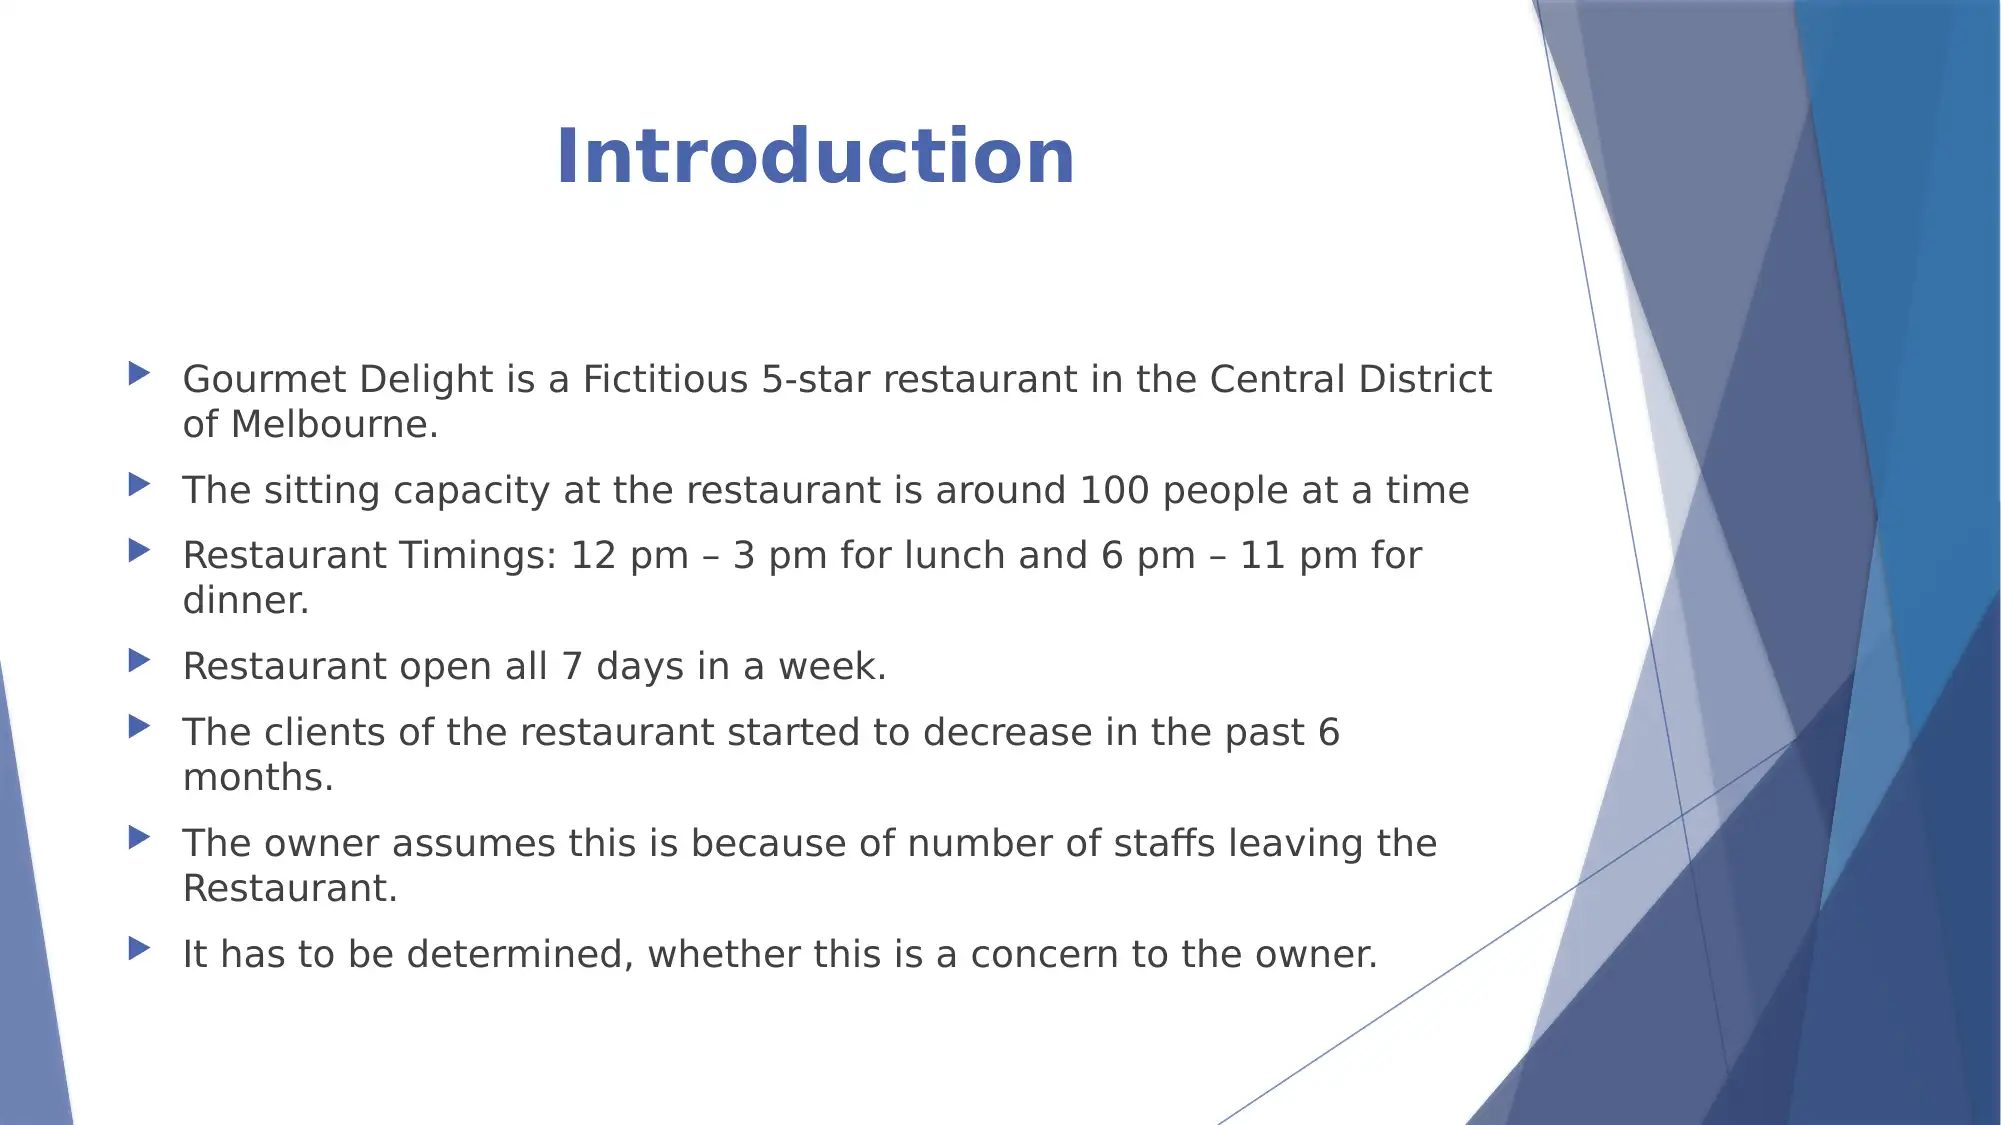
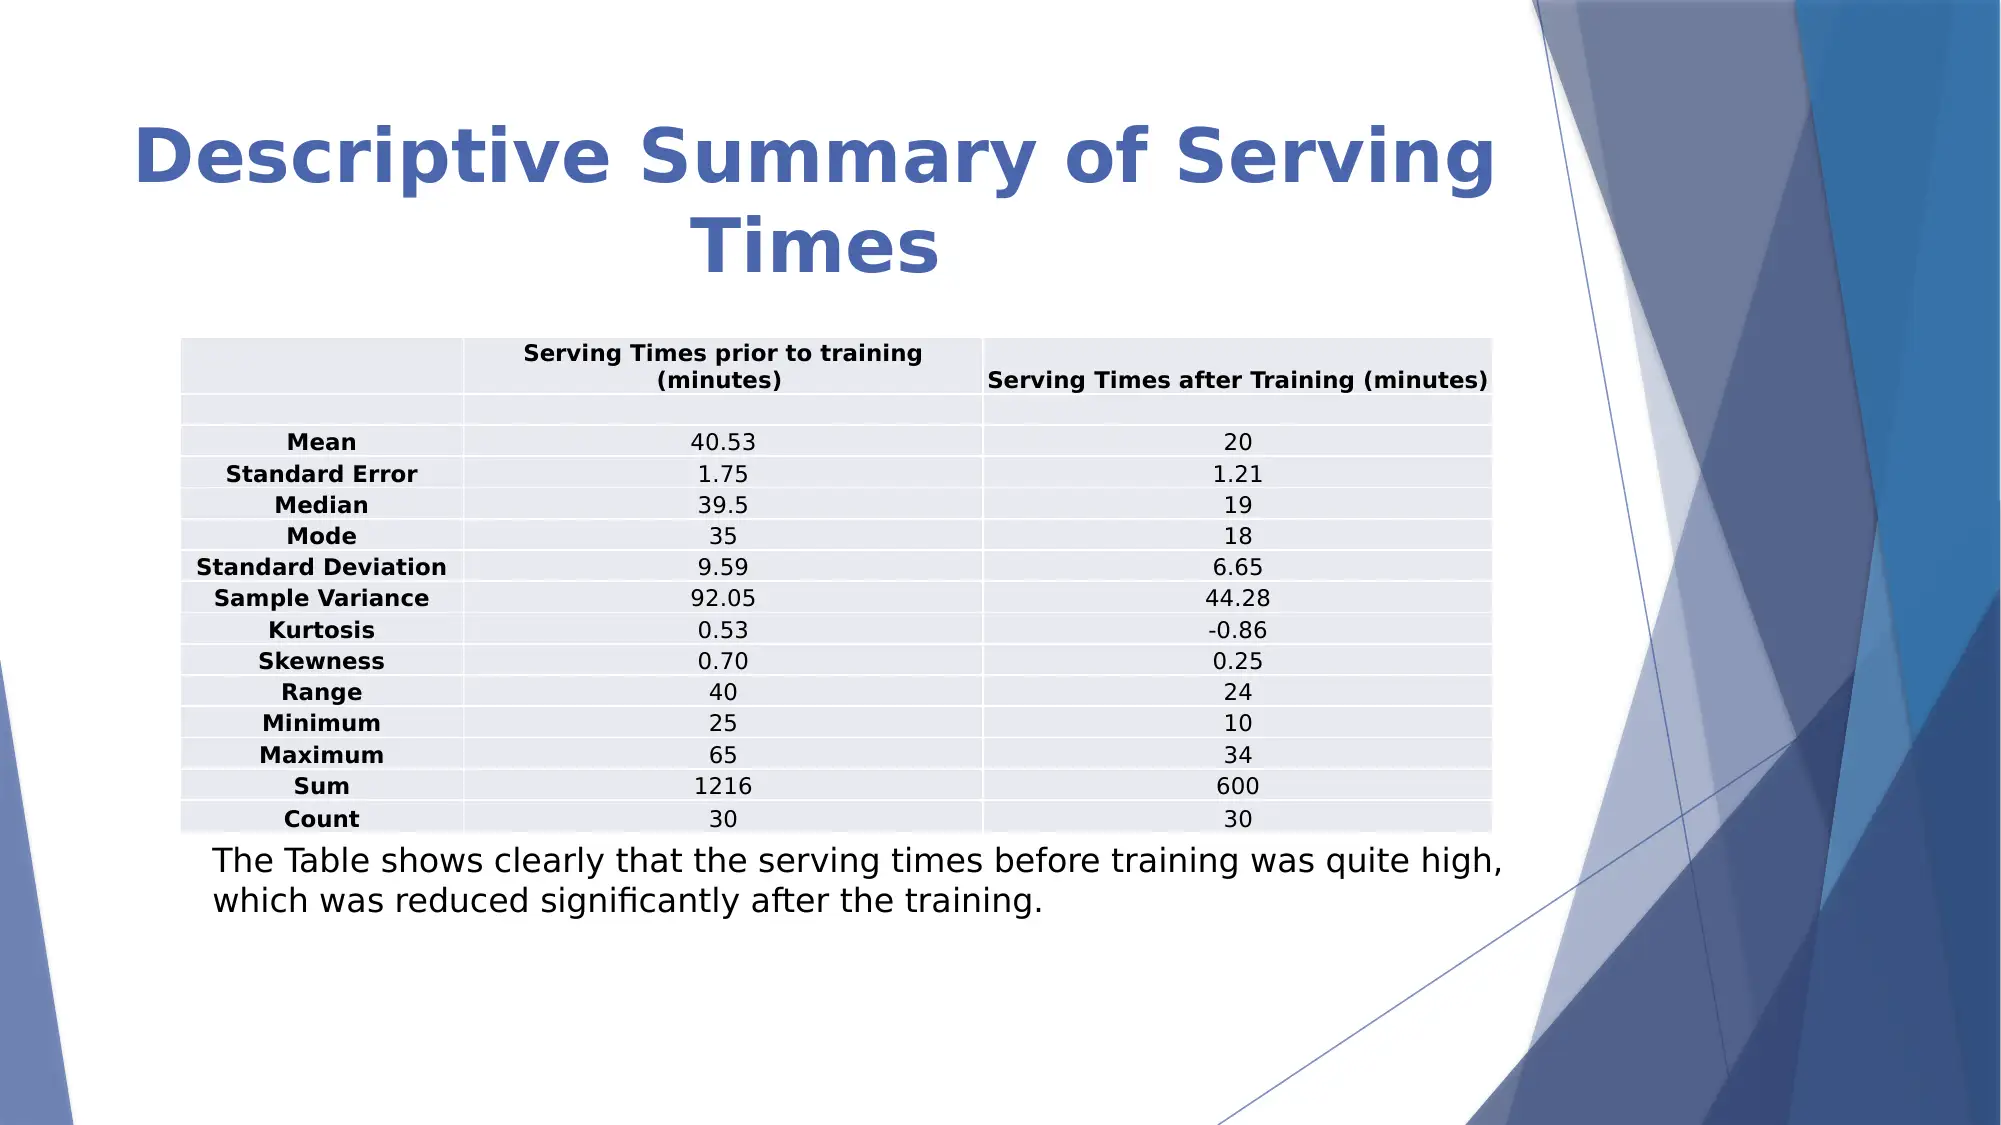
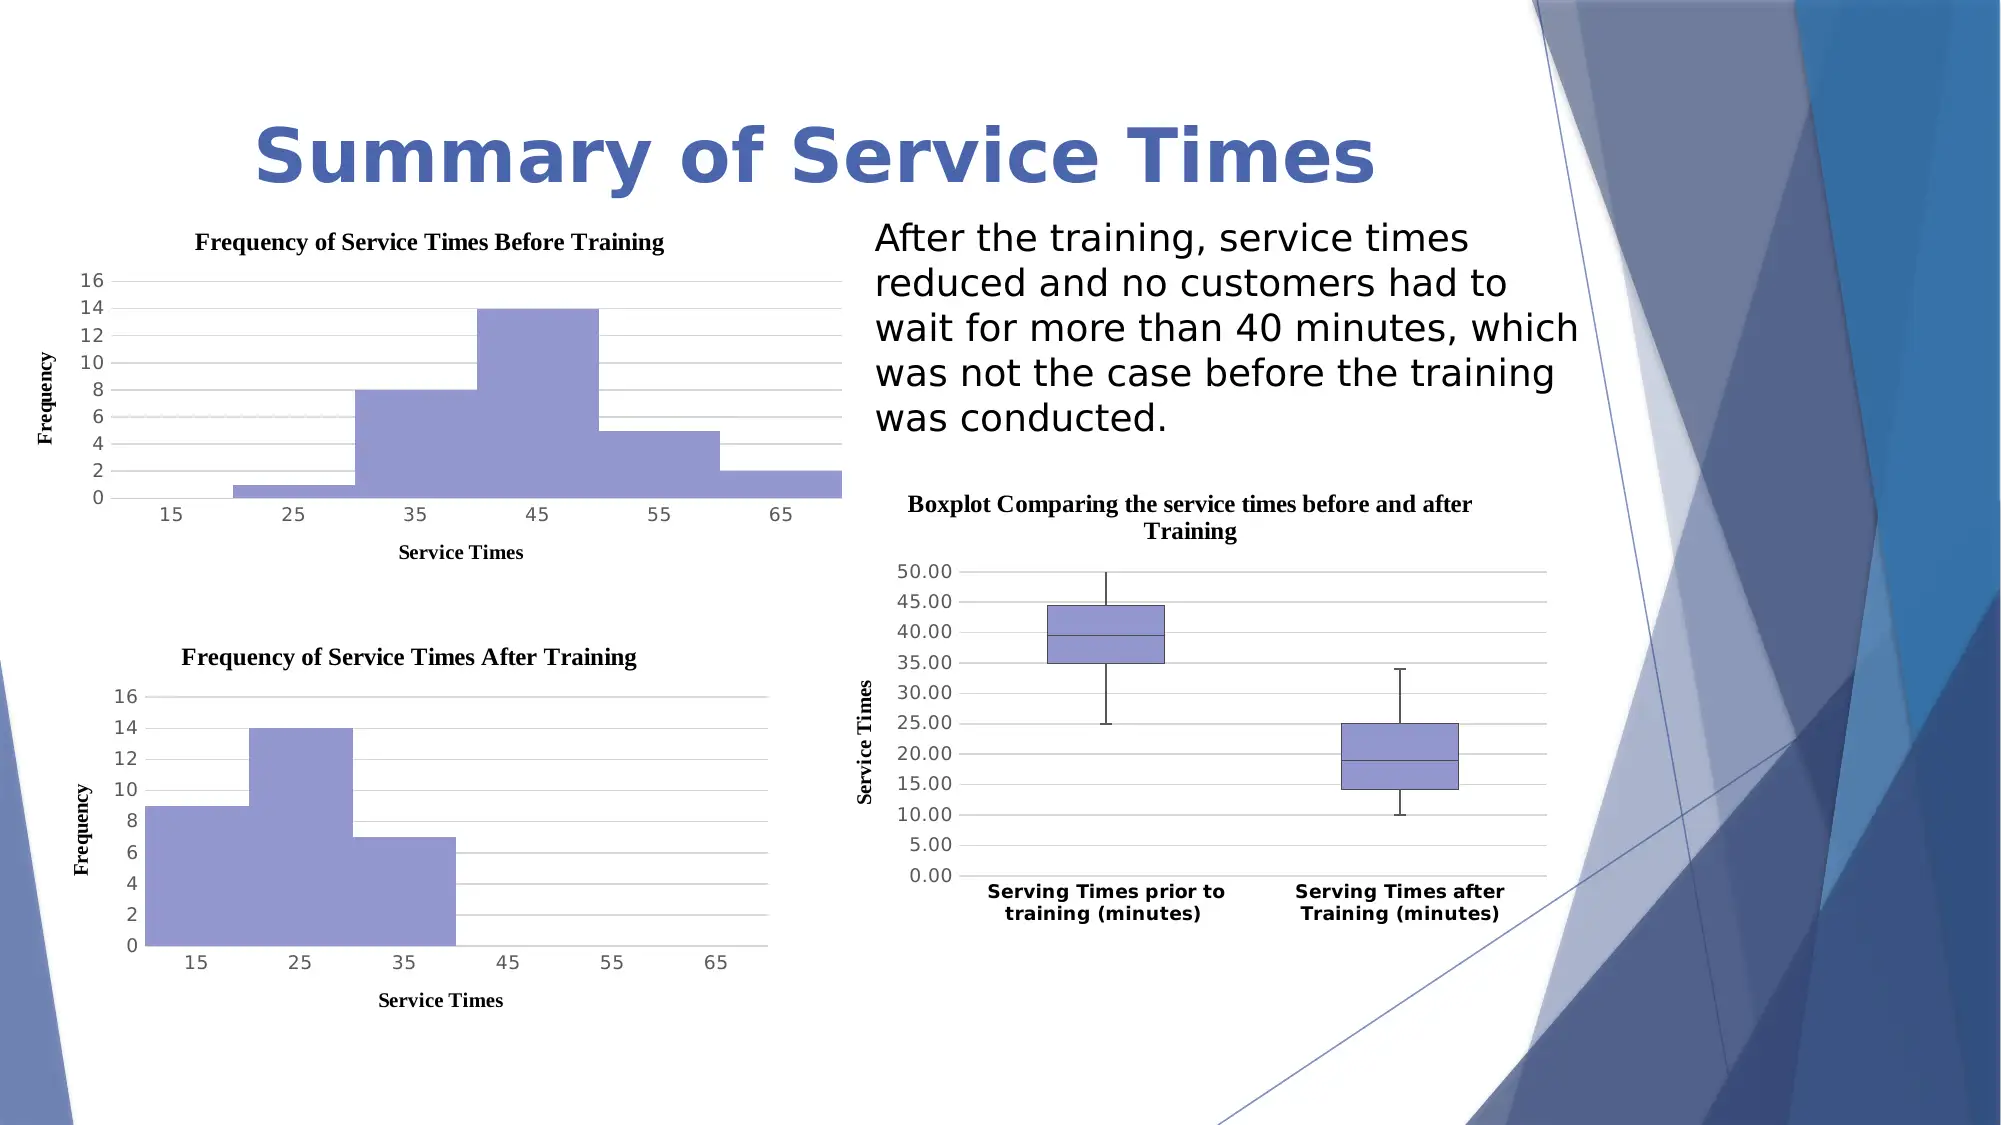
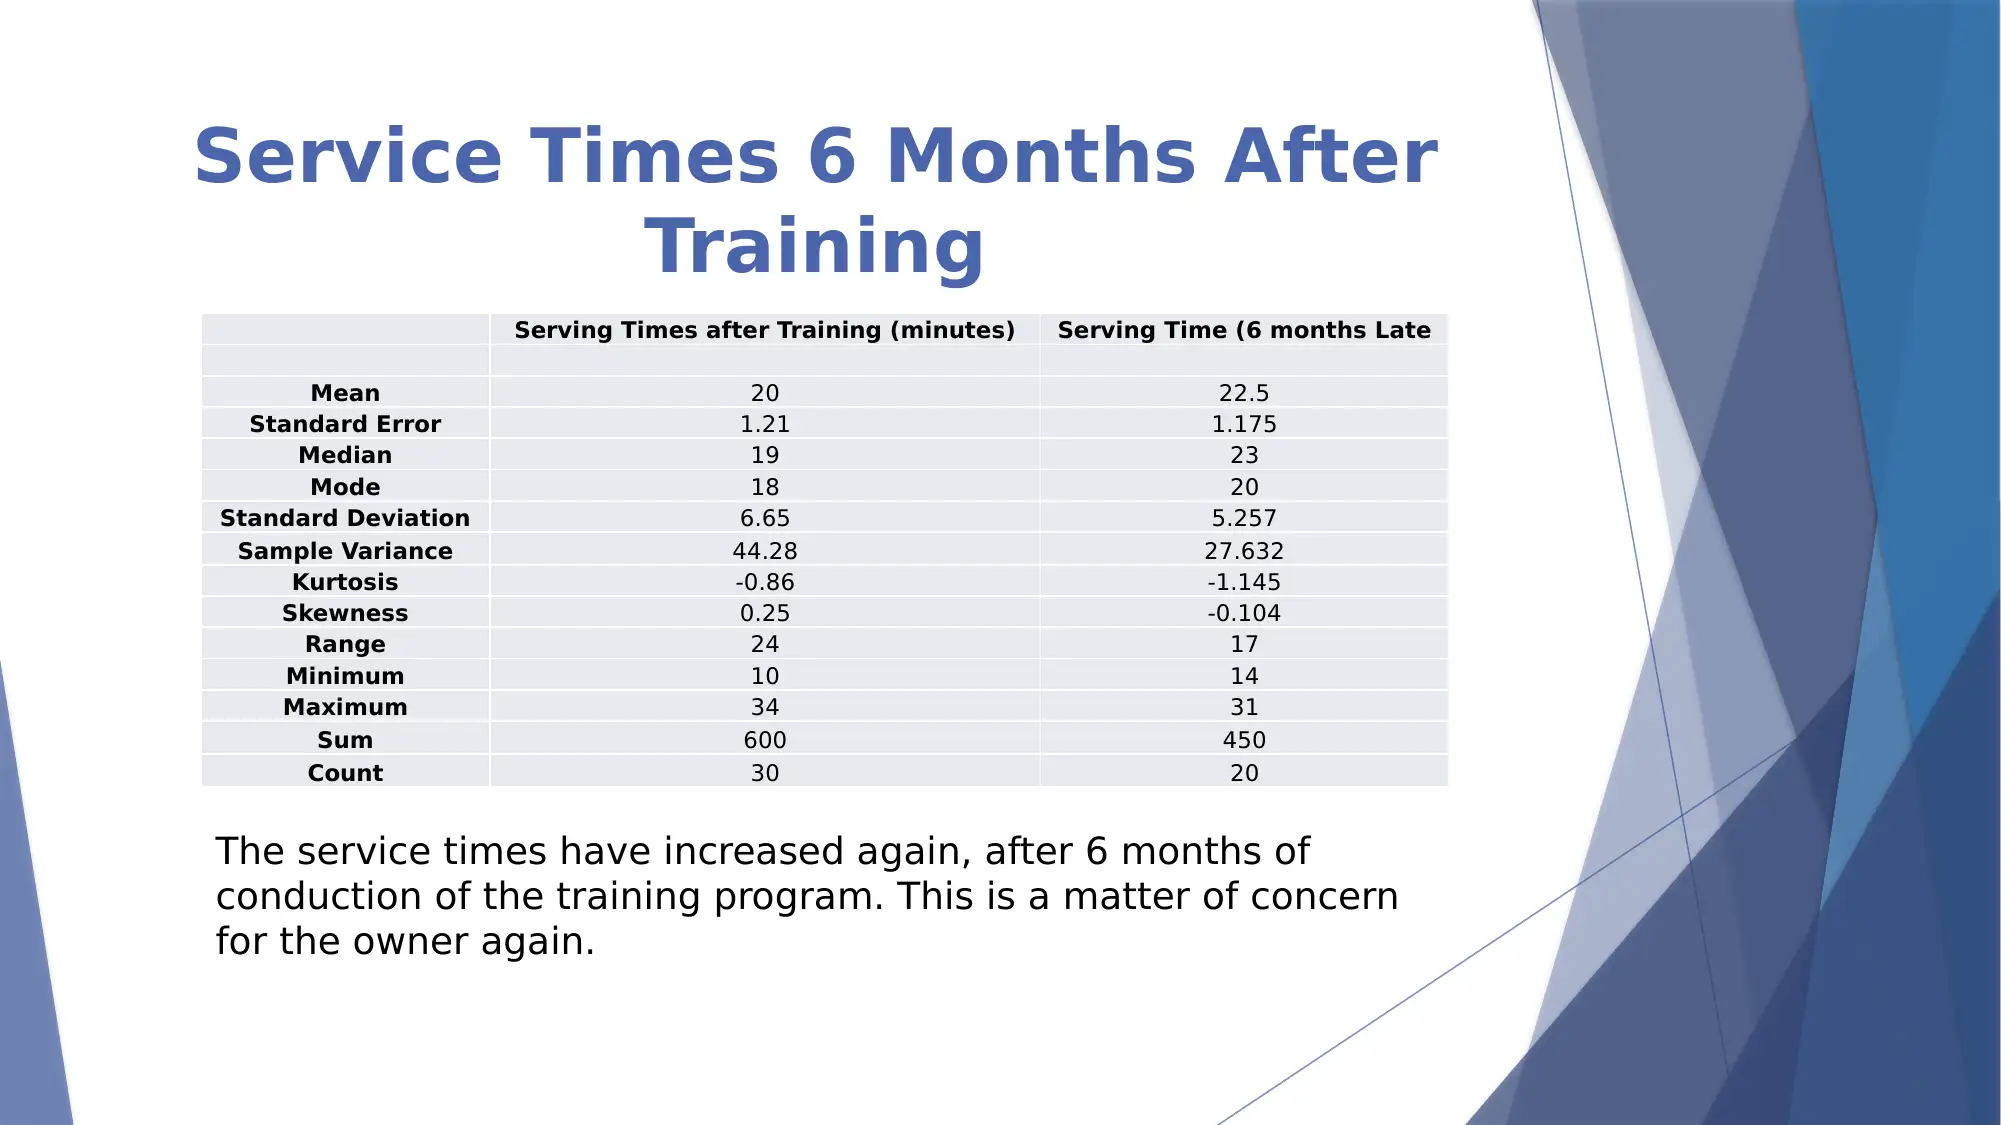
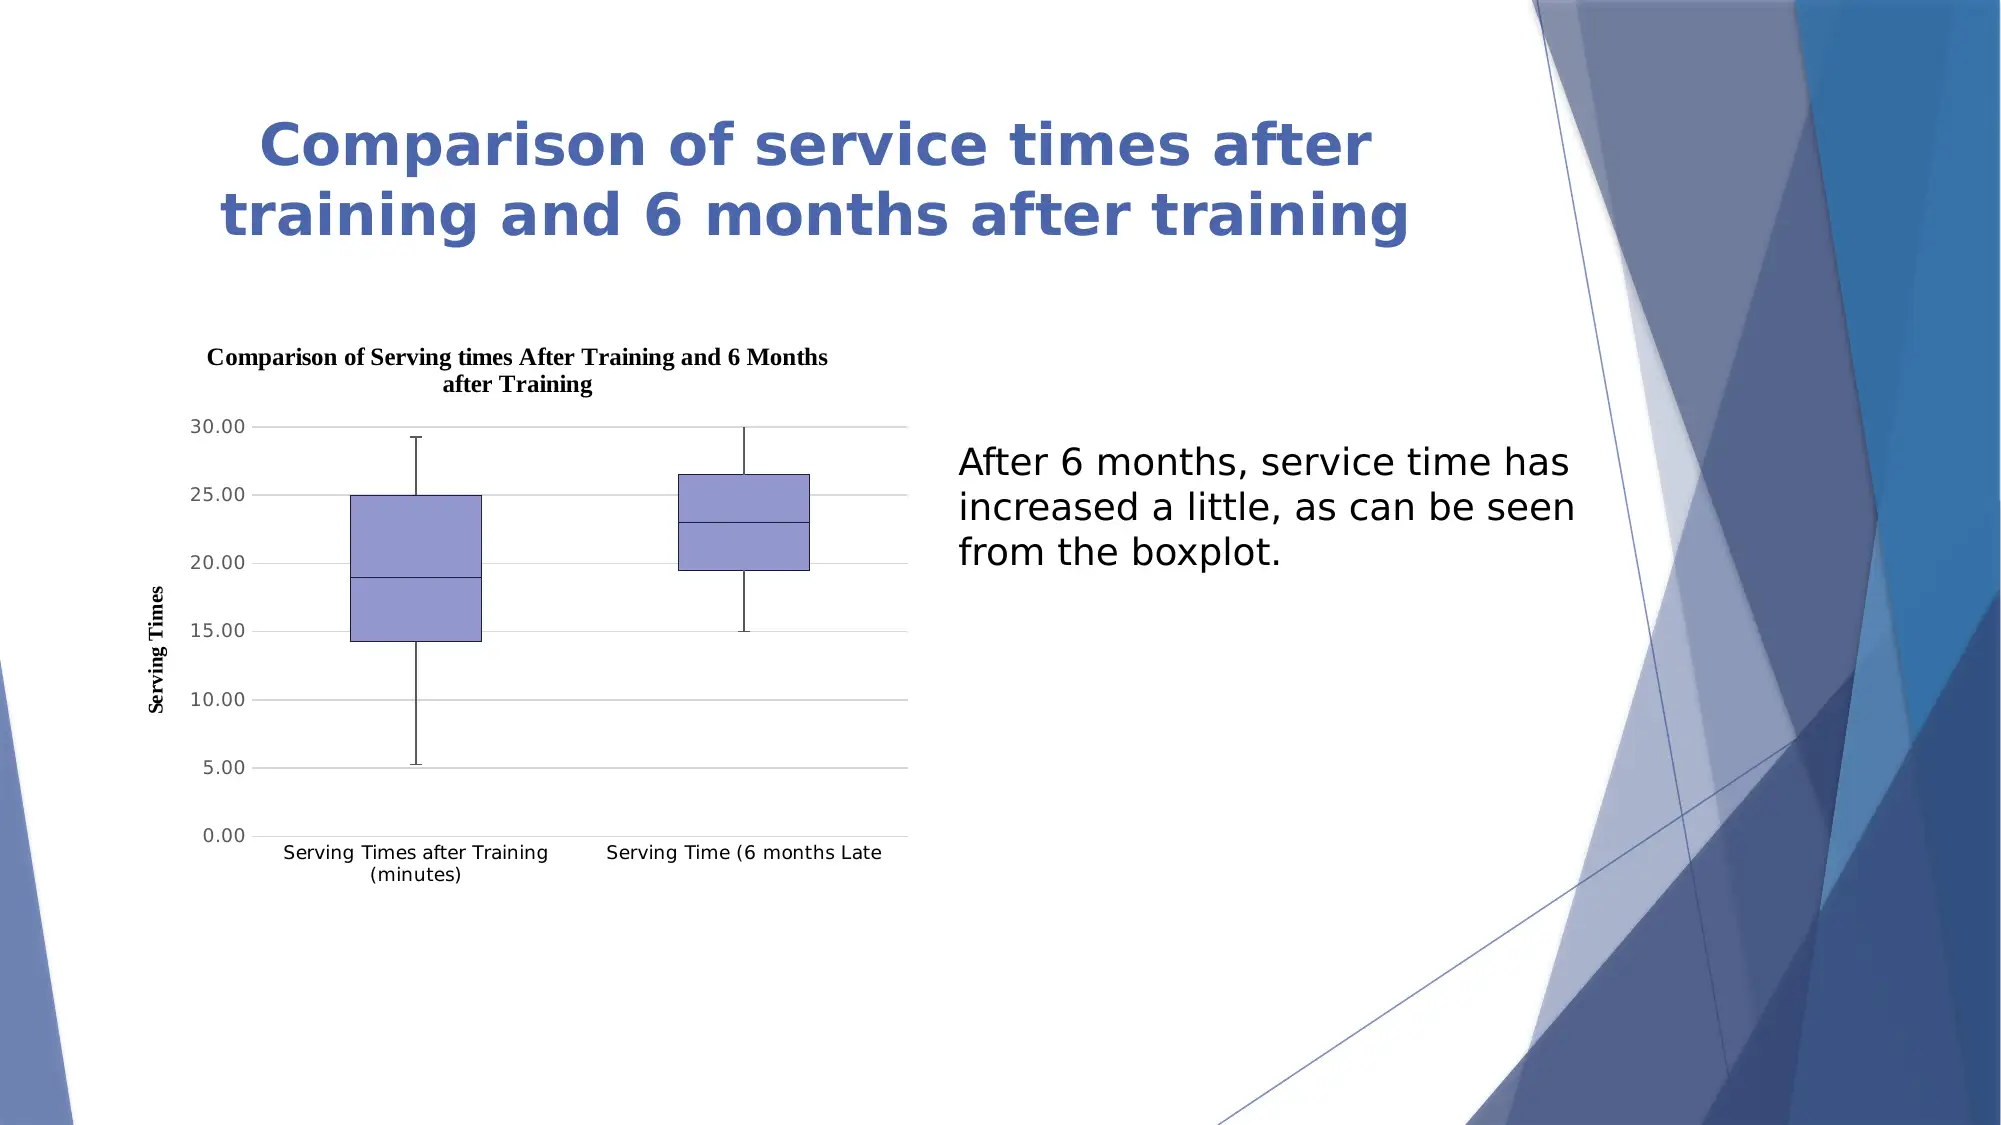
This report presents a quantitative analysis of service times at the fictitious 5-star restaurant, Gourmet Delight, in Melbourne. The restaurant owner is concerned about declining clientele and suspects staff turnover is the cause. The report analyzes service times before and after a training intervention, using descriptive statistics such as mean, median, standard deviation, and range. The initial analysis reveals a significant reduction in service times following the training. However, a follow-up analysis six months later indicates a slight increase in service times, raising renewed concerns for the owner. The report uses boxplots and frequency distributions to visually compare service times across different periods, highlighting the impact of the training program and the subsequent regression. This analysis helps to quantify the issue and provides a basis for further investigation and potential solutions.
tabler-icon-diamond-filled.svg

Contribute Materials

Your contribution can guide someone’s learning journey. Share your documents today.
Document Page
Quantitative
Methods
Name of the Student
Name of the University
Student ID
tabler-icon-diamond-filled.svg

Secure Best Marks with AI Grader

Need help grading? Try our AI Grader for instant feedback on your assignments.
Document Page
Introduction
Gourmet Delight is a Fictitious 5-star restaurant in the Central District
of Melbourne.
The sitting capacity at the restaurant is around 100 people at a time
Restaurant Timings: 12 pm – 3 pm for lunch and 6 pm – 11 pm for
dinner.
Restaurant open all 7 days in a week.
The clients of the restaurant started to decrease in the past 6
months.
The owner assumes this is because of number of staffs leaving the
Restaurant.
It has to be determined, whether this is a concern to the owner.
Document Page
Descriptive Summary of Serving
Times
The Table shows clearly that the serving times before training was quite high,
which was reduced significantly after the training.
Serving Times prior to training
(minutes) Serving Times after Training (minutes)
Mean 40.53 20
Standard Error 1.75 1.21
Median 39.5 19
Mode 35 18
Standard Deviation 9.59 6.65
Sample Variance 92.05 44.28
Kurtosis 0.53 -0.86
Skewness 0.70 0.25
Range 40 24
Minimum 25 10
Maximum 65 34
Sum 1216 600
Count 30 30
Document Page
Summary of Service Times
15 25 35 45 55 65
0
2
4
6
8
10
12
14
16
Frequency of Service Times After Training
Service Times
Frequency
After the training, service times
reduced and no customers had to
wait for more than 40 minutes, which
was not the case before the training
was conducted.
15 25 35 45 55 65
0
2
4
6
8
10
12
14
16
Frequency of Service Times Before Training
Service Times
Frequency
Serving Times prior to
training (minutes)
Serving Times after
Training (minutes)
0.00
5.00
10.00
15.00
20.00
25.00
30.00
35.00
40.00
45.00
50.00
Boxplot Comparing the service times before and after
Training
Service Times
tabler-icon-diamond-filled.svg

Secure Best Marks with AI Grader

Need help grading? Try our AI Grader for instant feedback on your assignments.
Document Page
Service Times 6 Months After
Training
Serving Times after Training (minutes) Serving Time (6 months Late
Mean 20 22.5
Standard Error 1.21 1.175
Median 19 23
Mode 18 20
Standard Deviation 6.65 5.257
Sample Variance 44.28 27.632
Kurtosis -0.86 -1.145
Skewness 0.25 -0.104
Range 24 17
Minimum 10 14
Maximum 34 31
Sum 600 450
Count 30 20
The service times have increased again, after 6 months of
conduction of the training program. This is a matter of concern
for the owner again.
Document Page
Comparison of service times after
training and 6 months after training
Serving Times after Training
(minutes)
Serving Time (6 months Late
0.00
5.00
10.00
15.00
20.00
25.00
30.00
Comparison of Serving times After Training and 6 Months
after Training
Serving Times
After 6 months, service time has
increased a little, as can be seen
from the boxplot.
Document Page
Thank You
chevron_up_icon
1 out of 7
circle_padding
hide_on_mobile
zoom_out_icon
logo.png

Your All-in-One AI-Powered Toolkit for Academic Success.

Available 24*7 on WhatsApp / Email

[object Object]