Quantitative Methods BAC115: Restaurant Service Time Analysis

Verified

Added on  2023/06/03

|5
|884
|208
Report
AI Summary
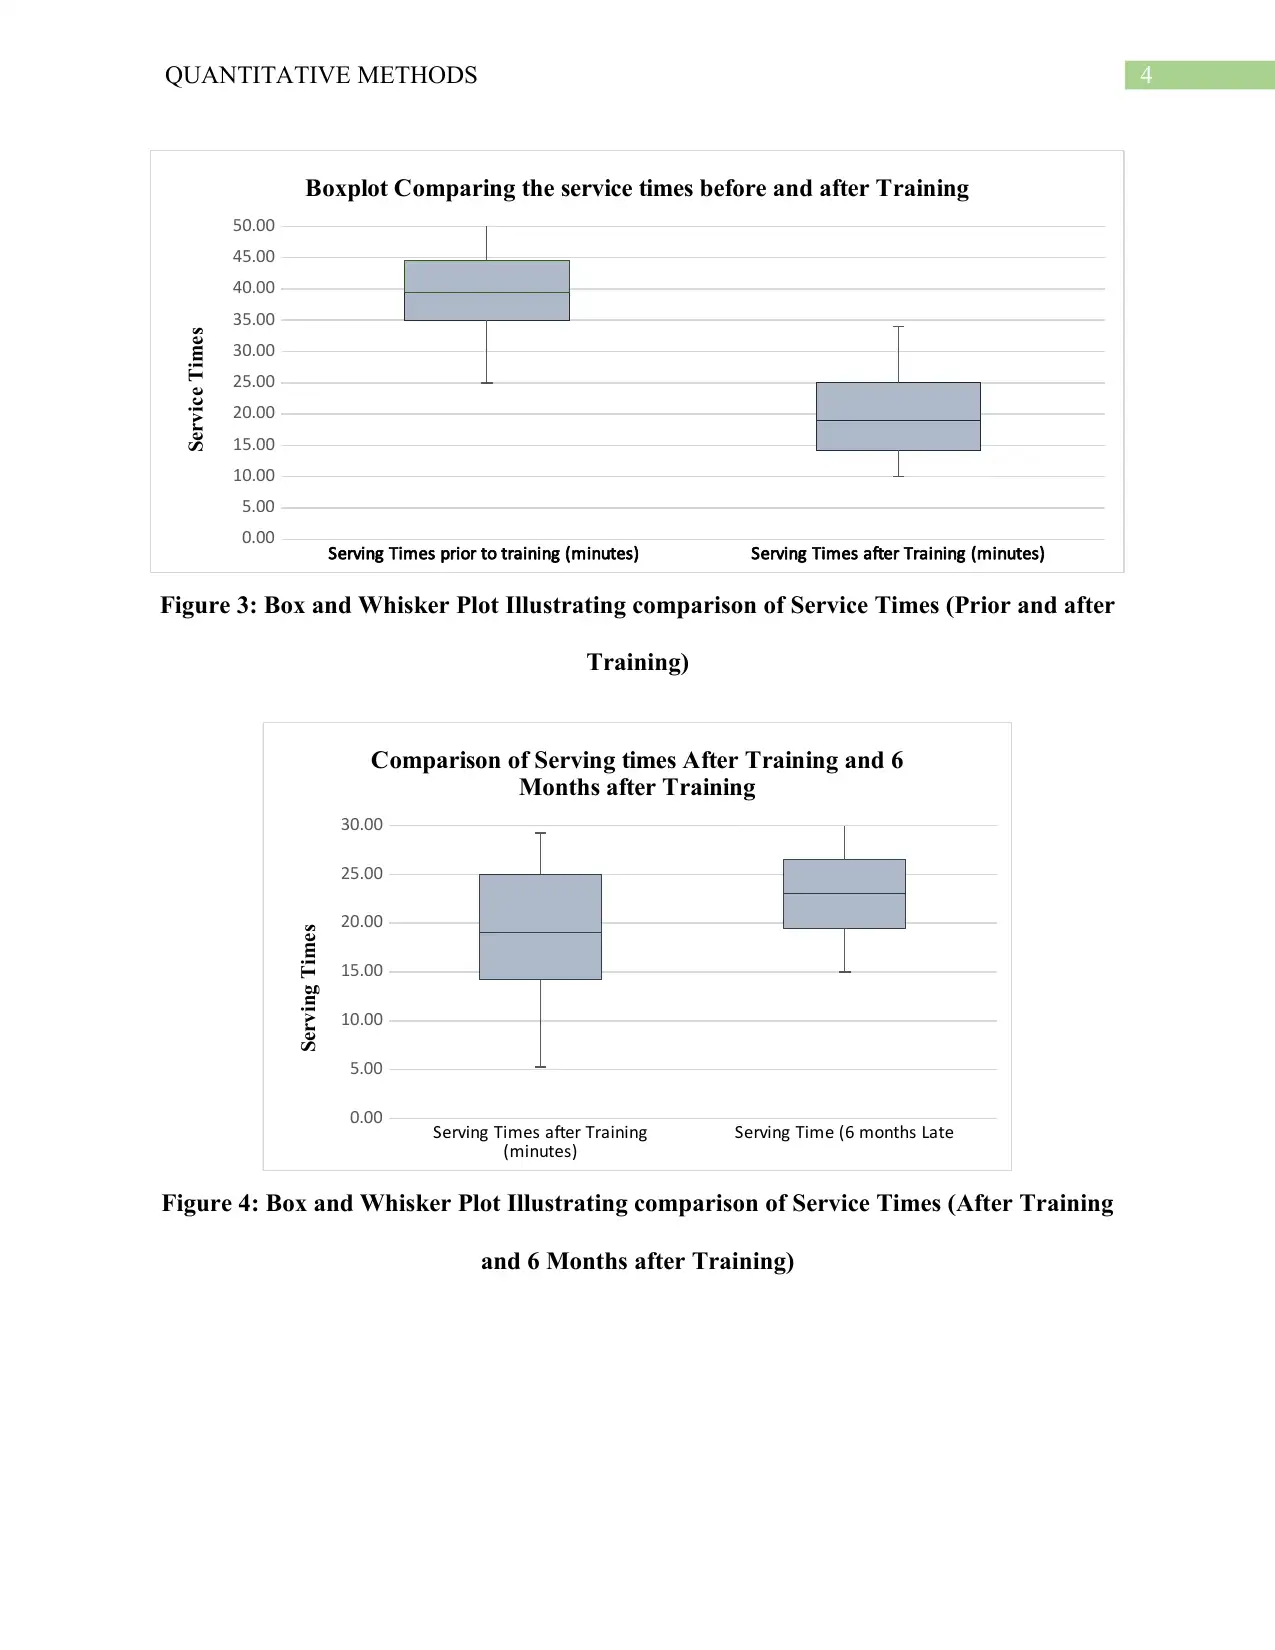
This report analyzes service times at a fictitious 5-star restaurant in Melbourne, Australia, before and after a staff training program, and six months later. The analysis uses statistical methods to assess the effectiveness of the training and the impact of staff turnover on service efficiency. Key findings include a significant reduction in service times immediately after training, followed by a deterioration six months later, indicating a need for staff retention or recruitment strategies. Histograms and boxplots visually represent the data, highlighting the changes in service time distribution. The report concludes that the restaurant owner should address the staffing issues to maintain efficient service and customer satisfaction. Desklib provides access to similar solved assignments and past papers for students.
tabler-icon-diamond-filled.svg

Contribute Materials

Your contribution can guide someone’s learning journey. Share your documents today.
Document Page
Running Head: QUANTITATIVE METHODS
Quantitative Methods
Name of the Student
Name of the University
Student ID
tabler-icon-diamond-filled.svg

Secure Best Marks with AI Grader

Need help grading? Try our AI Grader for instant feedback on your assignments.
Document Page
1QUANTITATIVE METHODS
Introduction
One of the fictitious 5-star restaurant located in the Central Business District of Australia,
Melbourne is Gourmet Delight. This 5-Star restaurant has a sitting capacity of around 100 people
at one time. The restaurant is not open for the whole day, and has diner timings from 12 pm – 3
pm for lunch and from 6 pm – 11 pm for dinner, for all the 7 days in a week. The restaurant
owner has observed over time that there has been a decrease in the number of clients visiting the
restaurant. This has been mostly due to the fact that the service of the staffs in the restaurant has
not been efficient. According to the owner of the restaurant, a service time more than 20 minutes
is not efficient. Thus, in order to provide efficient service to the customers and retain the clients,
the owner arranged a training program for the staffs. The difference in the service after the
training has been estimated in this research. Further, after 6 months of the training program,
some staffs have been leaving the restaurant. The owner also wants to find out whether that is a
matter of concern.
Analysis of Service Times
The owner of the restaurant have provided with data on the service times prior training,
after training and 6 months after training. A summary of the service times has been provided in
the following table. It can be seen from the table that the average service time has been 40.53
minutes prior to training, which was quite high. It can also be noted from the table that 50
percent of the customers has experienced a service time of more than 39.5 minutes. The standard
deviation of the service times has been 9.59 minutes, which is very small. Thus, it can be said
that the service times have mostly been close to the average servivce time.
Document Page
2QUANTITATIVE METHODS
On the other hand, after training, it has been observed that the service times has reduced a
lot with an average of 20 minutes, which is also considered as efficient service. Further, it can be
seen from the summary of the service times 6 months after training, the service times has
increased considerably again to more than 20 minutes. Thus, the service has been detoriating due
to the decrease in the staffs. Hence, the owner must be concerned about this issue and consider
seriously on retaining the staffs or recruiting trainned staffs, so that the service time is not
affected again.
Table 1: Summary of Service Times
Serving Times prior to
training (minutes)
Serving Times after
Training (minutes)
Serving Time (6
months Late
Mean 40.53 20 22.5
Standard
Error 1.75 1.21 1.175
Median 39.5 19 23
Mode 35 18 20
Standard
Deviation 9.59 6.65 5.257
Sample
Variance 92.05 44.28 27.632
Kurtosis 0.53 -0.86 -1.145
Skewness 0.70 0.25 -0.104
Range 40 24 17
Minimum 25 10 14
Maximum 65 34 31
Sum 1216 600 450
Count 30 30 20
The summary of the service times has also been illustrated graphically with the help of
histograms and boxplots. It can be seen from the figures that before the training, there has been
no customer who was served in less than 20 minutes. The highest waiting time has been 65
minutes, which is more than an hour. However, it can be seen that this problem was resolved
Document Page
3QUANTITATIVE METHODS
after the training. Service time has been reduced and no customers has been found to be served in
more than 34 minutes. This improvement has been significant.
The boxplot comparing the service times after training and 6 months after training shows
that there has been slight increase in the service times and the customers are waiting for time
longer than before.
15 25 35 45 55 65
0
2
4
6
8
10
12
14
16
Frequency of Service Times Before Training
Service Times
Frequency
Figure 1: Histogram Illustrating Service Times (Prior Training)
15 25 35 45 55 65
0
2
4
6
8
10
12
14
16
Frequency of Service Times After Training
Service Times
Frequency
Figure 2: Histogram Illustrating Service Times (After Training)
tabler-icon-diamond-filled.svg

Secure Best Marks with AI Grader

Need help grading? Try our AI Grader for instant feedback on your assignments.
Document Page
4QUANTITATIVE METHODS
Serving Times prior to training (minutes) Serving Times after Training (minutes)
0.00
5.00
10.00
15.00
20.00
25.00
30.00
35.00
40.00
45.00
50.00
Boxplot Comparing the service times before and after Training
Service Times
Figure 3: Box and Whisker Plot Illustrating comparison of Service Times (Prior and after
Training)
Serving Times after Training
(minutes) Serving Time (6 months Late
0.00
5.00
10.00
15.00
20.00
25.00
30.00
Comparison of Serving times After Training and 6
Months after Training
Serving Times
Figure 4: Box and Whisker Plot Illustrating comparison of Service Times (After Training
and 6 Months after Training)
chevron_up_icon
1 out of 5
circle_padding
hide_on_mobile
zoom_out_icon
logo.png

Your All-in-One AI-Powered Toolkit for Academic Success.

Available 24*7 on WhatsApp / Email

[object Object]