Statistical Analysis of a Mental Health Wellbeing Study: Findings
VerifiedAdded on 2020/04/13
|12
|1757
|293
Report
AI Summary
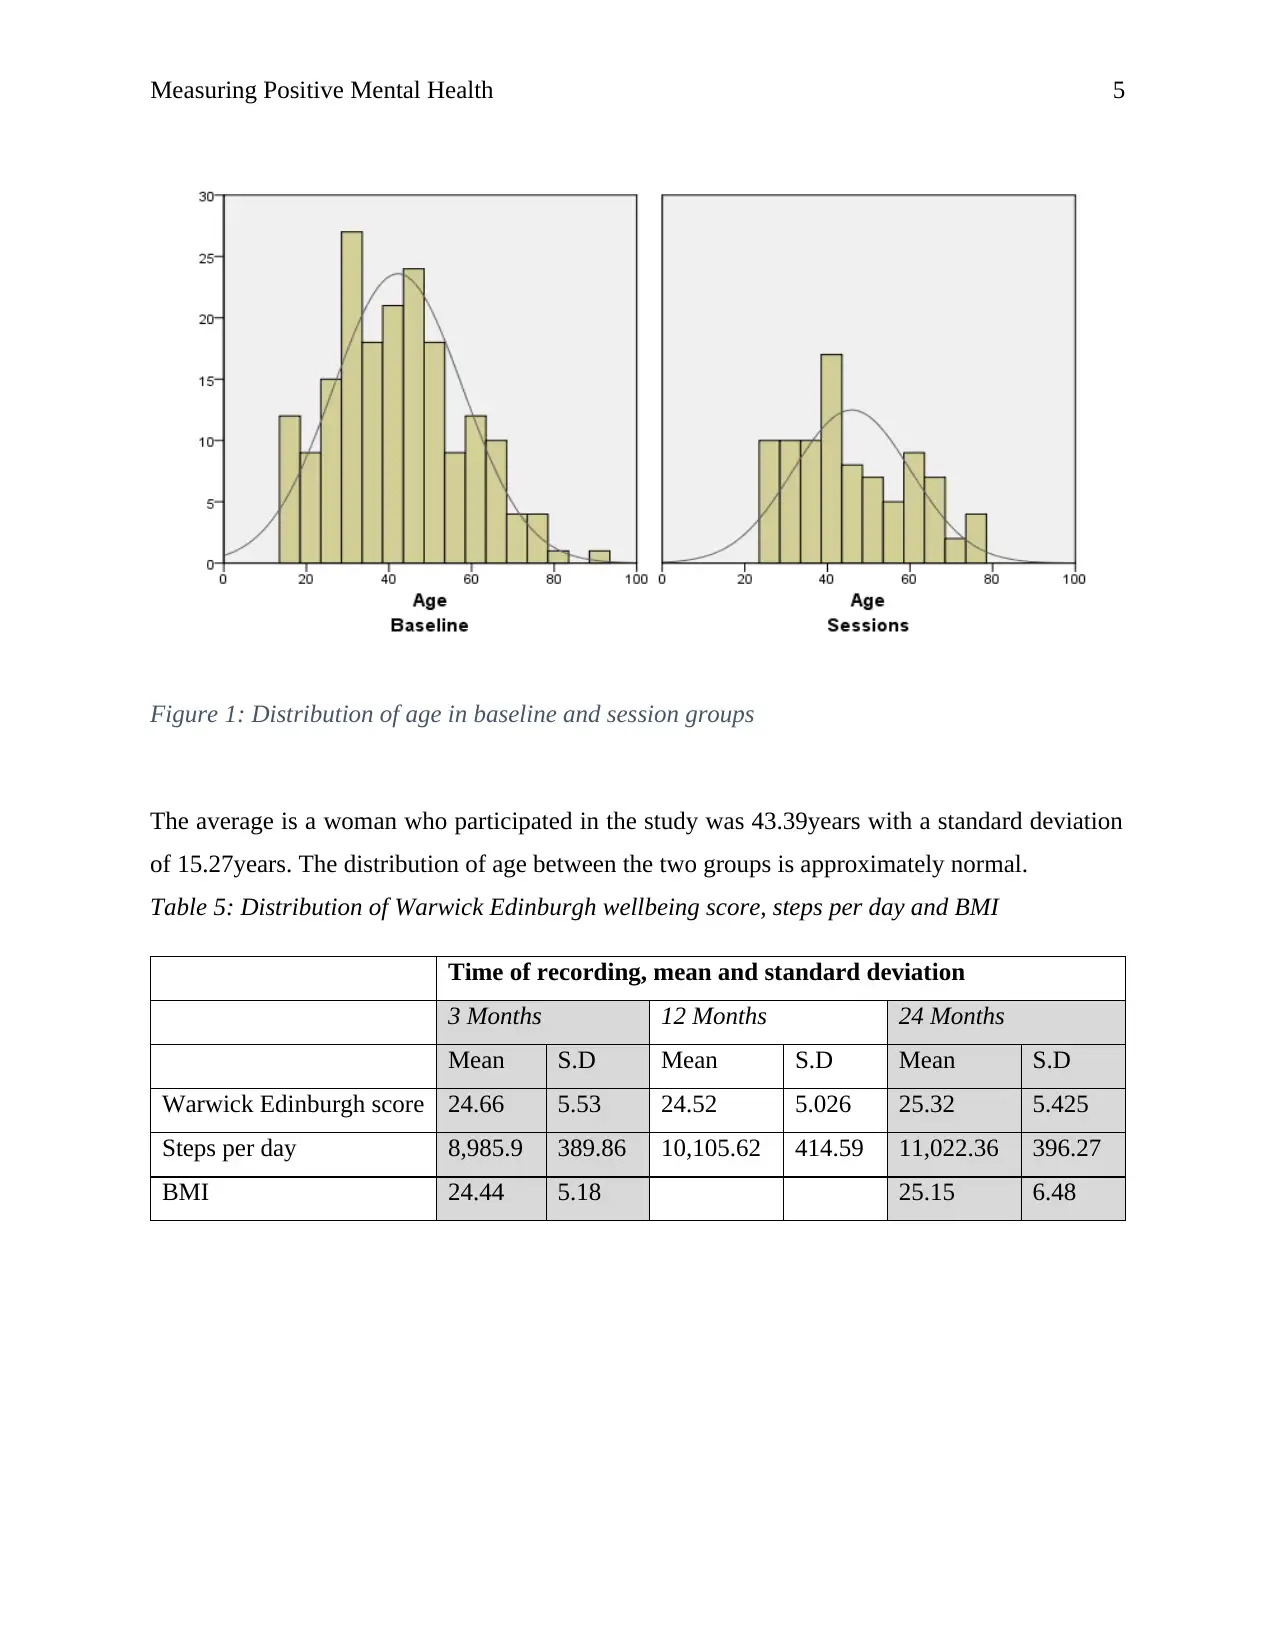
This report presents an analysis of a mental health study that investigated the impact of exercise sessions on the mental wellbeing of women. The study compared two groups: an intervention group receiving exercise sessions and a control group. Data was collected at three time points, measuring Warwick Edinburgh Mental Wellbeing Scale (WEMWBS) scores, steps per day, and BMI. The analysis included descriptive statistics, hypothesis testing to determine the effects of exercise on mental wellbeing, and assessment of the association between physical activity stages and the participant's group. The results indicated a significant positive correlation between exercise and mental wellbeing. Age was also examined as a potential confounder. The report provides detailed statistical findings and concludes that exercise sessions have a positive impact on mental wellbeing.
Contribute Materials
Your contribution can guide someone’s learning journey. Share your
documents today.

Measuring Positive Mental Health 1
Mental Health – Measuring Positive Mental Health
Name
Course Number
Date
Faculty Name
Mental Health – Measuring Positive Mental Health
Name
Course Number
Date
Faculty Name
Secure Best Marks with AI Grader
Need help grading? Try our AI Grader for instant feedback on your assignments.

Measuring Positive Mental Health 2
Mental Health – Measuring Positive Mental Health
Introduction
Mental health status can be measured based on predetermined scale(s), which focus on
the state of human mind during a specified period. Several factors determine the mental state of
an individual amongst which include physical exercises and age among other possible
confounders such as gender and ethnicity (NHS Health Scotland, 2017). Observations and tests
are required to determine the mental state of a person. It is believed that people who engage in
more physical activities are more likely to have better mental health compared to their fellows
(Pratt, 2013). In this study, two groups of women will be compared on basis of their mental
status. The groups include those studied at baseline and were not involved in any form of
physical activities and the others received free sessions, hence the intervention group.
Information recorded for purposes of research analysis based on the three periods for the two
groups (Elder, Evans and Nizette, 2009). The aim of the analysis is to see whether there is a
correlation between the amount of activity and their Mental Health wellbeing score. Their BMI
is monitored for change to see whether the activity has an effect on it. Participants are monitored
from pre-contemplation to maintenance level using a pedometer. Physical activity stage of
change (PASOC) is checked at 3, 12 and 24 months.
Research Questions
1. Does Offering exercise sessions to the physically restricted help encourage and maintain
a healthy mental wellbeing state?
The wellbeing of a person is affected by the physical state of the body. Therefore, increasing
the rate physical activities, the chance of mental state improvements is elevated (Choi, 2014).
2. Is there a significant association between physical activity stage of change at each time
point 1, 2 & 3 and offering exercise sessions?
Due to the expected changes in physical activity stage of change between the groups, we
presume that there will be a significant association between the participant's groups and the
physical activity stage (Choi, 2014).
3. Is age a confounder for the prediction of a participant’s group using the measurements of
the third recording as the predictors?

Measuring Positive Mental Health 3
The rate of physical exercises gradually reduces as women get to older ages. Therefore, age
is a possible confounder in the prediction of whether a participant in the control or intervention
group (Sedgwick, 2013).
Specific Hypothesis
1. Offering exercise sessions to the physically restricted help encourage and maintain a
healthy mental wellbeing state
Null hypothesis: Offering exercise sessions has no effect on encouraging or maintaining a
healthy mental Wellbeing state
2. The physical state of change at each time is proportionally related to offering exercise
sessions
Null hypothesis: There is no association between offering exercise and the physical state of
change.
3. Age is a potential confounder in the modelling of individuals benefiting from exercise
sessions
Null hypothesis: Age is not a confounder in the modelling of individuals benefiting from
exercise sessions
Descriptive Statistics
There were 89 (32.5%) participants in the intervention group and 185 (67.5%) in the control
group.
Table 1: Disability, its effects in activities and promotion of parents/guardians
Yes No N/A
Disability? 37 (13.5%) 237 (86.5%)
Disability Limit Activity? 28 (10.2%) 10 (3.6%) 236 (86.1%)
Parent/Guardian? 181 (66.1%) 93 (33.9%)
Table 2: Physical activity stage summary
Physical activity stage
Stage 1 Stage 2 Stage 3
Pre-contemplation 12 (4.4%) 10 (3.6%) 7 (2.6%)

Measuring Positive Mental Health 4
Contemplation 58 (21.2%) 50 (18.2%) 22 (8%)
Preparation 47 (17.2%) 45 16.4%) 77 (28.1%)
Decision/Action 19 (6.9%) 28 (10.2%) 37 (13.5%)
Maintenance 138 (50.4%) 141 (51.5%) 131 (47.8%)
Table 3: Employment status summary
Frequency
Employed 173 (63.1%)
Unemployed 28 (10.2%)
Self-employed 7 (2.6%)
Student 19 (6.6%)
Carer 5 (1.8%)
Retired 42 (15.3%)
63.1% of the women who participated in the study were employed, 10.2% unemployed, 2.6%
self-employed, 6.6% were students, 1.8% carers and 15.3% were retired.
Table 4: Age distribution of the participants
Mean Standard Deviation Minimum Maximum
Age 43.39 15.27 16 89
Secure Best Marks with AI Grader
Need help grading? Try our AI Grader for instant feedback on your assignments.

Measuring Positive Mental Health 5
Figure 1: Distribution of age in baseline and session groups
The average is a woman who participated in the study was 43.39years with a standard deviation
of 15.27years. The distribution of age between the two groups is approximately normal.
Table 5: Distribution of Warwick Edinburgh wellbeing score, steps per day and BMI
Time of recording, mean and standard deviation
3 Months 12 Months 24 Months
Mean S.D Mean S.D Mean S.D
Warwick Edinburgh score 24.66 5.53 24.52 5.026 25.32 5.425
Steps per day 8,985.9 389.86 10,105.62 414.59 11,022.36 396.27
BMI 24.44 5.18 25.15 6.48

Measuring Positive Mental Health 6
Figure 2: Boxplot for WEMWBS score at the 12 months
Figure 3: Boxplot for WEMWBS score at 12 months
Figure 2: Boxplot for WEMWBS score at the 12 months
Figure 3: Boxplot for WEMWBS score at 12 months

Measuring Positive Mental Health 7
Figure 4: Boxplot for WEMWBS score at 24 months
Based on the boxplots of WEMWBS score, the difference between the baseline and sessions
group increases gradually from the first recording at 3 months to the third recording at 24
months.
Figure 5: Steps/day recorded at 3 months
Figure 4: Boxplot for WEMWBS score at 24 months
Based on the boxplots of WEMWBS score, the difference between the baseline and sessions
group increases gradually from the first recording at 3 months to the third recording at 24
months.
Figure 5: Steps/day recorded at 3 months
Paraphrase This Document
Need a fresh take? Get an instant paraphrase of this document with our AI Paraphraser

Measuring Positive Mental Health 8
Figure 6: Steps/day recorded at 12 months
Figure 7: Steps/day recorded at 24 months
The distribution of steps per day is normally distributed in each group. The variation within the
group's changes between the recording stages. In this cases, data recorded at 3 months has less
variation compared to the records of the 24th month.

Measuring Positive Mental Health 9
Figure 8: Distribution of BMI recorded at 3 months
Figure 9: Distribution of BMI recorded at 24 months
Comparing the two stages at 3 and 24 months, the averages of BMI decreased significantly for
both the baseline and sessions groups.
Figure 8: Distribution of BMI recorded at 3 months
Figure 9: Distribution of BMI recorded at 24 months
Comparing the two stages at 3 and 24 months, the averages of BMI decreased significantly for
both the baseline and sessions groups.

Measuring Positive Mental Health 10
Hypothesis testing
Testing significance of offering exercise sessions on mental health wellbeing state
Null hypothesis: offering exercise sessions has no effect on encouraging or maintaining healthy
mental well-being state.
Table 6: Test of hypothesis
WEMWBS score recording
stage
Test of
homogeneity P-
value
P-value Mean
Difference
Confidence
interval
3 months 0.033 0.525 -0.425 -1.741 .891
12 months 0.035 0.002 -1.828 -2.991 -0.666
24 months 0.534 <0.001 -4.971 -6.218 -3.725
Based on the hypothesis test results in the table above, we conclude that offering exercise
sessions have an effect on encouraging or maintaining health mental well-being state (Boylan,
Louie and Gill, 2012). This is because the test at 3 months was not significant but the subsequent
tests after the intervention group was exposed on free exercise sessions, the hypothesis test
turned out to be very significant.
Test of association between physical activity stage and the participants’ group
Null hypothesis: There is no significant association between physical activity stage and offering
exercise sessions
Table 7: Test of association between physical activity stage of change and offering exercise
sessions
Physical Activity stage of change Pearson Chi-Square P-value
Stage 1 1.847 0.764
Stage 2 9.123 0.058
Stage 3 26.965 <0.001
Secure Best Marks with AI Grader
Need help grading? Try our AI Grader for instant feedback on your assignments.

Measuring Positive Mental Health 11
The first and second stages emerged to be insignificant. However, the last recording stage
results showed a big change with a p-value <0.001. We conclude that there was a significant
association of physical activity stage of change in recording 3 for each group. Based on the
information recorded in the 24th month, we can see that there is a marked difference in each
group (Giangregorio and Cook, 2009).
Age is a significant confounder in the prediction of whether a participant is in the
intervention or control groups.
Table 8: Model 1
B S.E. Wald df Sig. Exp(B)
WEdin_3 .224 .035 41.604 1 .000 1.251
Constant -6.626 .947 48.901 1 .000 .001
probability of being∈intervention group= 1
1+ e−6.626+0.224 Wedin3
Table 9: Model 1
B S.E. Wald Df Sig. Exp(B)
WEdin_3 .224 .035 40.781 1 .000 1.252
Age .015 .010 2.574 1 .109 1.016
Constant -7.299 1.063 47.145 1 .000 .001
Age covariate is not significant in the equation, hence concluding that it is not a
significant confounder in the prediction of a participant being in the intervention group (Menard,
2008).

Measuring Positive Mental Health 12
References
Boylan, S., Louie, J. and Gill, T. (2012). Consumer response to healthy eating, physical activity
and weight-related recommendations: a systematic review. Obesity Reviews, 13(7), pp.606-617.
Choi, B. (2014). The Relationship Between Mental Health and Physical Health. Hanyang
Medical Reviews, 34(2), p.51.
Elder, R., Evans, K. and Nizette, D. (2009). Psychiatric and mental health nursing. Edinburgh:
Mosby.
Giangregorio, L. and Cook, R. (2009). Hypothesis testing in clinical and basic science research.
Transfusion, 50(9), pp.1878-1880.
Menard, S. (2008). Applied logistic regression analysis. Thousand Oaks, Calif. [u.a.]: Sage.
NHS Health Scotland (2017). Mental health and wellbeing. [Online] Healthscotland.scot.
Available at: http://www.healthscotland.scot/health-topics/mental-health-and-wellbeing
[Accessed 14 Nov. 2017].
Pratt, L. (2013). Measuring mental health status for international comparisons: Washington
Group on Disability Statistics. Comprehensive Psychiatry, 54(8), pp.e33-e34.
Sedgwick, P. (2013). Analyzing case-control studies: adjusting for confounding. BMJ, 346(jan04
1), pp.f25-f25.
1 out of 12
Related Documents

Your All-in-One AI-Powered Toolkit for Academic Success.
+13062052269
info@desklib.com
Available 24*7 on WhatsApp / Email
Unlock your academic potential
© 2024 | Zucol Services PVT LTD | All rights reserved.