Menu Planning and Design: Budget Analysis and Development Report

Verified

Added on  2022/12/27

|14
|887
|46
Report
AI Summary
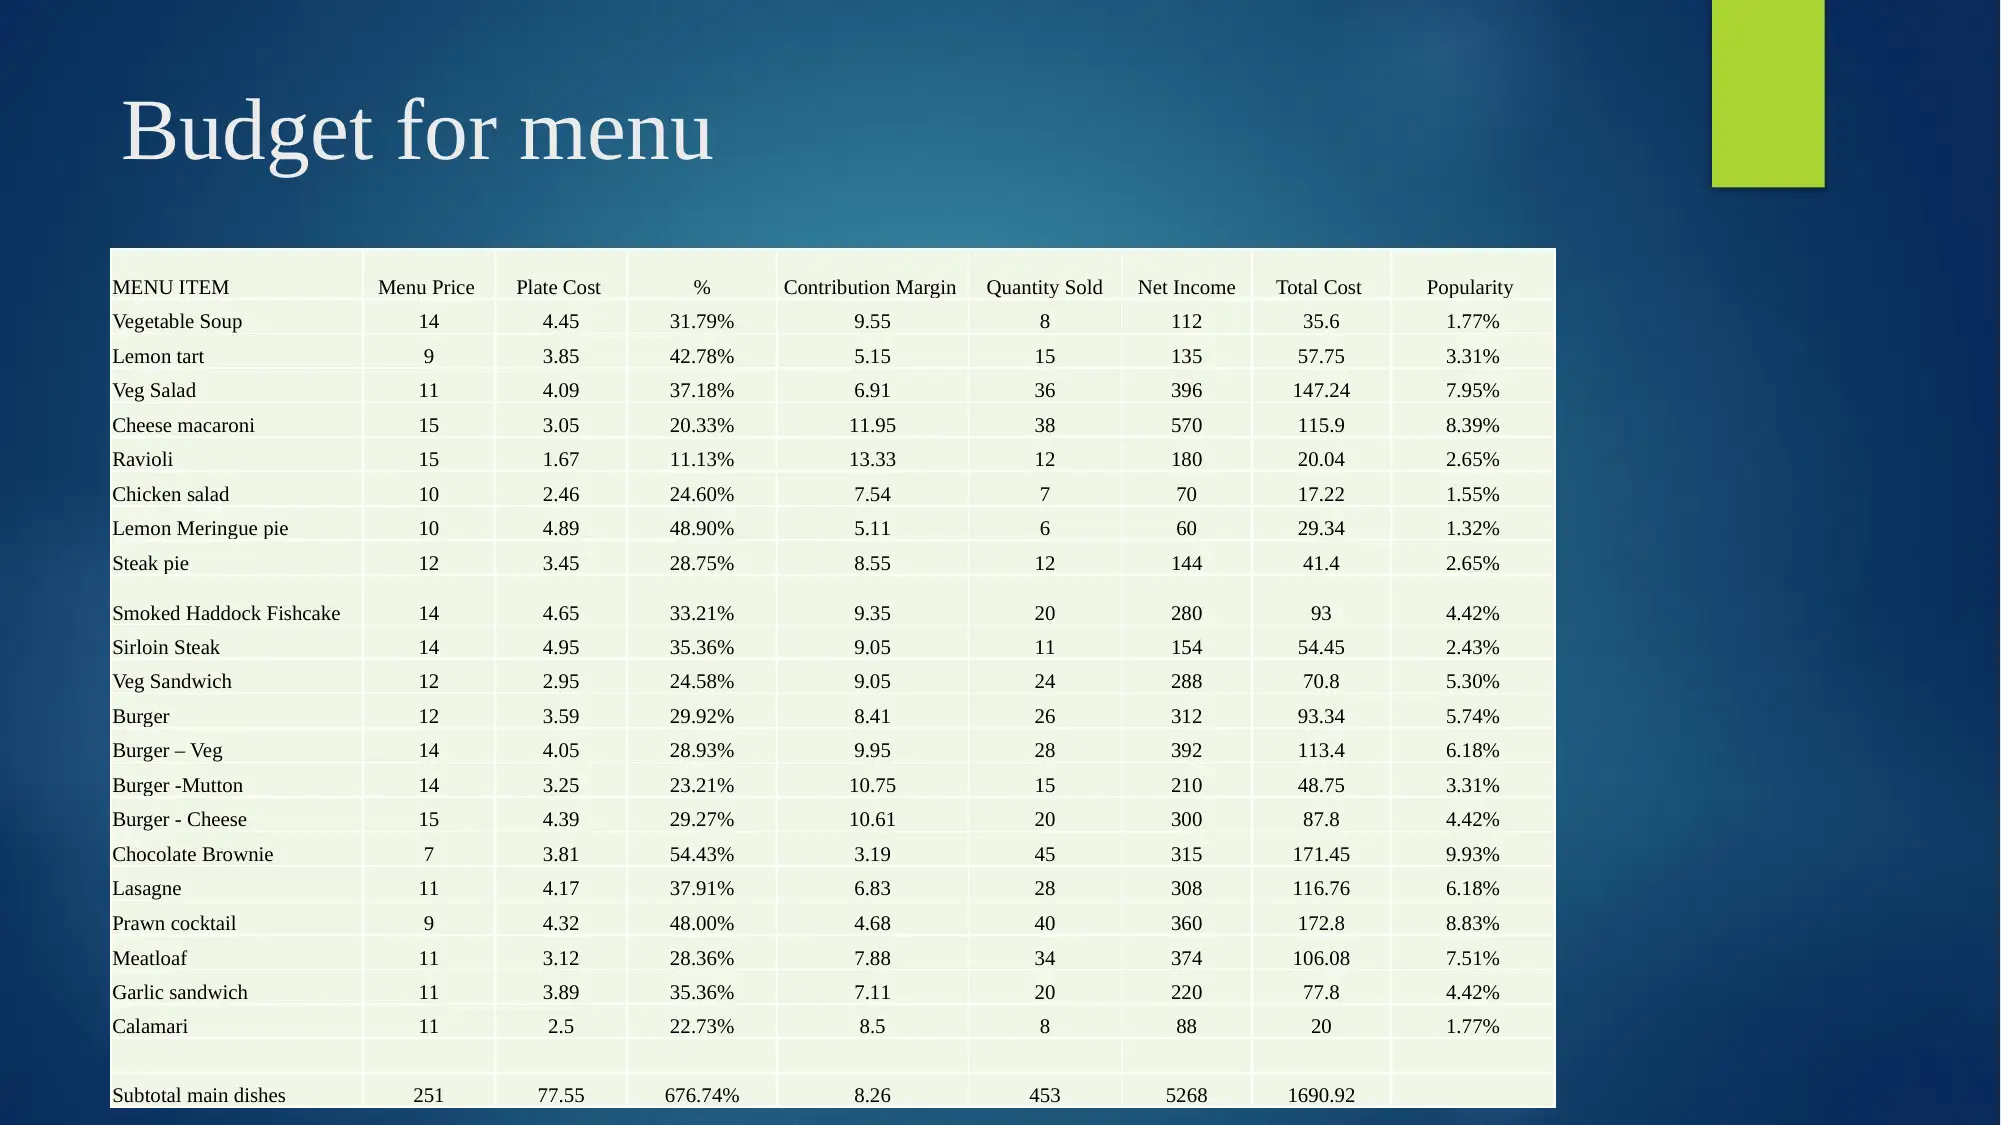
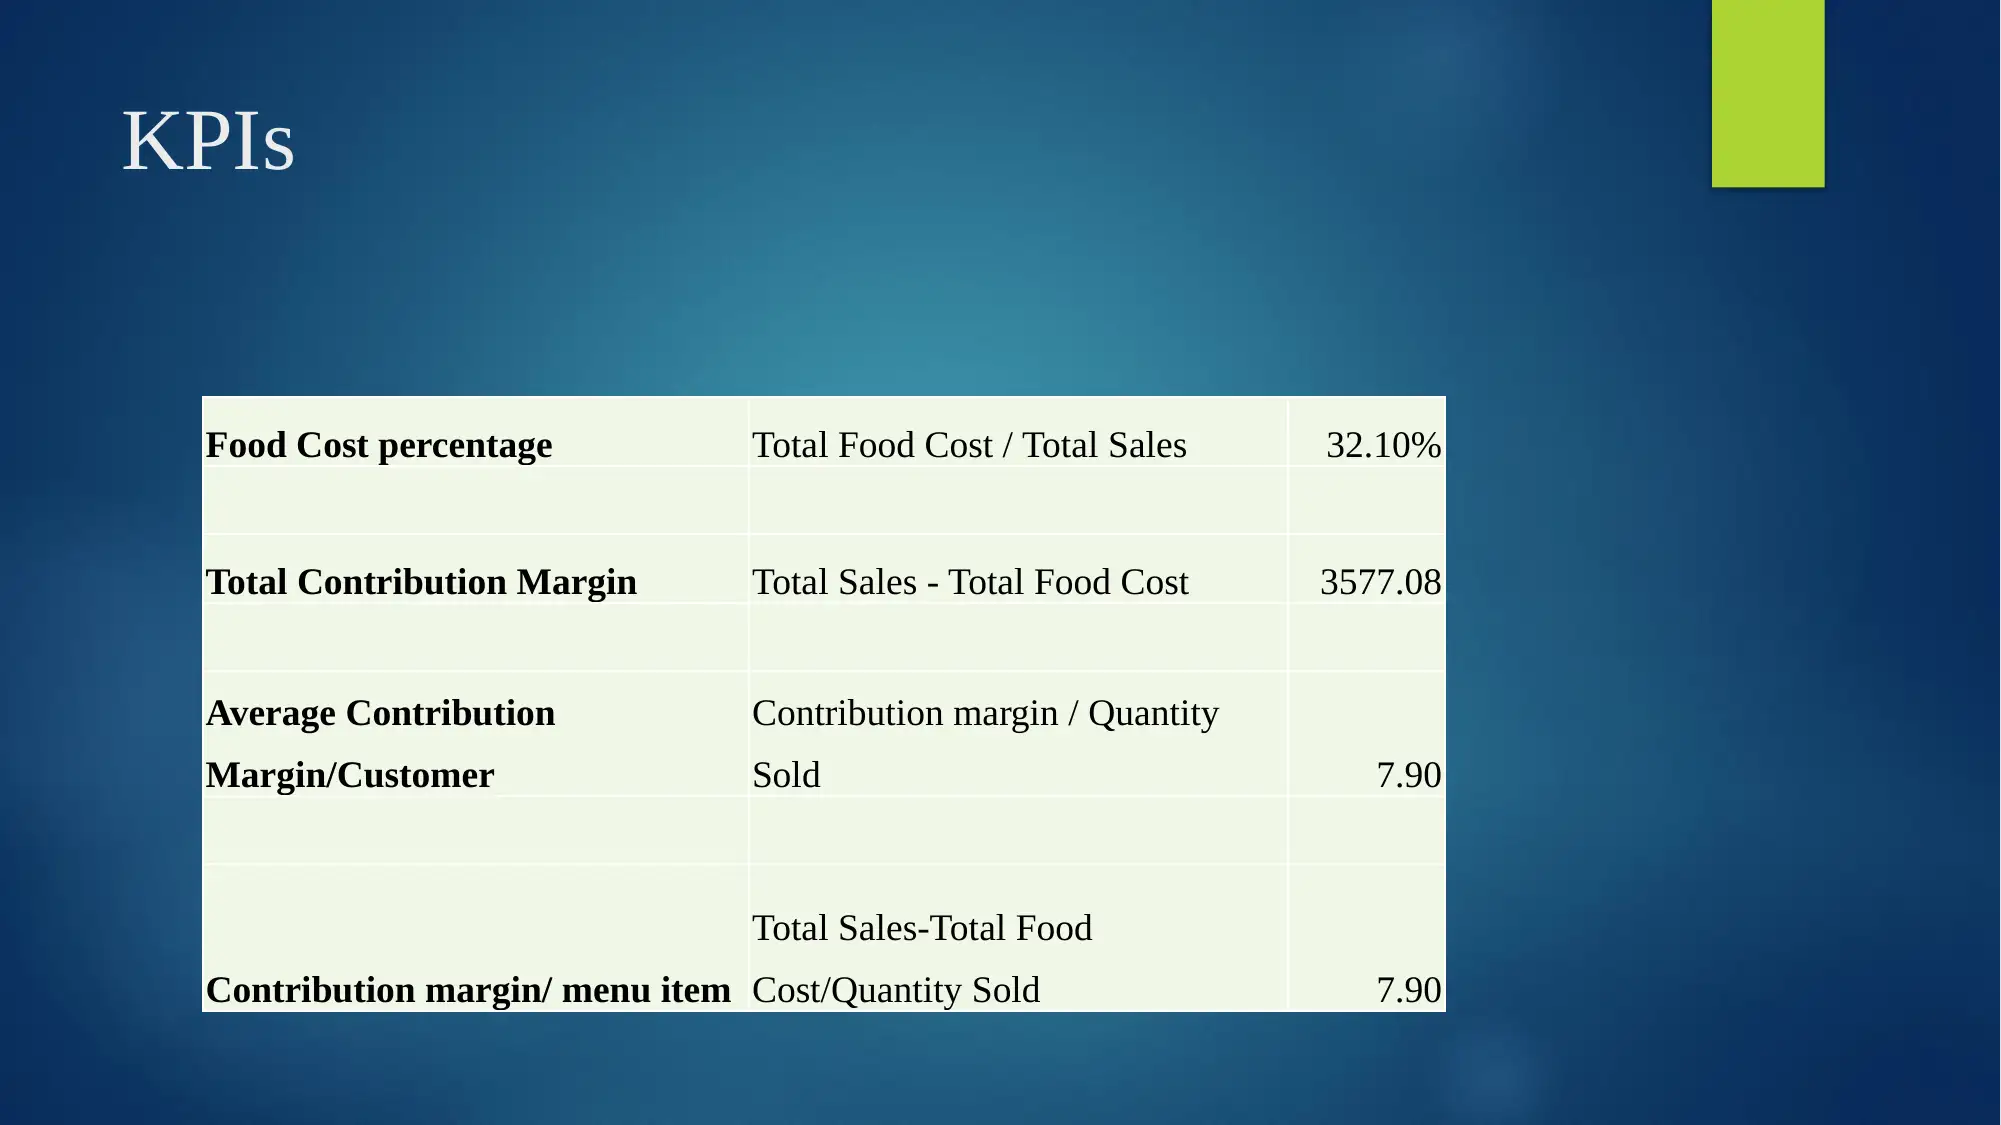
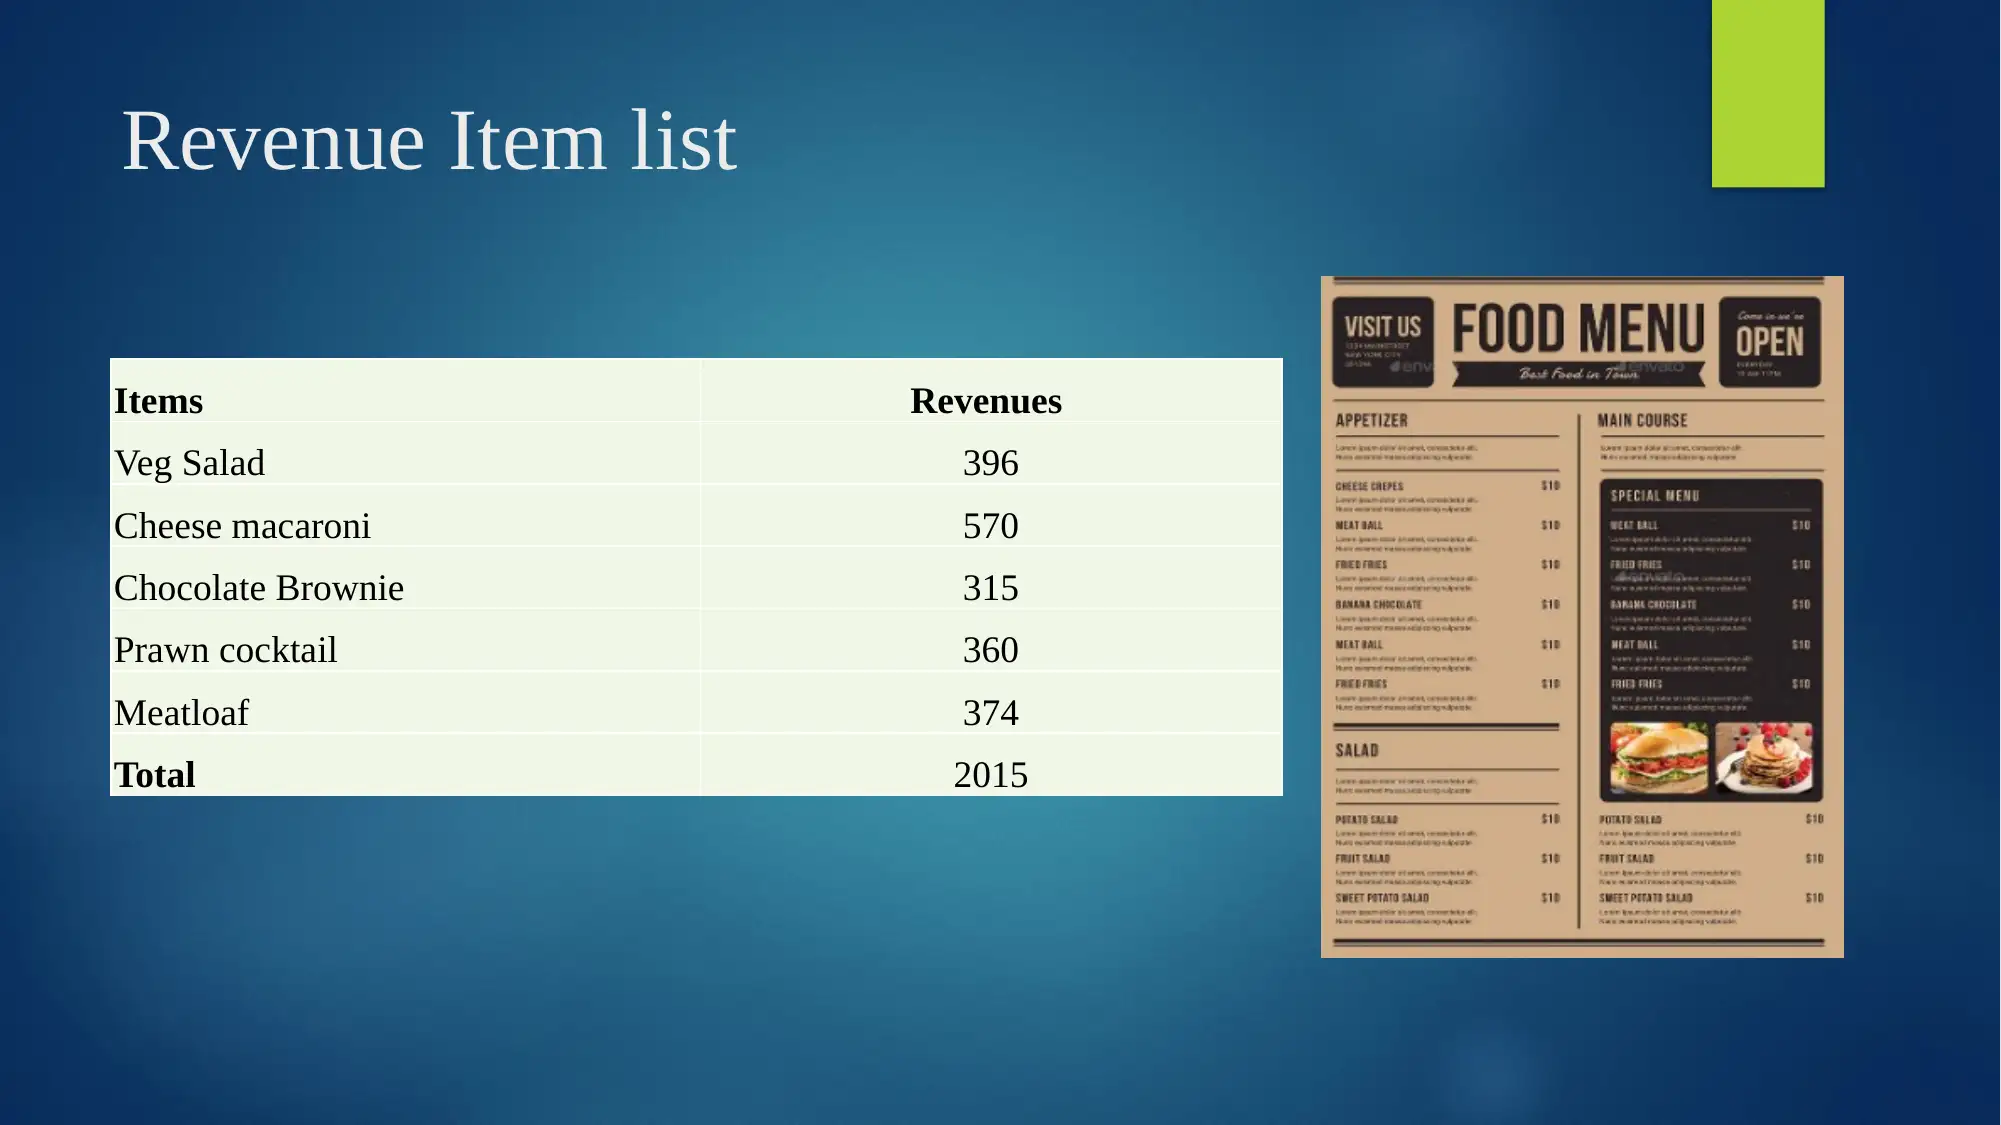
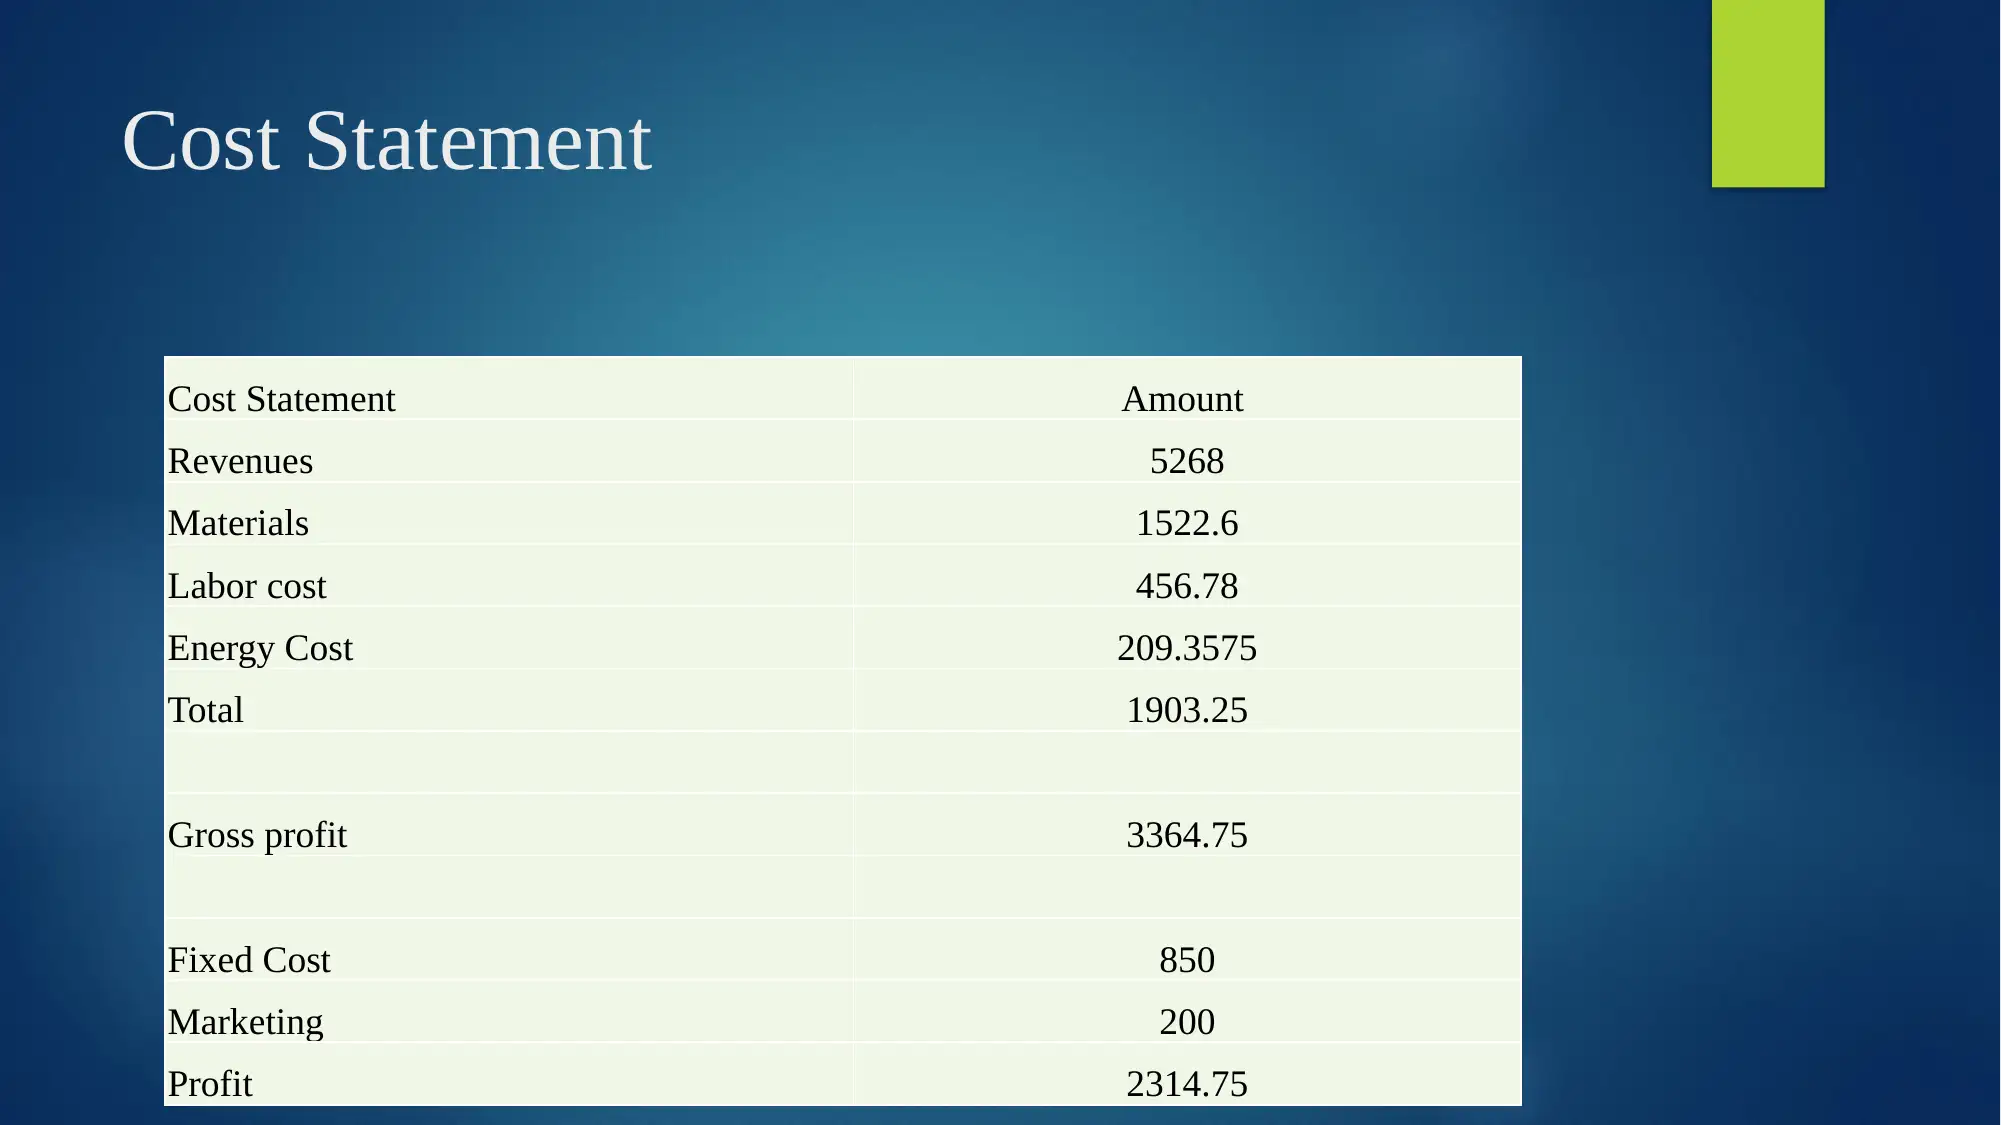
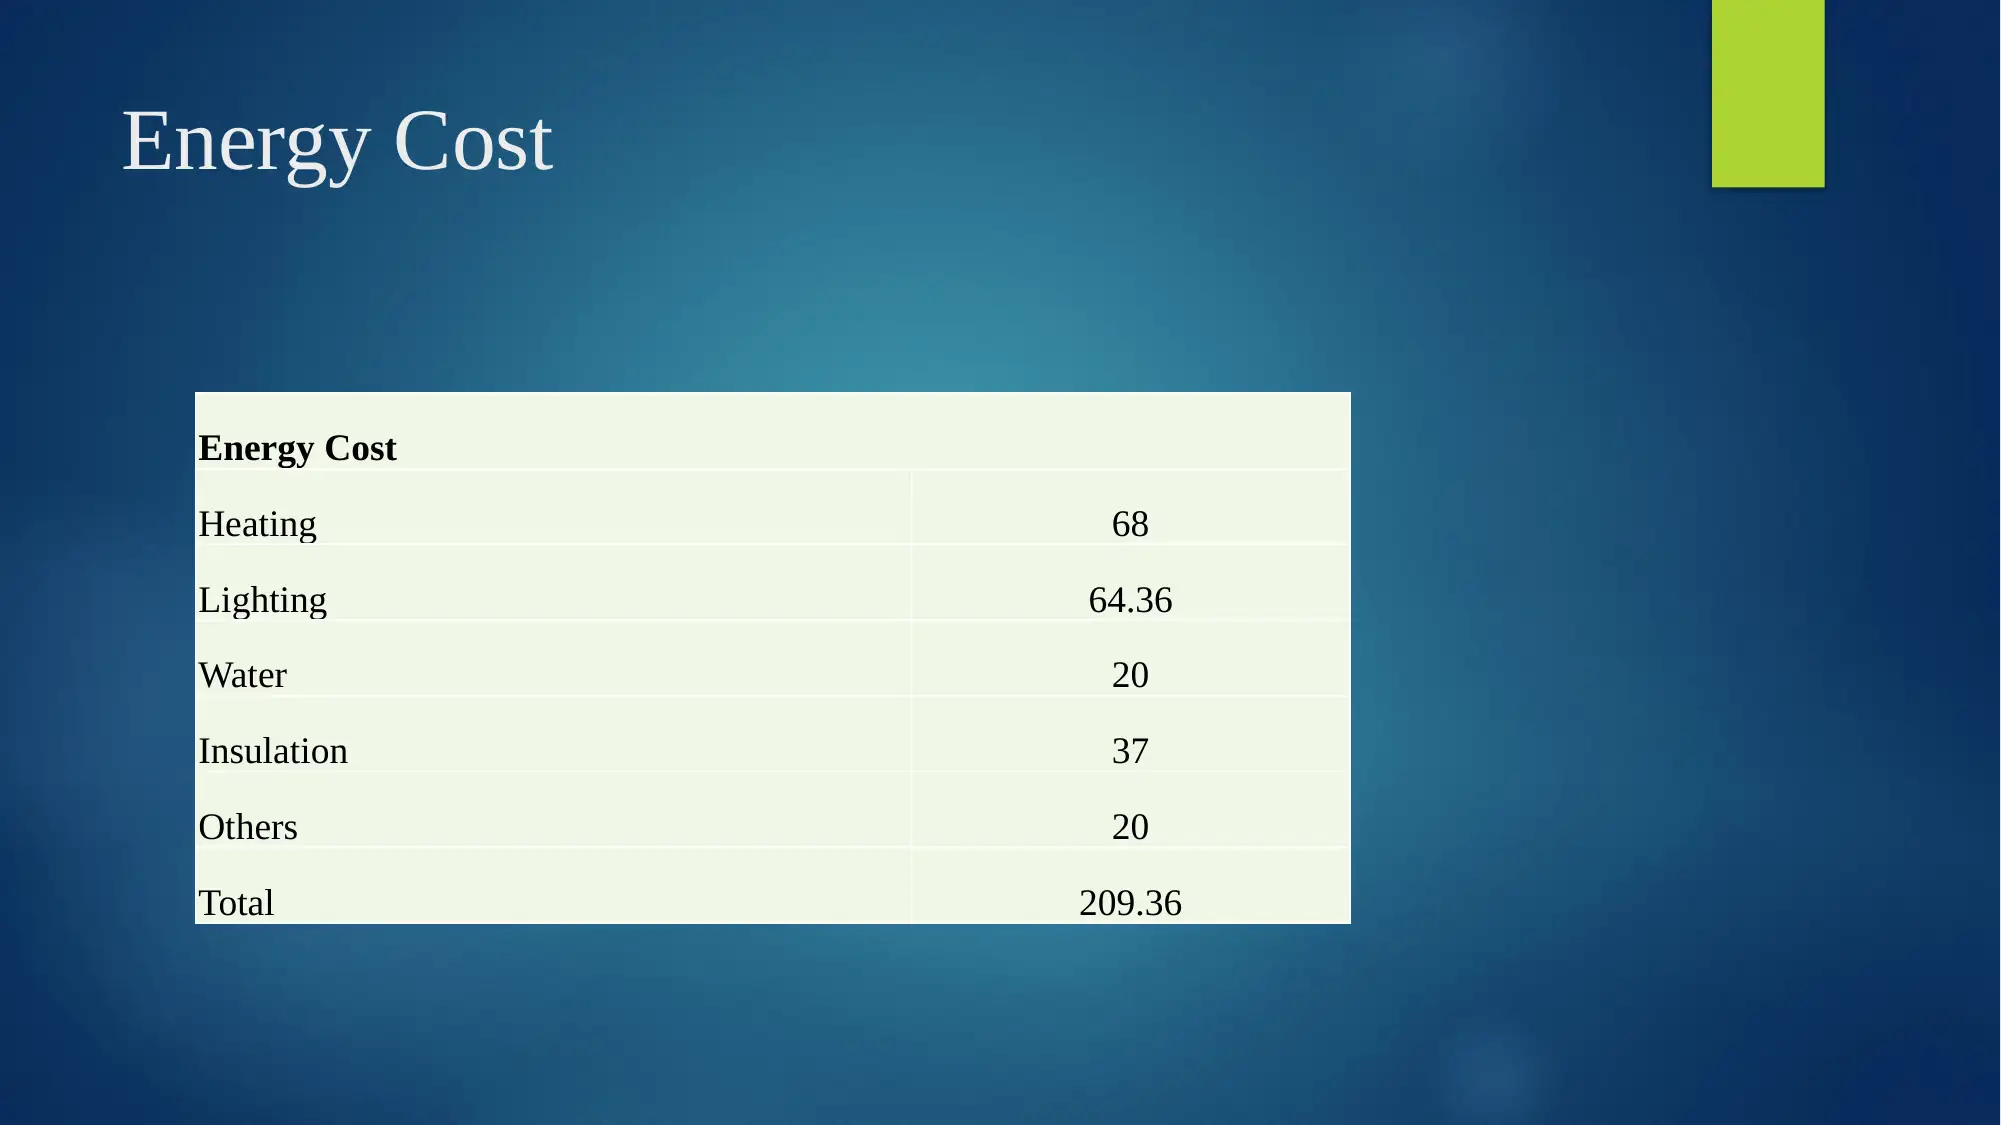
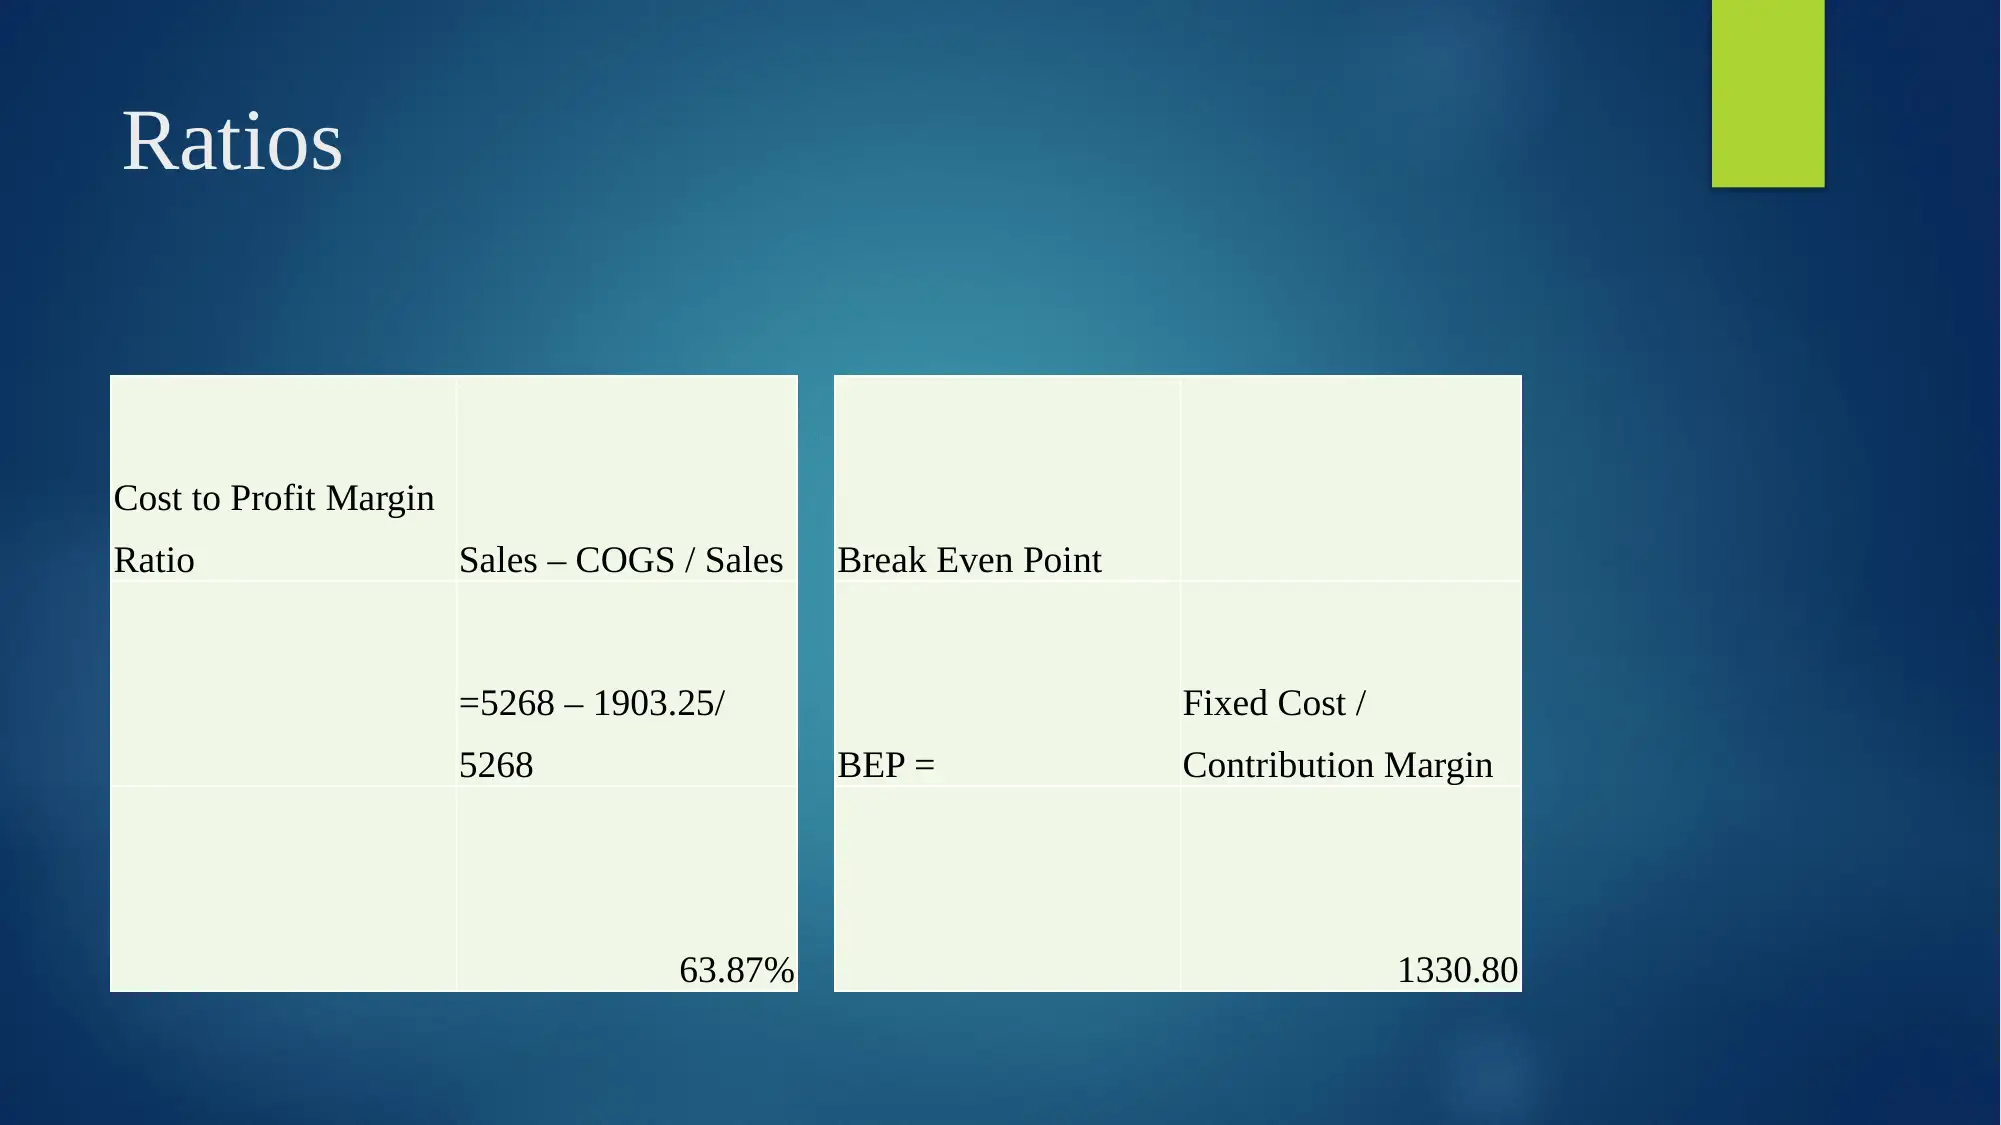
This report presents a comprehensive analysis of menu development, planning, and budget design for a restaurant. It includes a detailed menu with itemized prices, costs, and sales data, allowing for the calculation of key performance indicators (KPIs) such as food cost percentage, contribution margin, and popularity. The report provides a cost statement with revenue, material costs, labor costs, and energy costs, leading to the calculation of gross profit and fixed costs. Furthermore, it delves into the costing and pricing strategies, considering factors like competition, resource availability, seasonal ingredients, and inventory valuation. The conclusion emphasizes the importance of aligning menu planning with budget constraints and calculating the break-even point. References to academic literature on menu selection and sustainability are also provided.
tabler-icon-diamond-filled.svg

Contribute Materials

Your contribution can guide someone’s learning journey. Share your documents today.
Document Page
Menu Development , Planning and
Design
tabler-icon-diamond-filled.svg

Secure Best Marks with AI Grader

Need help grading? Try our AI Grader for instant feedback on your assignments.
Document Page
Budget for menu
MENU ITEM Menu Price Plate Cost % Contribution Margin Quantity Sold Net Income Total Cost Popularity
Vegetable Soup 14 4.45 31.79% 9.55 8 112 35.6 1.77%
Lemon tart 9 3.85 42.78% 5.15 15 135 57.75 3.31%
Veg Salad 11 4.09 37.18% 6.91 36 396 147.24 7.95%
Cheese macaroni 15 3.05 20.33% 11.95 38 570 115.9 8.39%
Ravioli 15 1.67 11.13% 13.33 12 180 20.04 2.65%
Chicken salad 10 2.46 24.60% 7.54 7 70 17.22 1.55%
Lemon Meringue pie 10 4.89 48.90% 5.11 6 60 29.34 1.32%
Steak pie 12 3.45 28.75% 8.55 12 144 41.4 2.65%
Smoked Haddock Fishcake 14 4.65 33.21% 9.35 20 280 93 4.42%
Sirloin Steak 14 4.95 35.36% 9.05 11 154 54.45 2.43%
Veg Sandwich 12 2.95 24.58% 9.05 24 288 70.8 5.30%
Burger 12 3.59 29.92% 8.41 26 312 93.34 5.74%
Burger – Veg 14 4.05 28.93% 9.95 28 392 113.4 6.18%
Burger -Mutton 14 3.25 23.21% 10.75 15 210 48.75 3.31%
Burger - Cheese 15 4.39 29.27% 10.61 20 300 87.8 4.42%
Chocolate Brownie 7 3.81 54.43% 3.19 45 315 171.45 9.93%
Lasagne 11 4.17 37.91% 6.83 28 308 116.76 6.18%
Prawn cocktail 9 4.32 48.00% 4.68 40 360 172.8 8.83%
Meatloaf 11 3.12 28.36% 7.88 34 374 106.08 7.51%
Garlic sandwich 11 3.89 35.36% 7.11 20 220 77.8 4.42%
Calamari 11 2.5 22.73% 8.5 8 88 20 1.77%
Subtotal main dishes 251 77.55 676.74% 8.26 453 5268 1690.92
Document Page
KPIs
Food Cost percentage Total Food Cost / Total Sales 32.10%
Total Contribution Margin Total Sales - Total Food Cost 3577.08
Average Contribution
Margin/Customer
Contribution margin / Quantity
Sold 7.90
Contribution margin/ menu item
Total Sales-Total Food
Cost/Quantity Sold 7.90
Document Page
Revenue Item list
Items Revenues
Veg Salad 396
Cheese macaroni 570
Chocolate Brownie 315
Prawn cocktail 360
Meatloaf 374
Total 2015
tabler-icon-diamond-filled.svg

Secure Best Marks with AI Grader

Need help grading? Try our AI Grader for instant feedback on your assignments.
Document Page
Cost Statement
Cost Statement Amount
Revenues 5268
Materials 1522.6
Labor cost 456.78
Energy Cost 209.3575
Total 1903.25
Gross profit 3364.75
Fixed Cost 850
Marketing 200
Profit 2314.75
Document Page
Labor Cost
Labor Cost
Chefs 283.2
Waiters 182.71
Workers 54.81
Total 456.78
Document Page
Energy Cost
Energy Cost
Heating 68
Lighting 64.36
Water 20
Insulation 37
Others 20
Total 209.36
tabler-icon-diamond-filled.svg

Paraphrase This Document

Need a fresh take? Get an instant paraphrase of this document with our AI Paraphraser
Document Page
Ratios
Cost to Profit Margin
Ratio Sales – COGS / Sales
=5268 – 1903.25/
5268
63.87%
Break Even Point
BEP =
Fixed Cost /
Contribution Margin
1330.80
Document Page
Key points taken in account when costing and
pricing the menus
The key points taken in account while costing and pricing the menus are:
a) Competition present: The prices set by the competitors in local region are
taken in consideration for pricing the dishes.
The pricing can be either a bit lower or similar to the prices set.
b) Resources available: The restaurant having access to food materials from
suppliers and the rates at which they are operating influences the price structure
ultimately.
If raw materials can be procured at a lower cost structure then price can be set
lower.
Document Page
Continued
c) Seasonal ingredients: Talking of veggies, which E Pellicci has a segment
of customers and various choices offered in it is influenced by seasons.
Vegetables quality increase and diminish with season.
d) Specific times of costing and reviewing: The product when launched as a
new entry in the food market is bound to attract attention and will have higher
demand.
tabler-icon-diamond-filled.svg

Secure Best Marks with AI Grader

Need help grading? Try our AI Grader for instant feedback on your assignments.
Document Page
Continued
e) Inventory valuation: The inventory kept as per optimal use is to be valued and
when total food expense regarding all ingredients are calculated and added, it is to
be subtracted from them.
As it gets subtracted ,it makes easier for company to price the product category.
Document Page
CONCLUSION
It can be concluded that planning of menu and budget pricing go in hand together.
The budget provides a forum of highlighting the food costs, contribution margin
and contribution margin per menu item.
The menu planned is within budget constraints and company can calculate its
break-even point to see the point from which it can realize profits.
Document Page
REFERENCES
Peters, K. and Remaud, P.H., 2020. Factors influencing consumer menu-item
selection in a restaurant context. Food Quality and Preference. 82. p.103887.
Dhir, A. and et.al.,2020. Food waste in hospitality and food services: A systematic
literature review and framework development approach. Journal of Cleaner
Production. 270. p.122861.
Teng, Y.M. and Wu, K.S., 2019. Sustainability development in hospitality: The
effect of perceived value on customers’ green restaurant behavioral
intention. Sustainability. 11(7). p.1987.
Kim, Y.H., Sauerwald, P. and Sukpatch, K., 2021. Are you looking for special
menu? An examination of variety seeking behavior for special menu (VaSM)
model. International Journal of Gastronomy and Food Science. 23. p.100295.
tabler-icon-diamond-filled.svg

Paraphrase This Document

Need a fresh take? Get an instant paraphrase of this document with our AI Paraphraser
Document Page
chevron_up_icon
1 out of 14
circle_padding
hide_on_mobile
zoom_out_icon
logo.png

Your All-in-One AI-Powered Toolkit for Academic Success.

Available 24*7 on WhatsApp / Email

[object Object]