Model-Driven Engineering of MES for Food and Beverage Industry
VerifiedAdded on 2022/03/22
|21
|11672
|16
Report
AI Summary
This research paper, authored by Xinyu Chen, Christoph Nophut, and Tobias Voigt, introduces a model-driven engineering (MDE) approach for Manufacturing Execution Systems (MES) specifically tailored for the food and beverage industry. The study addresses the challenges of MES implementation in this sector, such as complex integration and customization, by proposing a MDE-based solution to automate MES generation. The approach encompasses the entire engineering process, from specification to MES generation and validation. The authors validate the feasibility and practicality of their method through a case study involving a brewing process, demonstrating its potential to enhance manufacturing efficiency and transparency. The paper also reviews existing literature on MES, MDE, and their application within the food and beverage industry, highlighting the need for a concrete model-driven approach. The research emphasizes the benefits of MDE in simplifying MES implementation, promoting reusability, and reducing complexity in the context of Industry 4.0 principles. This research provides valuable insights into how the food and beverage industry can leverage MDE to improve their production processes.
electronics
Article
Manufacturing Execution Systems for the Food and
Beverage Industry:A Model-Driven Approach
Xinyu Chen *, Christoph Nophut and Tobias Voigt
Chair of Food Packaging Technology, TUM School of Life Sciences, Technical University of Munich,
85354 Freising, Germany; christoph.nophut@tum.de (C.N.); tobias.voigt@tum.de (T.V.)
* Correspondence:xinyu.chen@tum.de
Received:8 November 2020; Accepted:28 November 2020; Published:2 December 2020
Abstract:Manufacturing Execution Systems (MES) are process-oriented information-technology
(IT) solutions for collecting and managing information from manufacturing processes.Due to the
individual programming effort and the complex integration with other manufacturing systems,
though the food and beverage manufacturers can benefit from the MES, its implementation is not
widespread in this industry.To simplify the implementation and engineering process, the concept
of model-driven engineering (MDE) is considered as a solution.However, a feasible model-driven
approach for MES engineering has not been established, not to mention for the food and beverage
industry.This paper presents an approach for the automatic MES generation according to the MDE
concept providing MES functions that are relevant to the food and beverage manufacturing processes
primarily.It consists of necessary phases to cover the whole engineering process of the MES. Based on
the application of the presented approach to the brewing process in a brewhouse, the feasibility and
practicality of this approach were proven.
Keywords:manufacturing execution systems; model-driven engineering; food and beverage industry
1.Introduction
Information-technology (IT) systems have been used to improve production processes and
are indispensable for manufacturing firms seeking to remain competitive in the global market [1].
To utilize the potential for improvement, manufacturing processes on the shop floor should not be
ignored.With the increasing flexibility of processes and the diversification of products, the traditional
operational IT systems (e.g., Enterprise Resource Planning (ERP)), are not able to react in real-time
to meet the requirements of improvements on the shop floor.Manufacturing Execution Systems
(MES) are process-oriented software systems that manage and analyze real-time information in the
manufacturing processes.On one hand,MES implement production plans from systems on the
enterprise-level in operative details to the production area.On the other hand, they provide essential
key performance indicators, including specific energy consumption and machine e fficiency metrics,
to the enterprise for making business decisions and for the improvement of the manufacturing
performance.The implementation of MES raises the transparency of manufacturing processes so
that product quality and workflow efficiency can be optimized.Although the sectors in the food and
beverage industry can benefit from MES, the special characteristics of the manufacturing processes
and the lack of human, material, and financial resources have hindered their investment into MES
implementation,in which considered efforts for programming,customizing,and integrating are
indispensable to deal with the high complexity of MES, owing to the wide range of functions required
to control the shop floor processes and the communications with intra- and extra-systems [ 2,3].
Using code-centric technologies to develop such a complex system requires a herculean effort [4].
An essential factor behind the development is the wide conceptual gap between the implementation
Electronics 2020, 9, 2040; doi:10.3390/electronics9122040 www.mdpi.com/journal/electronics
Paraphrase This Document
Need a fresh take? Get an instant paraphrase of this document with our AI Paraphraser
Electronics 2020, 9, 2040 2 of 21
domains.The concept of model-driven engineering (MDE) is concerned primarily with reducing this
gap through the use of abstractions to software implementations [5,6]. For the software development
using MDE concept, the primary artifacts of development are models, the transformation from models
into running systems is relied on computer-based technologies.By raising the level of abstraction
and automating labor-intensive and error-prone tasks, MDE has been seen as a solution to handle the
complexity of software development [7]. However, though many researchers have focused on the
industrial application of the MDE, such as for embedded software [8], mobile applications [9], and the
automated production systems [10], a concrete approach that covers the whole lifecycle of the MES
engineering has not been established yet.
This paper presents the first model-driven approach for the automatic generation of the MES and
emphasizes specification as well as MES generation with validation to fulfill the requirements from the
food and beverage industry.The feasibility of this approach is proven by its application to a brewing
process for thermal energy management.The paper is structured as follows.Section 2 introduces the
definition and functionality of the MES and gives a literature review to analyze the requirements and
barriers from the food and beverage industry for MES implementation.Previous works related to MDE
have also been presented in this section.Section 3 presents the requirements that should be fulfilled
by a model-driven approach for MES engineering based on the literature review.Section 4 describes
the developed model-driven approach in detail.Section 5 provides a use case on the application of
this approach to a brewhouse and evaluates it according to the requirements presented in Section 3
Section 6 draws conclusions and outlines future work.
2.State of the Art
2.1.Definition and Functionality of the MES
For the manufacturing industry, to fulfill the requirement from the shop floor on the data collection
and operation reaction in real-time, the idea of MES was firstly introduced by AMR Research in 1992,
and also in this year, MESA (Manufacturing Enterprise Solutions Association) was established [11,12].
According to MESA, the core task of the MES is considered as an information center that enables
the manufacturers to optimize production activities [13]. For different manufacturing environments,
twelve MES functionalities were defined [14]: resource allocation and control, dispatching production,
data collection and acquisition,quality management,process management,production tracking,
performance analysis,operations and detailed scheduling,document control,labor management,
maintenance management, and transport, storage, and tracking of materials.
According to hierarchy model defined in ISA-95 [15], the MES are located on level 3 and act as
the bridge between the automation layer and the enterprise layer [16]. Due to the development of
automation and information technology, the idea of Industry 4.0 was officially announced in 2013
as a German strategic initiative to keeping a pioneering role in the revolutionizing industries [17].
Three dimensions are contained in the paradigm of Industry 4.0:horizontal integration across the
entire value creation network, vertical integration, and networked manufacturing systems; end-to-end
engineering across the entire life cycle [18,19]. A three-dimensional model named RAMI 4.0 is proposed
as the reference architecture model bringing the essential elements together with di fferent standards in
order to implement Industry 4.0 techniques (Figure 1) [20].
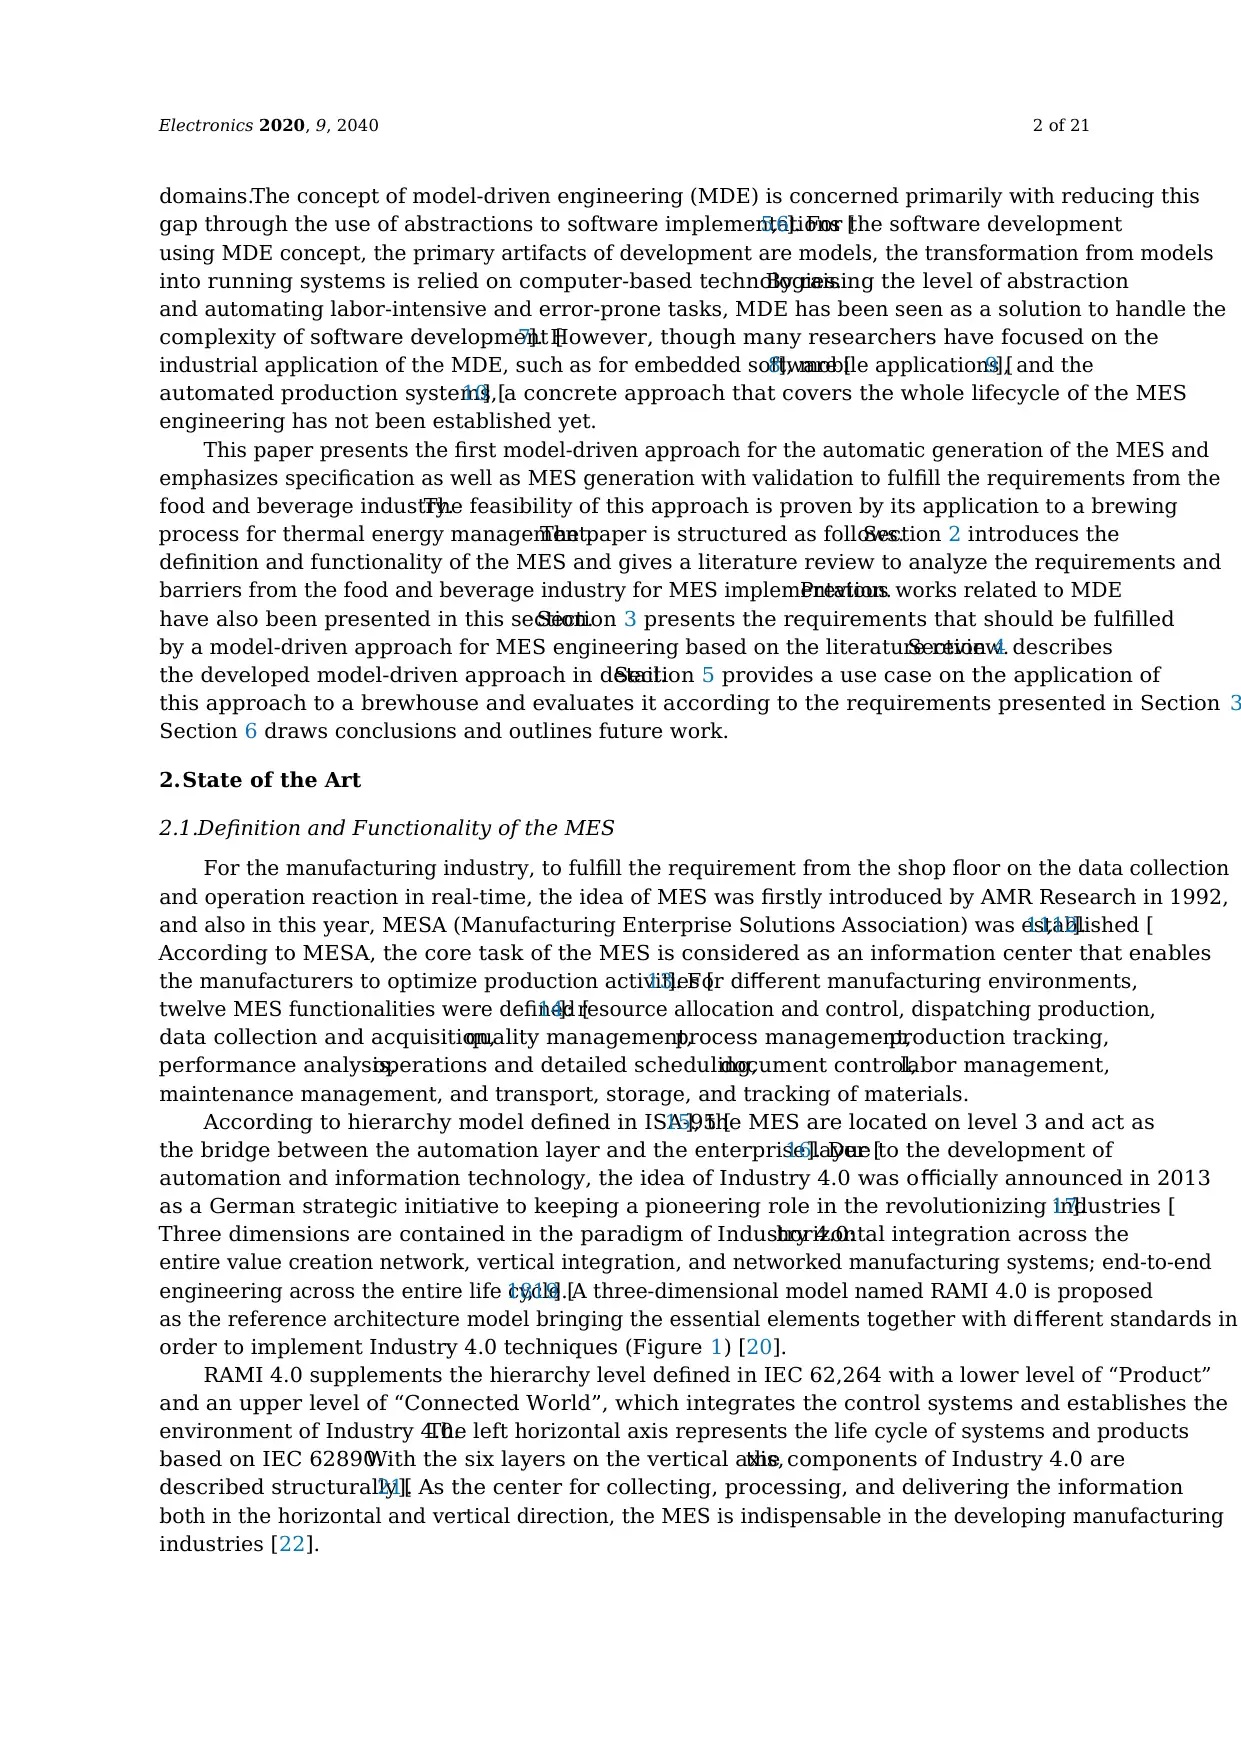
RAMI 4.0 supplements the hierarchy level defined in IEC 62,264 with a lower level of “Product”
and an upper level of “Connected World”, which integrates the control systems and establishes the
environment of Industry 4.0.The left horizontal axis represents the life cycle of systems and products
based on IEC 62890.With the six layers on the vertical axis,the components of Industry 4.0 are
described structurally [21]. As the center for collecting, processing, and delivering the information
both in the horizontal and vertical direction, the MES is indispensable in the developing manufacturing
industries [22].
domains.The concept of model-driven engineering (MDE) is concerned primarily with reducing this
gap through the use of abstractions to software implementations [5,6]. For the software development
using MDE concept, the primary artifacts of development are models, the transformation from models
into running systems is relied on computer-based technologies.By raising the level of abstraction
and automating labor-intensive and error-prone tasks, MDE has been seen as a solution to handle the
complexity of software development [7]. However, though many researchers have focused on the
industrial application of the MDE, such as for embedded software [8], mobile applications [9], and the
automated production systems [10], a concrete approach that covers the whole lifecycle of the MES
engineering has not been established yet.
This paper presents the first model-driven approach for the automatic generation of the MES and
emphasizes specification as well as MES generation with validation to fulfill the requirements from the
food and beverage industry.The feasibility of this approach is proven by its application to a brewing
process for thermal energy management.The paper is structured as follows.Section 2 introduces the
definition and functionality of the MES and gives a literature review to analyze the requirements and
barriers from the food and beverage industry for MES implementation.Previous works related to MDE
have also been presented in this section.Section 3 presents the requirements that should be fulfilled
by a model-driven approach for MES engineering based on the literature review.Section 4 describes
the developed model-driven approach in detail.Section 5 provides a use case on the application of
this approach to a brewhouse and evaluates it according to the requirements presented in Section 3
Section 6 draws conclusions and outlines future work.
2.State of the Art
2.1.Definition and Functionality of the MES
For the manufacturing industry, to fulfill the requirement from the shop floor on the data collection
and operation reaction in real-time, the idea of MES was firstly introduced by AMR Research in 1992,
and also in this year, MESA (Manufacturing Enterprise Solutions Association) was established [11,12].
According to MESA, the core task of the MES is considered as an information center that enables
the manufacturers to optimize production activities [13]. For different manufacturing environments,
twelve MES functionalities were defined [14]: resource allocation and control, dispatching production,
data collection and acquisition,quality management,process management,production tracking,
performance analysis,operations and detailed scheduling,document control,labor management,
maintenance management, and transport, storage, and tracking of materials.
According to hierarchy model defined in ISA-95 [15], the MES are located on level 3 and act as
the bridge between the automation layer and the enterprise layer [16]. Due to the development of
automation and information technology, the idea of Industry 4.0 was officially announced in 2013
as a German strategic initiative to keeping a pioneering role in the revolutionizing industries [17].
Three dimensions are contained in the paradigm of Industry 4.0:horizontal integration across the
entire value creation network, vertical integration, and networked manufacturing systems; end-to-end
engineering across the entire life cycle [18,19]. A three-dimensional model named RAMI 4.0 is proposed
as the reference architecture model bringing the essential elements together with di fferent standards in
order to implement Industry 4.0 techniques (Figure 1) [20].
RAMI 4.0 supplements the hierarchy level defined in IEC 62,264 with a lower level of “Product”
and an upper level of “Connected World”, which integrates the control systems and establishes the
environment of Industry 4.0.The left horizontal axis represents the life cycle of systems and products
based on IEC 62890.With the six layers on the vertical axis,the components of Industry 4.0 are
described structurally [21]. As the center for collecting, processing, and delivering the information
both in the horizontal and vertical direction, the MES is indispensable in the developing manufacturing
industries [22].
Electronics 2020, 9, 2040 3 of 21
Electronics 2020, 11, x FOR PEER REVIEW 3 of 21
Figure 1. Reference Architectural Model Industry 4.0 (RAMI 4.0) [21].
2.2. The Food and Beverage Industry
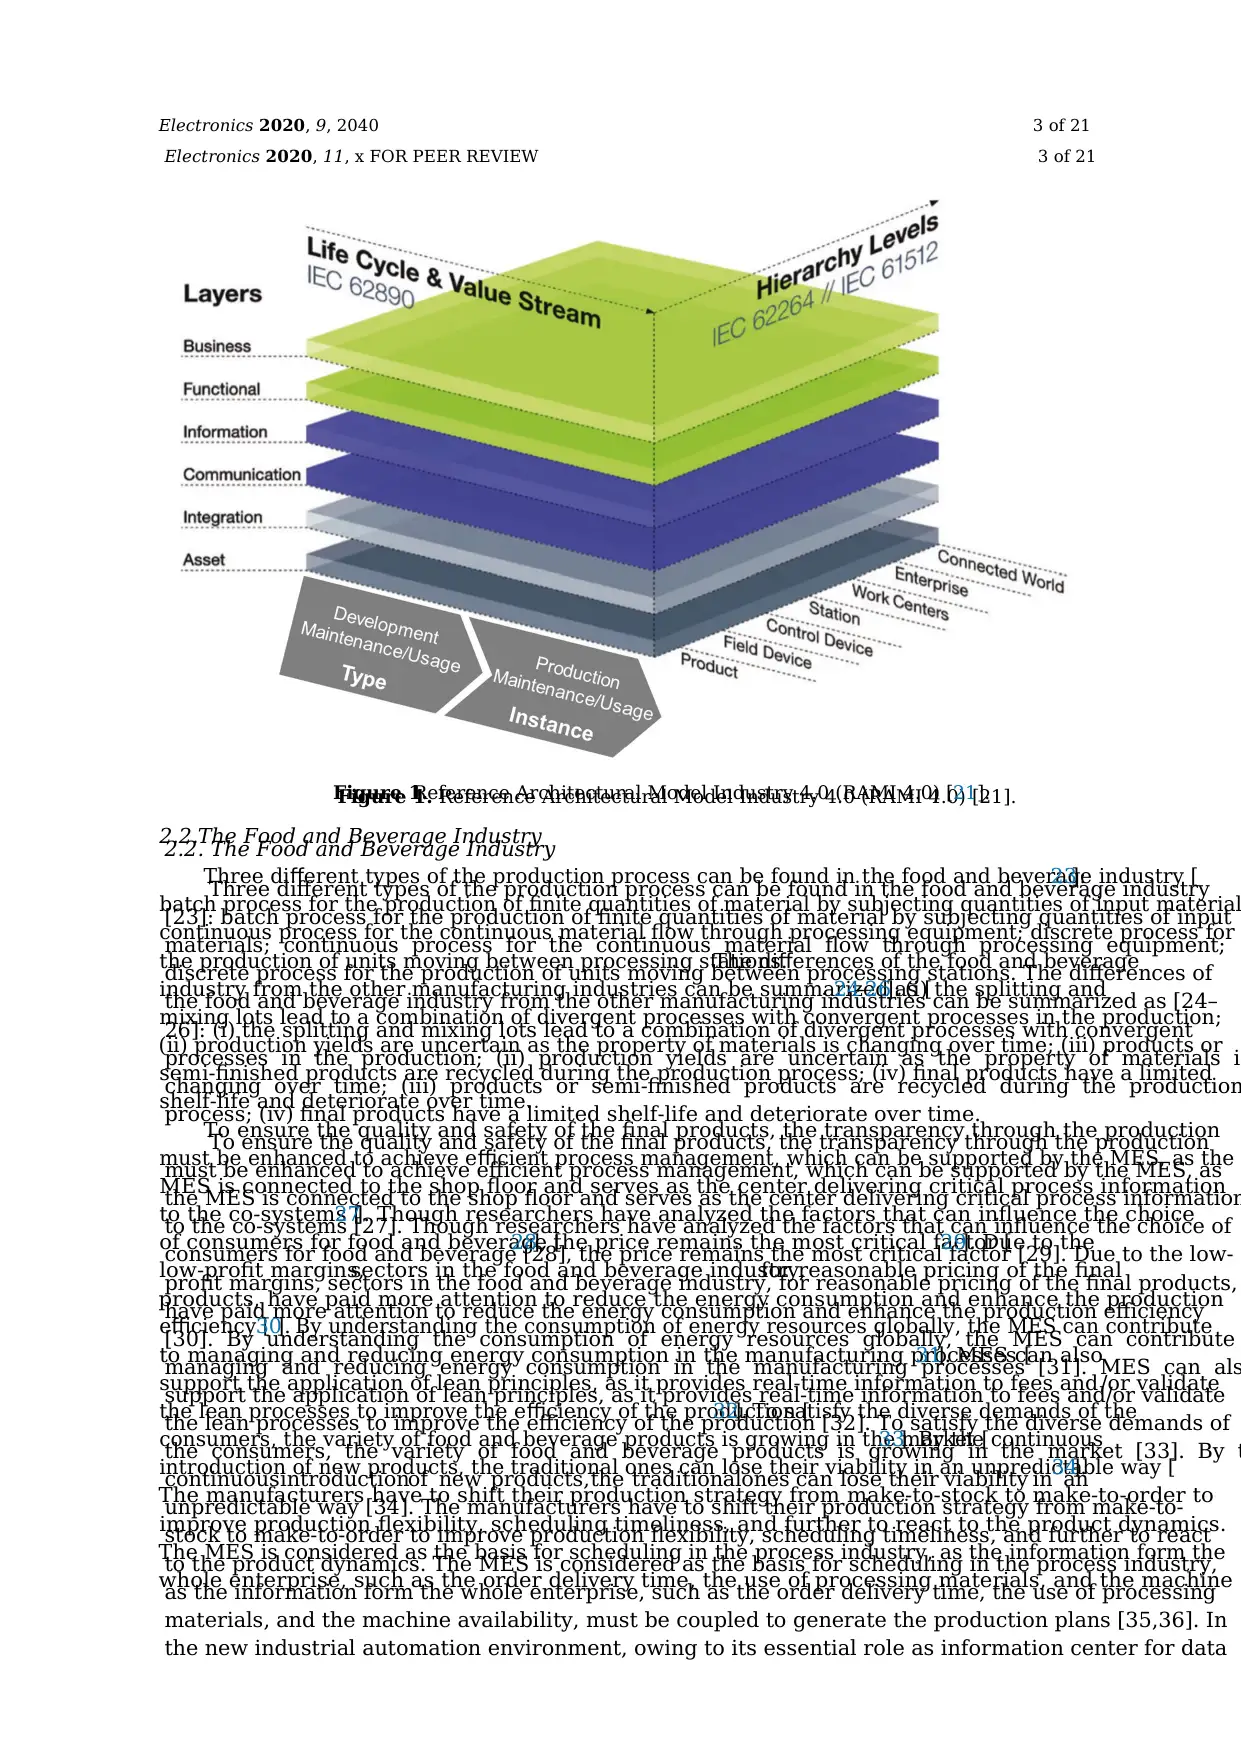
Three different types of the production process can be found in the food and beverage industry
[23]: batch process for the production of finite quantities of material by subjecting quantities of input
materials; continuous process for the continuous material flow through processing equipment;
discrete process for the production of units moving between processing stations. The differences of
the food and beverage industry from the other manufacturing industries can be summarized as [24–
26]: (i) the splitting and mixing lots lead to a combination of divergent processes with convergent
processes in the production; (ii) production yields are uncertain as the property of materials i
changing over time; (iii) products or semi-finished products are recycled during the production
process; (iv) final products have a limited shelf-life and deteriorate over time.
To ensure the quality and safety of the final products, the transparency through the production
must be enhanced to achieve efficient process management, which can be supported by the MES, as
the MES is connected to the shop floor and serves as the center delivering critical process information
to the co-systems [27]. Though researchers have analyzed the factors that can influence the choice of
consumers for food and beverage [28], the price remains the most critical factor [29]. Due to the low-
profit margins, sectors in the food and beverage industry, for reasonable pricing of the final products,
have paid more attention to reduce the energy consumption and enhance the production efficiency
[30]. By understanding the consumption of energy resources globally, the MES can contribute
managing and reducing energy consumption in the manufacturing processes [31]. MES can als
support the application of lean principles, as it provides real-time information to fees and/or validate
the lean processes to improve the efficiency of the production [32]. To satisfy the diverse demands of
the consumers, the variety of food and beverage products is growing in the market [33]. By t
continuousintroductionof new products, the traditionalones can lose their viability in an
unpredictable way [34]. The manufacturers have to shift their production strategy from make-to-
stock to make-to-order to improve production flexibility, scheduling timeliness, and further to react
to the product dynamics. The MES is considered as the basis for scheduling in the process industry,
as the information form the whole enterprise, such as the order delivery time, the use of processing
materials, and the machine availability, must be coupled to generate the production plans [35,36]. In
the new industrial automation environment, owing to its essential role as information center for data
Figure 1.Reference Architectural Model Industry 4.0 (RAMI 4.0) [21].
2.2.The Food and Beverage Industry
Three different types of the production process can be found in the food and beverage industry [23]:
batch process for the production of finite quantities of material by subjecting quantities of input material
continuous process for the continuous material flow through processing equipment; discrete process for
the production of units moving between processing stations.The differences of the food and beverage
industry from the other manufacturing industries can be summarized as [24–26]: (i) the splitting and
mixing lots lead to a combination of divergent processes with convergent processes in the production;
(ii) production yields are uncertain as the property of materials is changing over time; (iii) products or
semi-finished products are recycled during the production process; (iv) final products have a limited
shelf-life and deteriorate over time.
To ensure the quality and safety of the final products, the transparency through the production
must be enhanced to achieve efficient process management, which can be supported by the MES, as the
MES is connected to the shop floor and serves as the center delivering critical process information
to the co-systems [27]. Though researchers have analyzed the factors that can influence the choice
of consumers for food and beverage [28], the price remains the most critical factor [29]. Due to the
low-profit margins,sectors in the food and beverage industry,for reasonable pricing of the final
products, have paid more attention to reduce the energy consumption and enhance the production
efficiency [30]. By understanding the consumption of energy resources globally, the MES can contribute
to managing and reducing energy consumption in the manufacturing processes [31]. MES can also
support the application of lean principles, as it provides real-time information to fees and /or validate
the lean processes to improve the efficiency of the production [32]. To satisfy the diverse demands of the
consumers, the variety of food and beverage products is growing in the market [33]. By the continuous
introduction of new products, the traditional ones can lose their viability in an unpredictable way [34].
The manufacturers have to shift their production strategy from make-to-stock to make-to-order to
improve production flexibility, scheduling timeliness, and further to react to the product dynamics.
The MES is considered as the basis for scheduling in the process industry, as the information form the
whole enterprise, such as the order delivery time, the use of processing materials, and the machine
Electronics 2020, 11, x FOR PEER REVIEW 3 of 21
Figure 1. Reference Architectural Model Industry 4.0 (RAMI 4.0) [21].
2.2. The Food and Beverage Industry
Three different types of the production process can be found in the food and beverage industry
[23]: batch process for the production of finite quantities of material by subjecting quantities of input
materials; continuous process for the continuous material flow through processing equipment;
discrete process for the production of units moving between processing stations. The differences of
the food and beverage industry from the other manufacturing industries can be summarized as [24–
26]: (i) the splitting and mixing lots lead to a combination of divergent processes with convergent
processes in the production; (ii) production yields are uncertain as the property of materials i
changing over time; (iii) products or semi-finished products are recycled during the production
process; (iv) final products have a limited shelf-life and deteriorate over time.
To ensure the quality and safety of the final products, the transparency through the production
must be enhanced to achieve efficient process management, which can be supported by the MES, as
the MES is connected to the shop floor and serves as the center delivering critical process information
to the co-systems [27]. Though researchers have analyzed the factors that can influence the choice of
consumers for food and beverage [28], the price remains the most critical factor [29]. Due to the low-
profit margins, sectors in the food and beverage industry, for reasonable pricing of the final products,
have paid more attention to reduce the energy consumption and enhance the production efficiency
[30]. By understanding the consumption of energy resources globally, the MES can contribute
managing and reducing energy consumption in the manufacturing processes [31]. MES can als
support the application of lean principles, as it provides real-time information to fees and/or validate
the lean processes to improve the efficiency of the production [32]. To satisfy the diverse demands of
the consumers, the variety of food and beverage products is growing in the market [33]. By t
continuousintroductionof new products, the traditionalones can lose their viability in an
unpredictable way [34]. The manufacturers have to shift their production strategy from make-to-
stock to make-to-order to improve production flexibility, scheduling timeliness, and further to react
to the product dynamics. The MES is considered as the basis for scheduling in the process industry,
as the information form the whole enterprise, such as the order delivery time, the use of processing
materials, and the machine availability, must be coupled to generate the production plans [35,36]. In
the new industrial automation environment, owing to its essential role as information center for data
Figure 1.Reference Architectural Model Industry 4.0 (RAMI 4.0) [21].
2.2.The Food and Beverage Industry
Three different types of the production process can be found in the food and beverage industry [23]:
batch process for the production of finite quantities of material by subjecting quantities of input material
continuous process for the continuous material flow through processing equipment; discrete process for
the production of units moving between processing stations.The differences of the food and beverage
industry from the other manufacturing industries can be summarized as [24–26]: (i) the splitting and
mixing lots lead to a combination of divergent processes with convergent processes in the production;
(ii) production yields are uncertain as the property of materials is changing over time; (iii) products or
semi-finished products are recycled during the production process; (iv) final products have a limited
shelf-life and deteriorate over time.
To ensure the quality and safety of the final products, the transparency through the production
must be enhanced to achieve efficient process management, which can be supported by the MES, as the
MES is connected to the shop floor and serves as the center delivering critical process information
to the co-systems [27]. Though researchers have analyzed the factors that can influence the choice
of consumers for food and beverage [28], the price remains the most critical factor [29]. Due to the
low-profit margins,sectors in the food and beverage industry,for reasonable pricing of the final
products, have paid more attention to reduce the energy consumption and enhance the production
efficiency [30]. By understanding the consumption of energy resources globally, the MES can contribute
to managing and reducing energy consumption in the manufacturing processes [31]. MES can also
support the application of lean principles, as it provides real-time information to fees and /or validate
the lean processes to improve the efficiency of the production [32]. To satisfy the diverse demands of the
consumers, the variety of food and beverage products is growing in the market [33]. By the continuous
introduction of new products, the traditional ones can lose their viability in an unpredictable way [34].
The manufacturers have to shift their production strategy from make-to-stock to make-to-order to
improve production flexibility, scheduling timeliness, and further to react to the product dynamics.
The MES is considered as the basis for scheduling in the process industry, as the information form the
whole enterprise, such as the order delivery time, the use of processing materials, and the machine
⊘ This is a preview!⊘
Do you want full access?
Subscribe today to unlock all pages.
Trusted by 1+ million students worldwide
Electronics 2020, 9, 2040 4 of 21
availability, must be coupled to generate the production plans [35,36]. In the new industrial automation
environment,owing to its essential role as information center for data processing and providing
between the enterprise level and the automation layer, the modern technologies, such as Industry 4.0,
cyber-physical systems, and digital factory, are enabled by the MES to optimize the food and beverage
manufacturing processes [37,38].
2.3.MDE for Production Management Systems
To promote the reusability and to reduce the complexity of the software development process,
the concept of MDE has been researched and used in a wide range of industrial applications [39],
such as business imaging systems,electric systems for telecommunications,and robot operating
systems [40,41]. For the development of control systems, Alvarez et al. [42] developed a model-driven
approach named MeiA, which has integrated methods and techniques within the automation discipline,
provided more accessible verification procedures and structured designs, and improved productivity
by means of model reuse and code generation.In the area of business process management, the MDE
proposed a set of methodologies, which can bridge the gap between business analysts and software
developers [43]. Blal and Leshob [44] proposed a model-driven method to generate and specify
services of service-oriented systems from business models expressed by Business Process Model and
Notation (BPMN), a standardized graphical specification language for business process modeling and
automation [45]. Due to the support of the modular engineering process, management of heterogeneity
and complexity, reusability of design artifacts, MDE should not be waived to enable technologies
of Industry 4.0 [46]. An MDE framework (MDE4IoT) was introduced in [47] to generate Internet of
Things (IoT) systems supporting the modeling of Things and self-adaptation of connected systems.
Leal et al. [48] developed a model-driven approach (smartHMI4I4) providing reusable Application
Programming Interface (API) and widgets as a global framework to guide the HMI design and
generation for different devices across Industry 4.0 application scenarios.Binder et al. [49] proposed
a model-driven system development process integrating RAMI 4.0 to provide a common basis for
the development of Industry 4.0 systems reducing the complexity of engineering processes and
heterogeneity of platforms and toolsets.
For production management systems,some MDE approaches have already been established.
For the implementation of an ERP system, a model-driven approach was proposed using the MDA
framework by Dugerdil and Gaillard [50]. They defined a UML profile to model the business process
in the level of ERP and used models to describe the transformation.In their approach, the ERP system
was already implemented as a toolbox including different functional components.Instead of code
generation,the components can be enabled or disabled to fulfill the requirements of the business
process.A modeling approach that uses a state chart for describing and simulating the sequence of
operation in MES was presented in [51]. However, the focus was on the modeling and simulation
phase, and it lacked further steps for generating an operational system.Oliveira et al. [52] proposed
an interpretive MDE approach for enterprise applications and compared the productivity, profitabilit
and return on investment (ROI) between the generative and interpretive MDE approaches based on
its application to development of ERP systems.In this research,though the MDE concept has been
implemented,the used modeling language,models and their specifications,and the transformation
between them were not clarified.For the MES, an approach according to the MDA development method
was presented by Mizuoka and Koga [53], in which the UML and XML Metadata Interchange (XMI)
were used for modeling and platforms transforming.The application scenario of this approach was not
declared, and it was also mentioned that the UML as a general modeling language may not be suitabl
for modeling MES [54], because the MES modeling is related to the target business process and requires
interdisciplinary information from the co-workers of different departments, who may have different
views on the same production processes [55].
The MES Modeling Language (MES-ML)was developed as a modeling language for the
interdisciplinary specification of MES [56]. For the generation of operationalMES according to
Paraphrase This Document
Need a fresh take? Get an instant paraphrase of this document with our AI Paraphraser
Electronics 2020, 9, 2040 5 of 21
the MDE concept, the metamodel of MES-ML was extended [57]. With this extension, the components
of MES (plants,processes,MES functions,and reports) and their connections could be modeled
completely, and the extended MES-ML was validated with a modeling example, which proved the
feasibility of this language for the MDE of MES. However, it lacked an explanation of the steps that are
needed to represent the information in the model and for the transformation between di fferent models
for automatic MES generation.The concept of model-driven engineering for MES by using the extended
MES-ML was proposed first in 2017 [58]. Chen et al. [59] proposed in 2018 a model-driven approach
for MES with more details,which consisted of three steps,modeling,specifying,and generating.
Their research focused on the step of modeling with extended MES-ML that was integrated, in which
libraries for predefined modeling elements were introduced.The feasibility and the necessity of the
predefined modeling elements were also evaluated and proven by their research so that the basis for
the model-driven engineering of MES was established.However, details of the latter steps, including
specifying and generating, were not clarified.
3.Requirements on the Approach
Conventionally,seven phases are necessary to implementthe MES in a manufacturing
enterprise [60]: basic determination for determining the MES project scope and content; preplanning
for analyzing the business, production processes, and the MES functions; basic planning for evaluating
and drafting the MES concept and recommendation; realization planning for mapping the MES in
detail;implementation for installing and integrating the hardware and software;commissioning
for testing the MES software and training the users; completion for compiling the final report and
drafting project accounting.The specific business and manufacturing processes must be considered in
each phase to be executed, therefore, the MES must be adopted with considerable customizing and
programming effort, which is cost-intensive and error-prone [61,62].
Based on the facts that more than 99% of the enterprises in the food and beverage industry
are small- and medium-sized enterprises [63], and few rudiments of MES are specifically designed
to fulfill the requirements from the food and beverage industry with relatively low programming
and customizing effort, and further low cost, the MES implementation in the food and beverage is
hindered by the unavailability of the resources from the side of the end-users and the lack of methods
to reduce the implementation complexity from the side of the MES providers.Chen and Voigt [64]
analyzed the barriers for the MES implementation in the food and beverage industry combined with
their characteristics, and proposed solutions to deal with the barriers, i.e., the use of standardized
information model for the information exchange in the whole enterprise to reduce the integrating e ffort,
the service-oriented architecture for dividing the MES functions in independent services to achieve
higher reusability, and the model-driven concept for engineering the MES to reduce the programming
and customizing effort.Therefore, the requirements that should be fulfilled by the presented approach
are defined as:
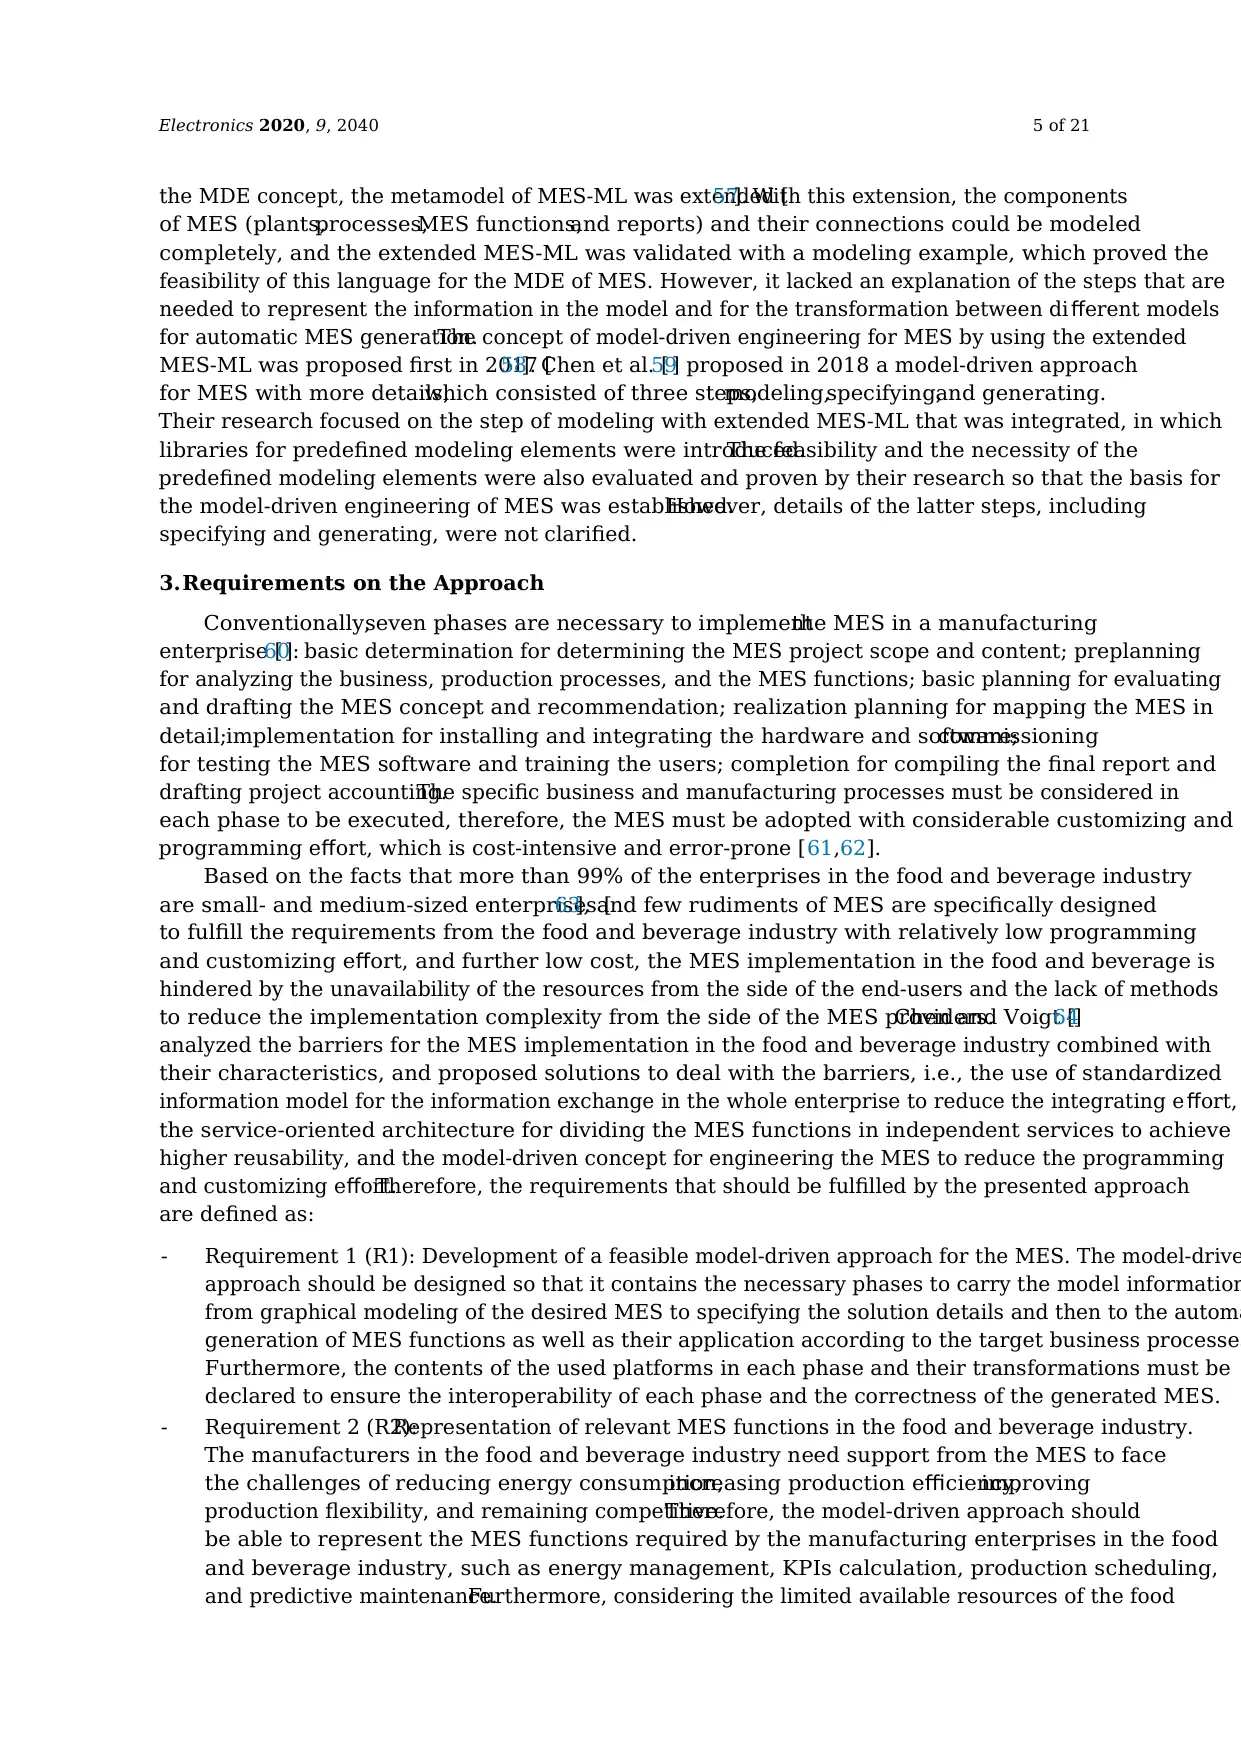
- Requirement 1 (R1): Development of a feasible model-driven approach for the MES. The model-drive
approach should be designed so that it contains the necessary phases to carry the model information
from graphical modeling of the desired MES to specifying the solution details and then to the automa
generation of MES functions as well as their application according to the target business processes
Furthermore, the contents of the used platforms in each phase and their transformations must be
declared to ensure the interoperability of each phase and the correctness of the generated MES.
- Requirement 2 (R2):Representation of relevant MES functions in the food and beverage industry.
The manufacturers in the food and beverage industry need support from the MES to face
the challenges of reducing energy consumption,increasing production efficiency,improving
production flexibility, and remaining competitive.Therefore, the model-driven approach should
be able to represent the MES functions required by the manufacturing enterprises in the food
and beverage industry, such as energy management, KPIs calculation, production scheduling,
and predictive maintenance.Furthermore, considering the limited available resources of the food
the MDE concept, the metamodel of MES-ML was extended [57]. With this extension, the components
of MES (plants,processes,MES functions,and reports) and their connections could be modeled
completely, and the extended MES-ML was validated with a modeling example, which proved the
feasibility of this language for the MDE of MES. However, it lacked an explanation of the steps that are
needed to represent the information in the model and for the transformation between di fferent models
for automatic MES generation.The concept of model-driven engineering for MES by using the extended
MES-ML was proposed first in 2017 [58]. Chen et al. [59] proposed in 2018 a model-driven approach
for MES with more details,which consisted of three steps,modeling,specifying,and generating.
Their research focused on the step of modeling with extended MES-ML that was integrated, in which
libraries for predefined modeling elements were introduced.The feasibility and the necessity of the
predefined modeling elements were also evaluated and proven by their research so that the basis for
the model-driven engineering of MES was established.However, details of the latter steps, including
specifying and generating, were not clarified.
3.Requirements on the Approach
Conventionally,seven phases are necessary to implementthe MES in a manufacturing
enterprise [60]: basic determination for determining the MES project scope and content; preplanning
for analyzing the business, production processes, and the MES functions; basic planning for evaluating
and drafting the MES concept and recommendation; realization planning for mapping the MES in
detail;implementation for installing and integrating the hardware and software;commissioning
for testing the MES software and training the users; completion for compiling the final report and
drafting project accounting.The specific business and manufacturing processes must be considered in
each phase to be executed, therefore, the MES must be adopted with considerable customizing and
programming effort, which is cost-intensive and error-prone [61,62].
Based on the facts that more than 99% of the enterprises in the food and beverage industry
are small- and medium-sized enterprises [63], and few rudiments of MES are specifically designed
to fulfill the requirements from the food and beverage industry with relatively low programming
and customizing effort, and further low cost, the MES implementation in the food and beverage is
hindered by the unavailability of the resources from the side of the end-users and the lack of methods
to reduce the implementation complexity from the side of the MES providers.Chen and Voigt [64]
analyzed the barriers for the MES implementation in the food and beverage industry combined with
their characteristics, and proposed solutions to deal with the barriers, i.e., the use of standardized
information model for the information exchange in the whole enterprise to reduce the integrating e ffort,
the service-oriented architecture for dividing the MES functions in independent services to achieve
higher reusability, and the model-driven concept for engineering the MES to reduce the programming
and customizing effort.Therefore, the requirements that should be fulfilled by the presented approach
are defined as:
- Requirement 1 (R1): Development of a feasible model-driven approach for the MES. The model-drive
approach should be designed so that it contains the necessary phases to carry the model information
from graphical modeling of the desired MES to specifying the solution details and then to the automa
generation of MES functions as well as their application according to the target business processes
Furthermore, the contents of the used platforms in each phase and their transformations must be
declared to ensure the interoperability of each phase and the correctness of the generated MES.
- Requirement 2 (R2):Representation of relevant MES functions in the food and beverage industry.
The manufacturers in the food and beverage industry need support from the MES to face
the challenges of reducing energy consumption,increasing production efficiency,improving
production flexibility, and remaining competitive.Therefore, the model-driven approach should
be able to represent the MES functions required by the manufacturing enterprises in the food
and beverage industry, such as energy management, KPIs calculation, production scheduling,
and predictive maintenance.Furthermore, considering the limited available resources of the food
Electronics 2020, 9, 2040 6 of 21
and beverage manufacturing enterprises, the approach should be able to lower the programming
and customizing efforts during the engineering process.
- Requirement 3 (R3):Capability of data flow.To implement the developed model-driven approach
in different application scenarios without redefining the information interface,a consistent
communication standard between the shop floor level and MES level should be supported.
Additionally, a standardized communication interface should be used for data exchange to ensure
the portability of the modeling elements, which are predefined and to be reused.
- Requirement 4 (R4):Automatic adoption of the generated MES. The model-driven approach
should not be defined to serve definite application scenarios but could be applied to fulfill various
demands on the MES from different domains.Thus, the basic elements that were used to establish
the MES model must be defined neutrally.Due to the flexible sequence of the basic elements and
further the information flow, the MES that modeled with the basic elements should be generated
dynamically, so that it can be adopted automatically to each specific application scenario.
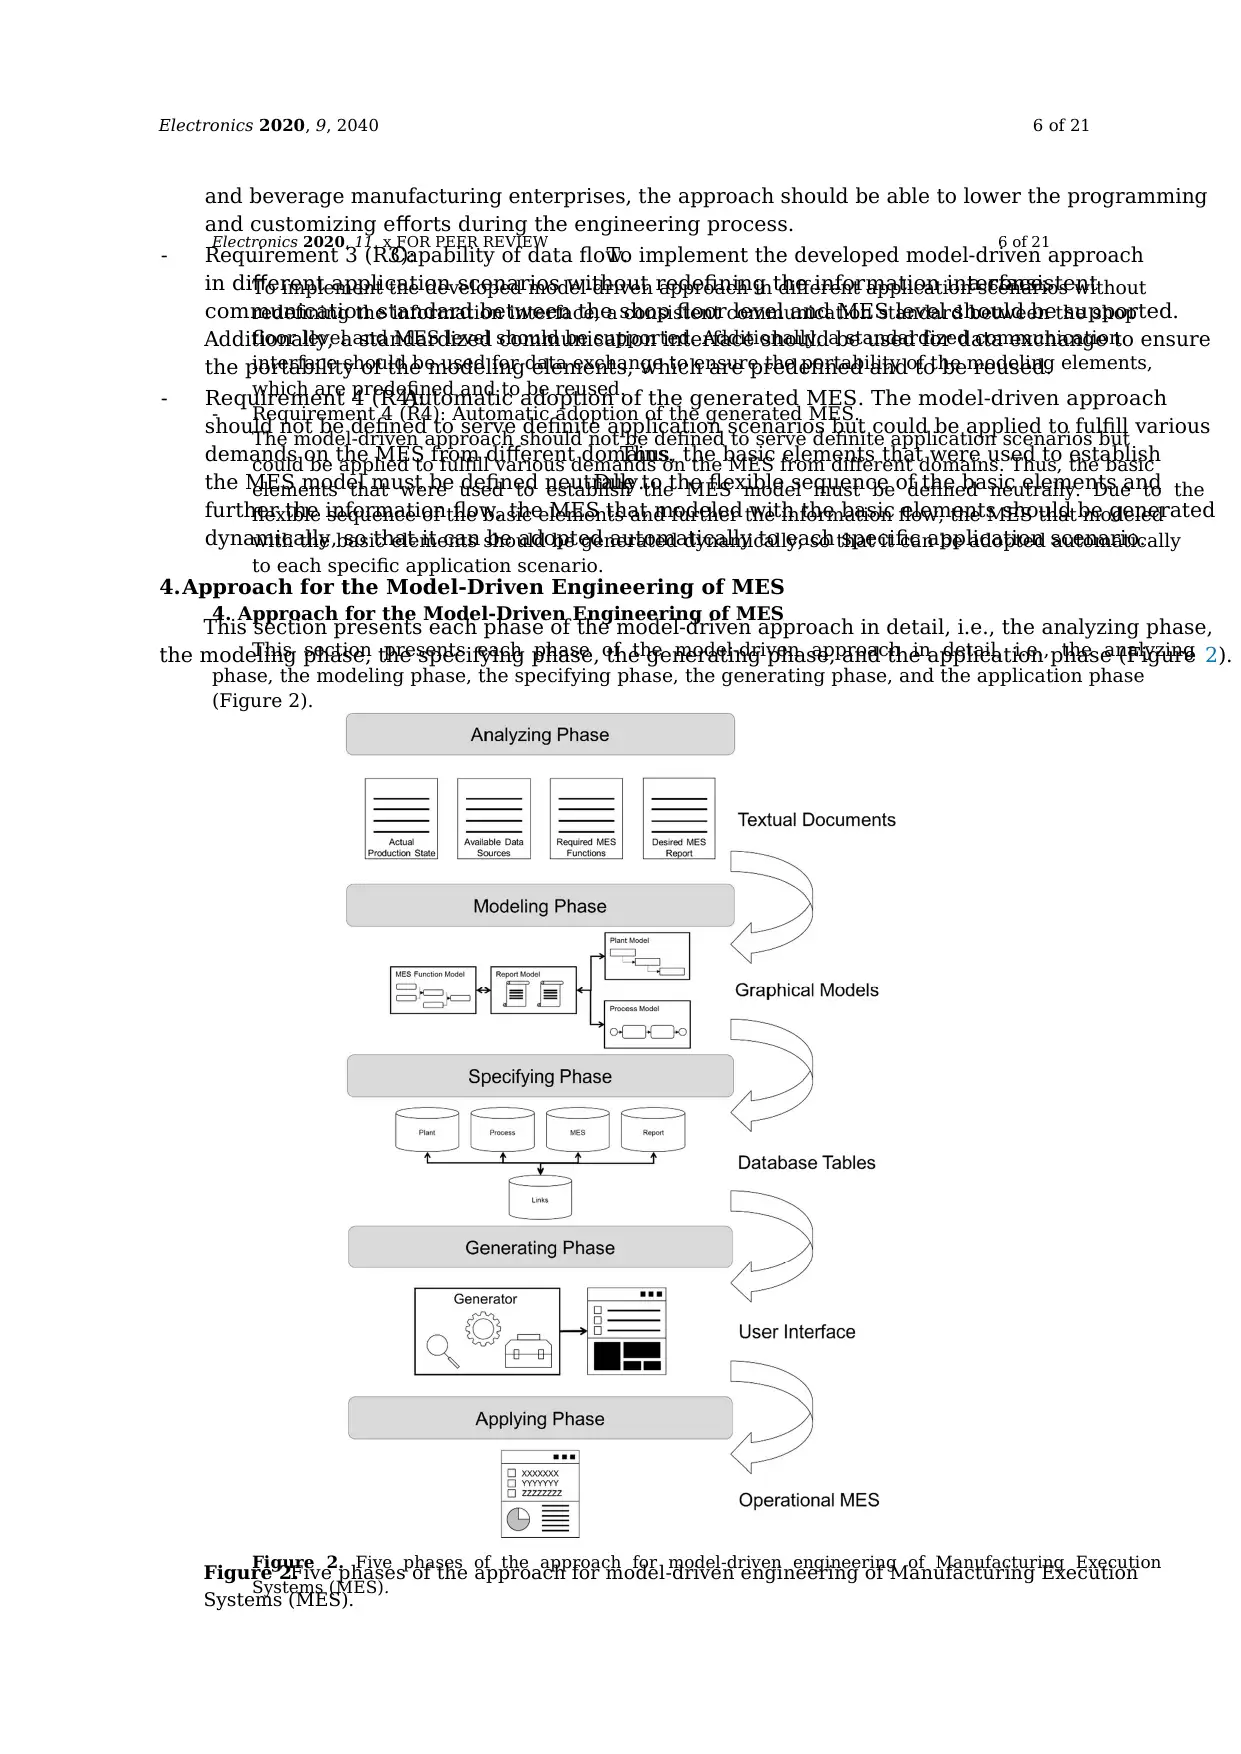
4.Approach for the Model-Driven Engineering of MES
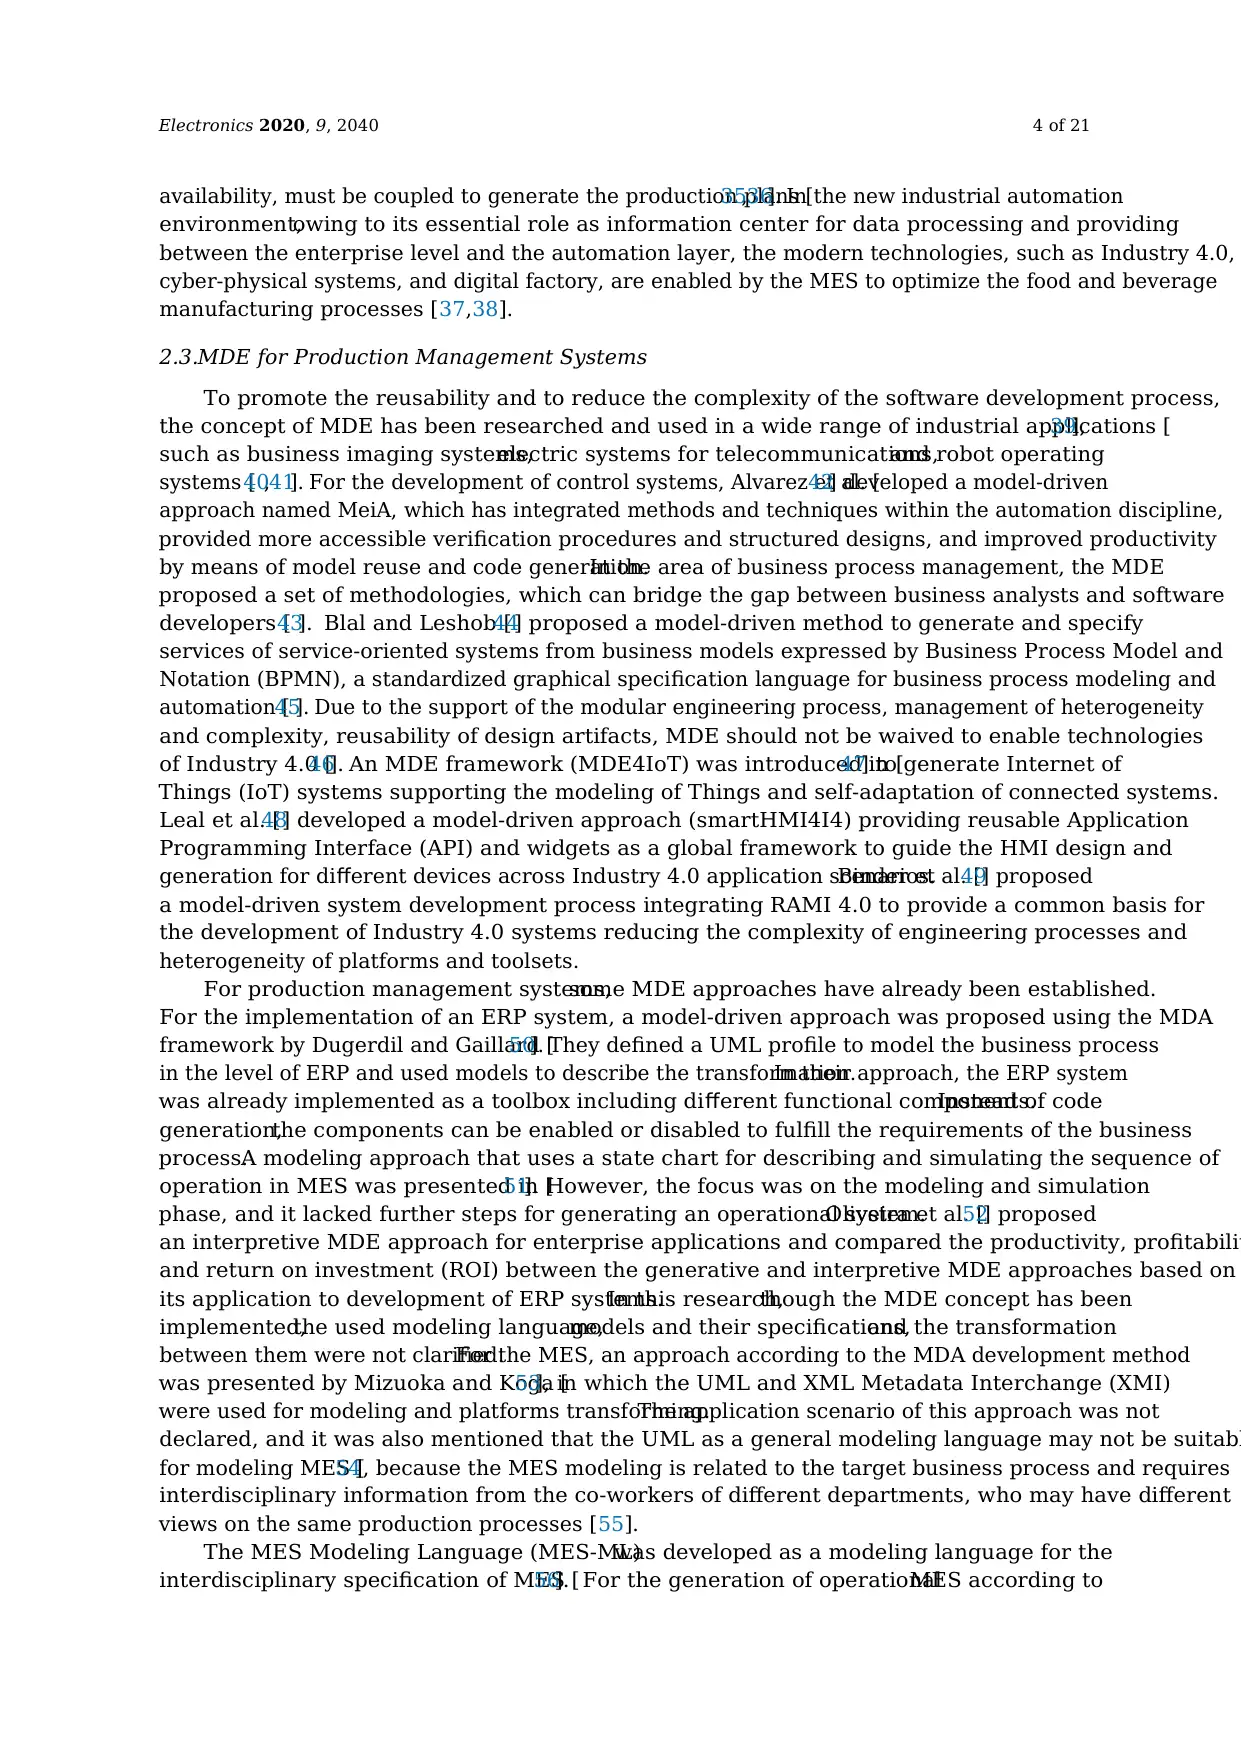
This section presents each phase of the model-driven approach in detail, i.e., the analyzing phase,
the modeling phase, the specifying phase, the generating phase, and the application phase (Figure 2).
Electronics 2020, 11, x FOR PEER REVIEW 6 of 21
To implement the developed model-driven approach in different application scenarios without
redefining the information interface, a consistent communication standard between the shop
floor level and MES level should be supported. Additionally, a standardized communication
interface should be used for data exchange to ensure the portability of the modeling elements,
which are predefined and to be reused.
- Requirement 4 (R4): Automatic adoption of the generated MES.
The model-driven approach should not be defined to serve definite application scenarios but
could be applied to fulfill various demands on the MES from different domains. Thus, the basic
elements that were used to establish the MES model must be defined neutrally. Due to the
flexible sequence of the basic elements and further the information flow, the MES that modeled
with the basic elements should be generated dynamically, so that it can be adopted automatically
to each specific application scenario.
4. Approach for the Model-Driven Engineering of MES
This section presents each phase of the model-driven approach in detail, i.e., the analyzing
phase, the modeling phase, the specifying phase, the generating phase, and the application phase
(Figure 2).
Figure 2. Five phases of the approach for model-driven engineering of Manufacturing Execution
Systems (MES).
Figure 2.Five phases of the approach for model-driven engineering of Manufacturing Execution
Systems (MES).
and beverage manufacturing enterprises, the approach should be able to lower the programming
and customizing efforts during the engineering process.
- Requirement 3 (R3):Capability of data flow.To implement the developed model-driven approach
in different application scenarios without redefining the information interface,a consistent
communication standard between the shop floor level and MES level should be supported.
Additionally, a standardized communication interface should be used for data exchange to ensure
the portability of the modeling elements, which are predefined and to be reused.
- Requirement 4 (R4):Automatic adoption of the generated MES. The model-driven approach
should not be defined to serve definite application scenarios but could be applied to fulfill various
demands on the MES from different domains.Thus, the basic elements that were used to establish
the MES model must be defined neutrally.Due to the flexible sequence of the basic elements and
further the information flow, the MES that modeled with the basic elements should be generated
dynamically, so that it can be adopted automatically to each specific application scenario.
4.Approach for the Model-Driven Engineering of MES
This section presents each phase of the model-driven approach in detail, i.e., the analyzing phase,
the modeling phase, the specifying phase, the generating phase, and the application phase (Figure 2).
Electronics 2020, 11, x FOR PEER REVIEW 6 of 21
To implement the developed model-driven approach in different application scenarios without
redefining the information interface, a consistent communication standard between the shop
floor level and MES level should be supported. Additionally, a standardized communication
interface should be used for data exchange to ensure the portability of the modeling elements,
which are predefined and to be reused.
- Requirement 4 (R4): Automatic adoption of the generated MES.
The model-driven approach should not be defined to serve definite application scenarios but
could be applied to fulfill various demands on the MES from different domains. Thus, the basic
elements that were used to establish the MES model must be defined neutrally. Due to the
flexible sequence of the basic elements and further the information flow, the MES that modeled
with the basic elements should be generated dynamically, so that it can be adopted automatically
to each specific application scenario.
4. Approach for the Model-Driven Engineering of MES
This section presents each phase of the model-driven approach in detail, i.e., the analyzing
phase, the modeling phase, the specifying phase, the generating phase, and the application phase
(Figure 2).
Figure 2. Five phases of the approach for model-driven engineering of Manufacturing Execution
Systems (MES).
Figure 2.Five phases of the approach for model-driven engineering of Manufacturing Execution
Systems (MES).
⊘ This is a preview!⊘
Do you want full access?
Subscribe today to unlock all pages.
Trusted by 1+ million students worldwide
Electronics 2020, 9, 2040 7 of 21
To ensure the consistency of data flow in the horizontal transformation from model to the operable
system,as well as in the vertical integration between the automation level and enterprise level,
“Weihenstephan Standards (WS)” [65] are integrated in this approach,which are widely used in
the food and beverage industry.The WS is a standard information model that defines a universal
communication interface for the communication between different process control systems and the
MES. With WS, the processing of the machine and process data could be consistently defined for the
MES functions.To ensure the portability of models, WS is used as the primary information model
through the whole approach.The following sections present the engineering processes, the tasks,
and the related tools of each phase.
4.1.Analyzing Phase
As the preliminary study before the modeling phase, the actual state of the production plant
and its processes with their acquirable data sources,the demands on the MES functions,and the
desired MES reports should be analyzed.This phase is addressed primarily at the end-users.The main
concepts and entities of the domain are analyzed.Multiple co-workers (end-users with internal and/or
external solution analysts) with different focuses and working backgrounds must work together to
figure out the proper MES functions as well as the information flow among departments in a completed
MES [56]. The results of this phase are textual specification sheets indicating the actual stand of the
production state (technical systems and production processes), the available data sources from the
production, the required functions, and the desired report of the MES.
4.2.Modeling Phase
At the modeling phase, the MES that fulfill the demands in the first phase must be modeled,
based on the results of the analyzing phase.The extended MES Modeling Language (MES-ML) is a
formal modeling language and was proven to be suitable for modeling the MES with a model-driven
concept [57]. An editor that supports the extended MES-ML can assist the modeling process.The output
of the modeling phase is a completed graphical model of the MES containing the necessary information
for the transformation and generation in the later phases.
In the extended MES-ML, the plant model is structured as a tree diagram with six hierarchy
levels to present the technical systems that are inspired by the ISA-95 [15,57], i.e., factory, area, plant,
line, machine, and aggregate.Under each technical element in the hierarchy level, data points can be
assigned to indicate the data that can be provided.The process can be modeled with three hierarchy
levels with an increasing grade of detail;namely,process,process stage,and process operation,
which are defined in ISA-88 as the first three levels in the process model [23]. To model the MES
function, a series of basic functions were defined to compose the final MES function.The report is
modeled with its name and the report elements belong to it.The data from the technical systems
and the processes are the inputs,and the results of the MES functions are outputs of the reports.
Each report element can display the information in a certain manner, such as text, table, or diagram,
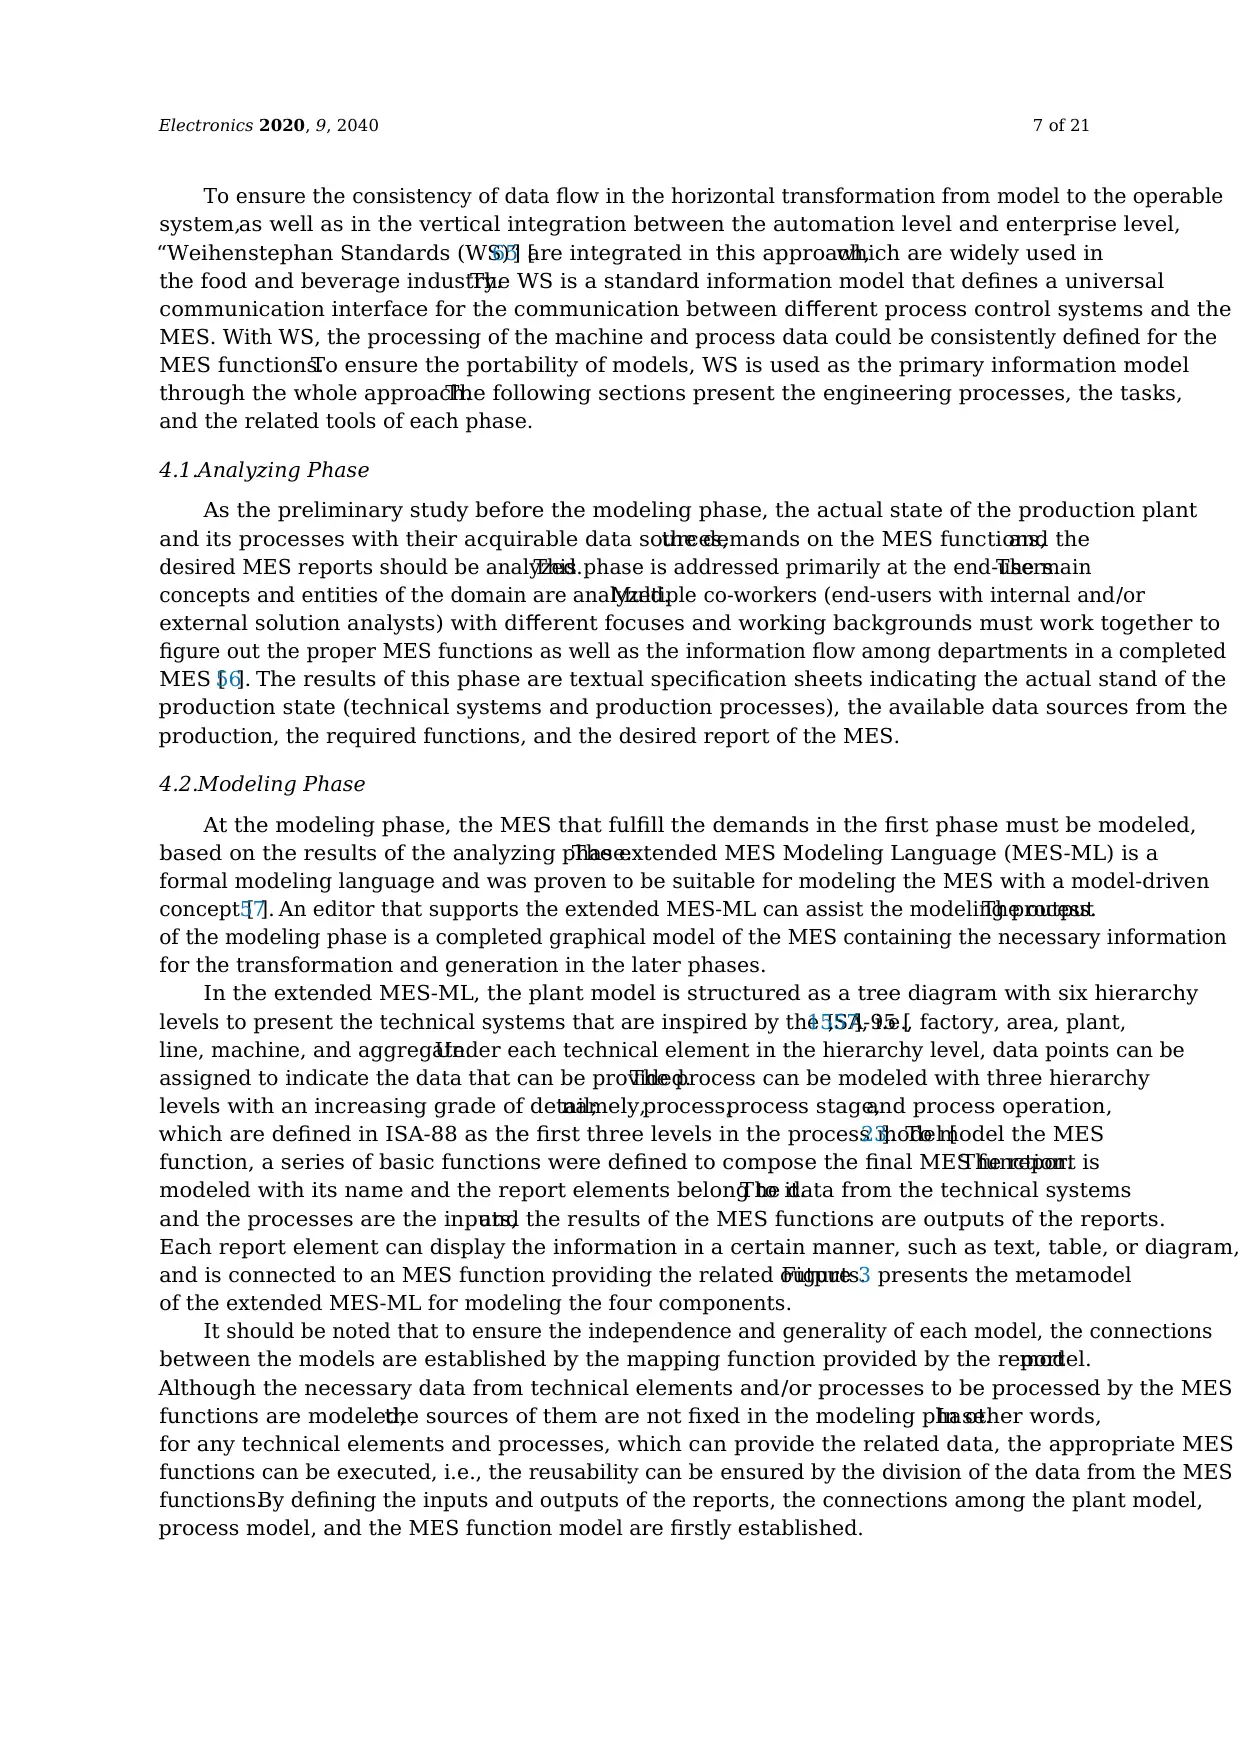
and is connected to an MES function providing the related outputs.Figure 3 presents the metamodel
of the extended MES-ML for modeling the four components.
It should be noted that to ensure the independence and generality of each model, the connections
between the models are established by the mapping function provided by the reportmodel.
Although the necessary data from technical elements and/or processes to be processed by the MES
functions are modeled,the sources of them are not fixed in the modeling phase.In other words,
for any technical elements and processes, which can provide the related data, the appropriate MES
functions can be executed, i.e., the reusability can be ensured by the division of the data from the MES
functions.By defining the inputs and outputs of the reports, the connections among the plant model,
process model, and the MES function model are firstly established.
To ensure the consistency of data flow in the horizontal transformation from model to the operable
system,as well as in the vertical integration between the automation level and enterprise level,
“Weihenstephan Standards (WS)” [65] are integrated in this approach,which are widely used in
the food and beverage industry.The WS is a standard information model that defines a universal
communication interface for the communication between different process control systems and the
MES. With WS, the processing of the machine and process data could be consistently defined for the
MES functions.To ensure the portability of models, WS is used as the primary information model
through the whole approach.The following sections present the engineering processes, the tasks,
and the related tools of each phase.
4.1.Analyzing Phase
As the preliminary study before the modeling phase, the actual state of the production plant
and its processes with their acquirable data sources,the demands on the MES functions,and the
desired MES reports should be analyzed.This phase is addressed primarily at the end-users.The main
concepts and entities of the domain are analyzed.Multiple co-workers (end-users with internal and/or
external solution analysts) with different focuses and working backgrounds must work together to
figure out the proper MES functions as well as the information flow among departments in a completed
MES [56]. The results of this phase are textual specification sheets indicating the actual stand of the
production state (technical systems and production processes), the available data sources from the
production, the required functions, and the desired report of the MES.
4.2.Modeling Phase
At the modeling phase, the MES that fulfill the demands in the first phase must be modeled,
based on the results of the analyzing phase.The extended MES Modeling Language (MES-ML) is a
formal modeling language and was proven to be suitable for modeling the MES with a model-driven
concept [57]. An editor that supports the extended MES-ML can assist the modeling process.The output
of the modeling phase is a completed graphical model of the MES containing the necessary information
for the transformation and generation in the later phases.
In the extended MES-ML, the plant model is structured as a tree diagram with six hierarchy
levels to present the technical systems that are inspired by the ISA-95 [15,57], i.e., factory, area, plant,
line, machine, and aggregate.Under each technical element in the hierarchy level, data points can be
assigned to indicate the data that can be provided.The process can be modeled with three hierarchy
levels with an increasing grade of detail;namely,process,process stage,and process operation,
which are defined in ISA-88 as the first three levels in the process model [23]. To model the MES
function, a series of basic functions were defined to compose the final MES function.The report is
modeled with its name and the report elements belong to it.The data from the technical systems
and the processes are the inputs,and the results of the MES functions are outputs of the reports.
Each report element can display the information in a certain manner, such as text, table, or diagram,
and is connected to an MES function providing the related outputs.Figure 3 presents the metamodel
of the extended MES-ML for modeling the four components.
It should be noted that to ensure the independence and generality of each model, the connections
between the models are established by the mapping function provided by the reportmodel.
Although the necessary data from technical elements and/or processes to be processed by the MES
functions are modeled,the sources of them are not fixed in the modeling phase.In other words,
for any technical elements and processes, which can provide the related data, the appropriate MES
functions can be executed, i.e., the reusability can be ensured by the division of the data from the MES
functions.By defining the inputs and outputs of the reports, the connections among the plant model,
process model, and the MES function model are firstly established.
Paraphrase This Document
Need a fresh take? Get an instant paraphrase of this document with our AI Paraphraser
Electronics 2020, 9, 2040 8 of 21
Electronics 2020, 11, x FOR PEER REVIEW 8 of 21
Figure 3. Metamodel of the modeling language MES Modeling Language (MES-ML) [57,59].
4.3. Specifying Phase
Following the modeling phase, taking the graphicalMES model as the input, an MES
specification as the output of the specifying phase is filled. The primary task of this phase is t
transform the information from the graphical models into a format that software can utilize. The
database tables are the platform for the MES specification. Different tables related to the four models
in the modeling phase are defined to represent the information in the graphical model. In this phase,
the transformation process is a mapping process, as the structure, content, and the relationship of the
tables were defined as a one-to-one mapping of the extended MES-ML metamodel. This phase can
be performed automatically by using a mapping tool that knows the relationship between the
metamodel of the extended MES-ML and the database tables.
In the following, the related logical entity-relationship diagrams (ERD) of the database are
presented using Crow’s Foot Notation. As the technical systems are modeled using different
hierarchies and the data points for collection can be assigned to each element in the plant model
(according to the meta model of MES-ML), two tables named “Location” and “LocationDataPoint”
are used to describe the plant model (Figure 4, left). The table “Location” contains attributes that are
identical to the hierarchy level of the plant metamodel with factory, area, plant, line, machine, and
aggregatebeing used to present the modeling elements on each hierarchy. The table
“LocationDataPoint” presents the data points on each element. The types and descriptions of the data
points can also be found with the attributes “DataPointType” and “DataPointDescription”. Besides
that, the attribute named “LocationLink” is made to indicate the relationship between a specific data
point and its host element. Similar to the plant model, the information in the process model can be
represented with two tables named “Process” and “ProcessDataPoint” (Figure 4, right). The name of
the modeling elements on each hierarchy level in the process model can be found in the “Process”
table. The type of the used process data points and their link to the process element can be described
with the attributes “DataPointType” and “ProcessLink.” Another table to indicate the correlation
between the plant model and the process model is also defined (Figure 4, middle). By using the two
attributes “ProcessLink” and “LocationLink” in the “LocationProcess” table, the link between the
processes and technical systems can be found.
Figure 3.Metamodel of the modeling language MES Modeling Language (MES-ML) [57,59].
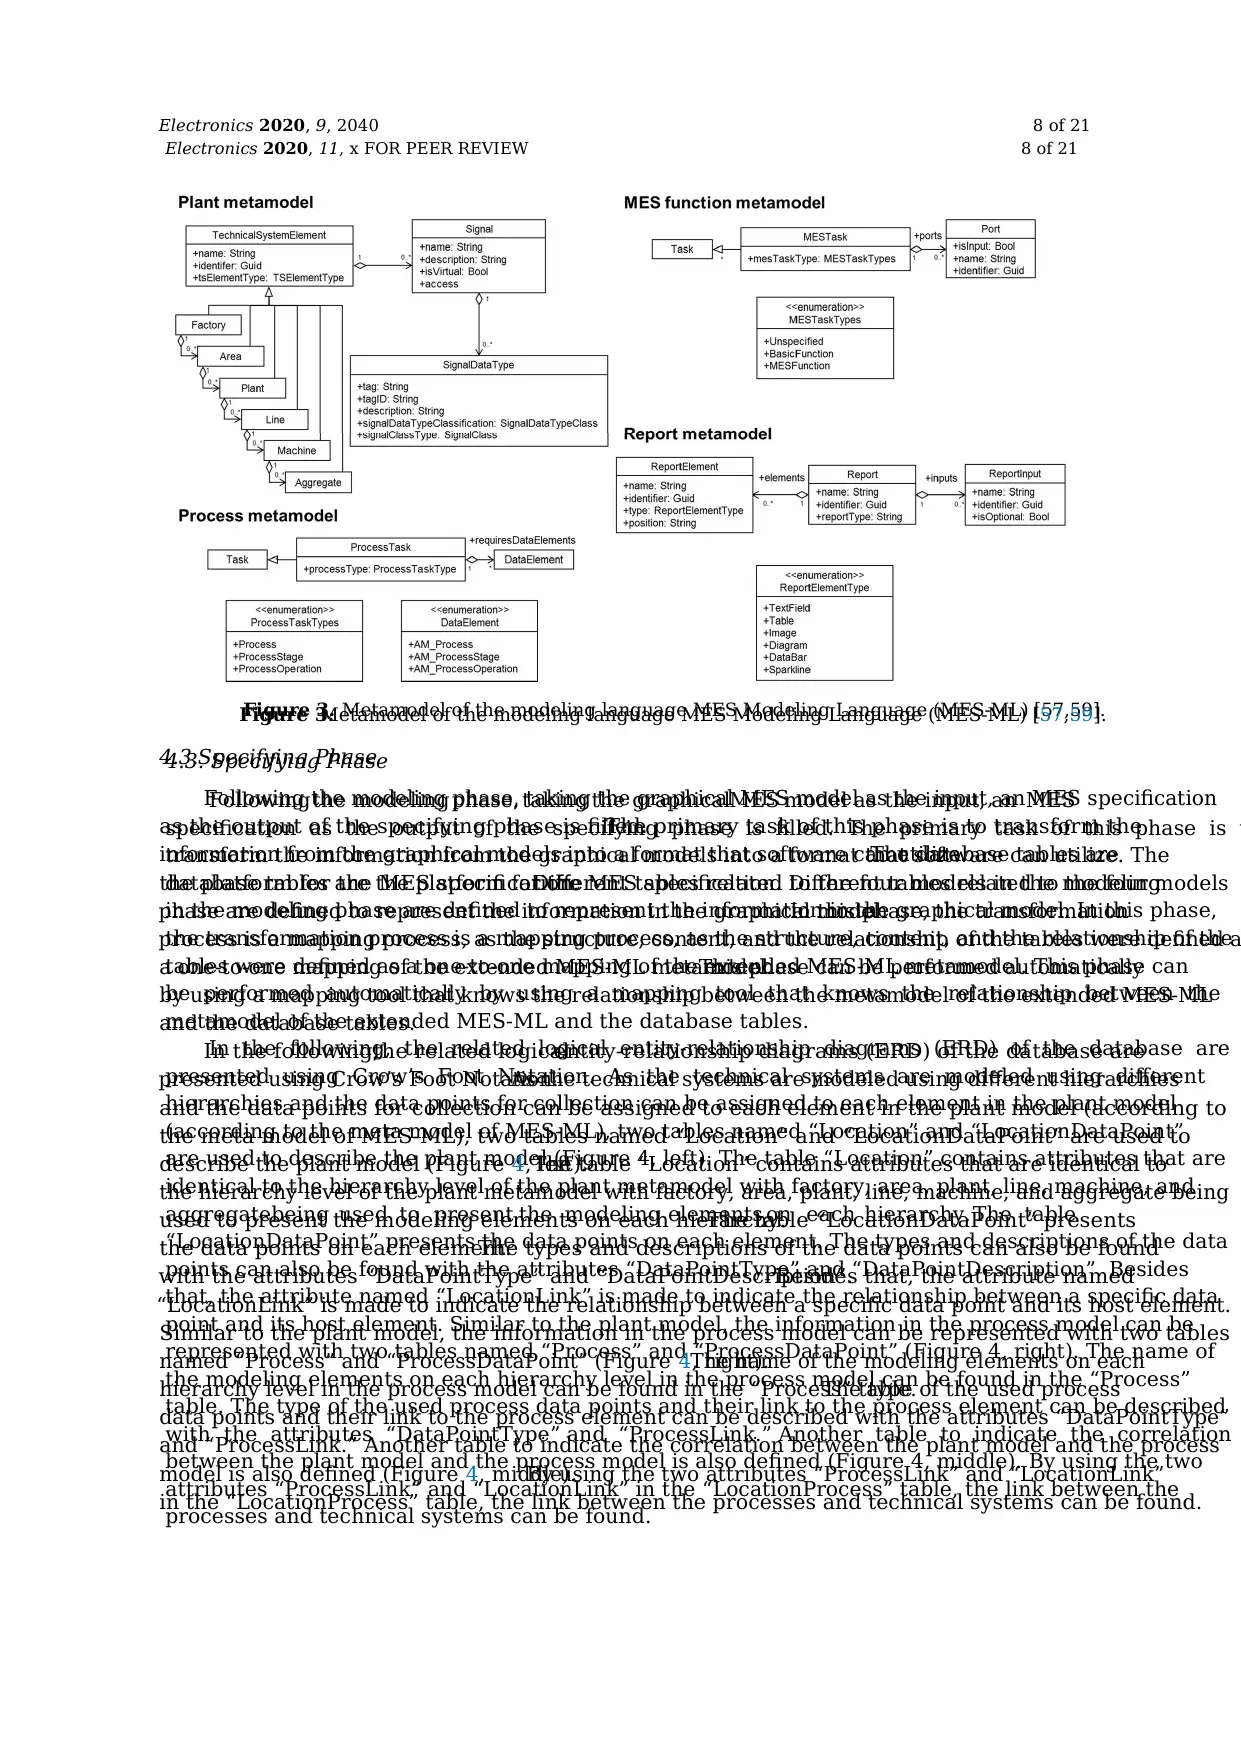
4.3.Specifying Phase
Following the modeling phase, taking the graphical MES model as the input, an MES specification
as the output of the specifying phase is filled.The primary task of this phase is to transform the
information from the graphical models into a format that software can utilize.The database tables are
the platform for the MES specification.Different tables related to the four models in the modeling
phase are defined to represent the information in the graphical model.In this phase, the transformation
process is a mapping process, as the structure, content, and the relationship of the tables were defined a
a one-to-one mapping of the extended MES-ML metamodel.This phase can be performed automatically
by using a mapping tool that knows the relationship between the metamodel of the extended MES-ML
and the database tables.
In the following,the related logicalentity-relationship diagrams (ERD) of the database are
presented using Crow’s Foot Notation.As the technical systems are modeled using different hierarchies
and the data points for collection can be assigned to each element in the plant model (according to
the meta model of MES-ML), two tables named “Location” and “LocationDataPoint” are used to
describe the plant model (Figure 4, left).The table “Location” contains attributes that are identical to
the hierarchy level of the plant metamodel with factory, area, plant, line, machine, and aggregate being
used to present the modeling elements on each hierarchy.The table “LocationDataPoint” presents
the data points on each element.The types and descriptions of the data points can also be found
with the attributes “DataPointType” and “DataPointDescription”.Besides that, the attribute named
“LocationLink” is made to indicate the relationship between a specific data point and its host element.
Similar to the plant model, the information in the process model can be represented with two tables
named “Process” and “ProcessDataPoint” (Figure 4, right).The name of the modeling elements on each
hierarchy level in the process model can be found in the “Process” table.The type of the used process
data points and their link to the process element can be described with the attributes “DataPointType”
and “ProcessLink.” Another table to indicate the correlation between the plant model and the process
model is also defined (Figure 4, middle).By using the two attributes “ProcessLink” and “LocationLink”
in the “LocationProcess” table, the link between the processes and technical systems can be found.
Electronics 2020, 11, x FOR PEER REVIEW 8 of 21
Figure 3. Metamodel of the modeling language MES Modeling Language (MES-ML) [57,59].
4.3. Specifying Phase
Following the modeling phase, taking the graphicalMES model as the input, an MES
specification as the output of the specifying phase is filled. The primary task of this phase is t
transform the information from the graphical models into a format that software can utilize. The
database tables are the platform for the MES specification. Different tables related to the four models
in the modeling phase are defined to represent the information in the graphical model. In this phase,
the transformation process is a mapping process, as the structure, content, and the relationship of the
tables were defined as a one-to-one mapping of the extended MES-ML metamodel. This phase can
be performed automatically by using a mapping tool that knows the relationship between the
metamodel of the extended MES-ML and the database tables.
In the following, the related logical entity-relationship diagrams (ERD) of the database are
presented using Crow’s Foot Notation. As the technical systems are modeled using different
hierarchies and the data points for collection can be assigned to each element in the plant model
(according to the meta model of MES-ML), two tables named “Location” and “LocationDataPoint”
are used to describe the plant model (Figure 4, left). The table “Location” contains attributes that are
identical to the hierarchy level of the plant metamodel with factory, area, plant, line, machine, and
aggregatebeing used to present the modeling elements on each hierarchy. The table
“LocationDataPoint” presents the data points on each element. The types and descriptions of the data
points can also be found with the attributes “DataPointType” and “DataPointDescription”. Besides
that, the attribute named “LocationLink” is made to indicate the relationship between a specific data
point and its host element. Similar to the plant model, the information in the process model can be
represented with two tables named “Process” and “ProcessDataPoint” (Figure 4, right). The name of
the modeling elements on each hierarchy level in the process model can be found in the “Process”
table. The type of the used process data points and their link to the process element can be described
with the attributes “DataPointType” and “ProcessLink.” Another table to indicate the correlation
between the plant model and the process model is also defined (Figure 4, middle). By using the two
attributes “ProcessLink” and “LocationLink” in the “LocationProcess” table, the link between the
processes and technical systems can be found.
Figure 3.Metamodel of the modeling language MES Modeling Language (MES-ML) [57,59].
4.3.Specifying Phase
Following the modeling phase, taking the graphical MES model as the input, an MES specification
as the output of the specifying phase is filled.The primary task of this phase is to transform the
information from the graphical models into a format that software can utilize.The database tables are
the platform for the MES specification.Different tables related to the four models in the modeling
phase are defined to represent the information in the graphical model.In this phase, the transformation
process is a mapping process, as the structure, content, and the relationship of the tables were defined a
a one-to-one mapping of the extended MES-ML metamodel.This phase can be performed automatically
by using a mapping tool that knows the relationship between the metamodel of the extended MES-ML
and the database tables.
In the following,the related logicalentity-relationship diagrams (ERD) of the database are
presented using Crow’s Foot Notation.As the technical systems are modeled using different hierarchies
and the data points for collection can be assigned to each element in the plant model (according to
the meta model of MES-ML), two tables named “Location” and “LocationDataPoint” are used to
describe the plant model (Figure 4, left).The table “Location” contains attributes that are identical to
the hierarchy level of the plant metamodel with factory, area, plant, line, machine, and aggregate being
used to present the modeling elements on each hierarchy.The table “LocationDataPoint” presents
the data points on each element.The types and descriptions of the data points can also be found
with the attributes “DataPointType” and “DataPointDescription”.Besides that, the attribute named
“LocationLink” is made to indicate the relationship between a specific data point and its host element.
Similar to the plant model, the information in the process model can be represented with two tables
named “Process” and “ProcessDataPoint” (Figure 4, right).The name of the modeling elements on each
hierarchy level in the process model can be found in the “Process” table.The type of the used process
data points and their link to the process element can be described with the attributes “DataPointType”
and “ProcessLink.” Another table to indicate the correlation between the plant model and the process
model is also defined (Figure 4, middle).By using the two attributes “ProcessLink” and “LocationLink”
in the “LocationProcess” table, the link between the processes and technical systems can be found.
Electronics 2020, 9, 2040 9 of 21
Electronics 2020, 11, x FOR PEER REVIEW 9 of 21
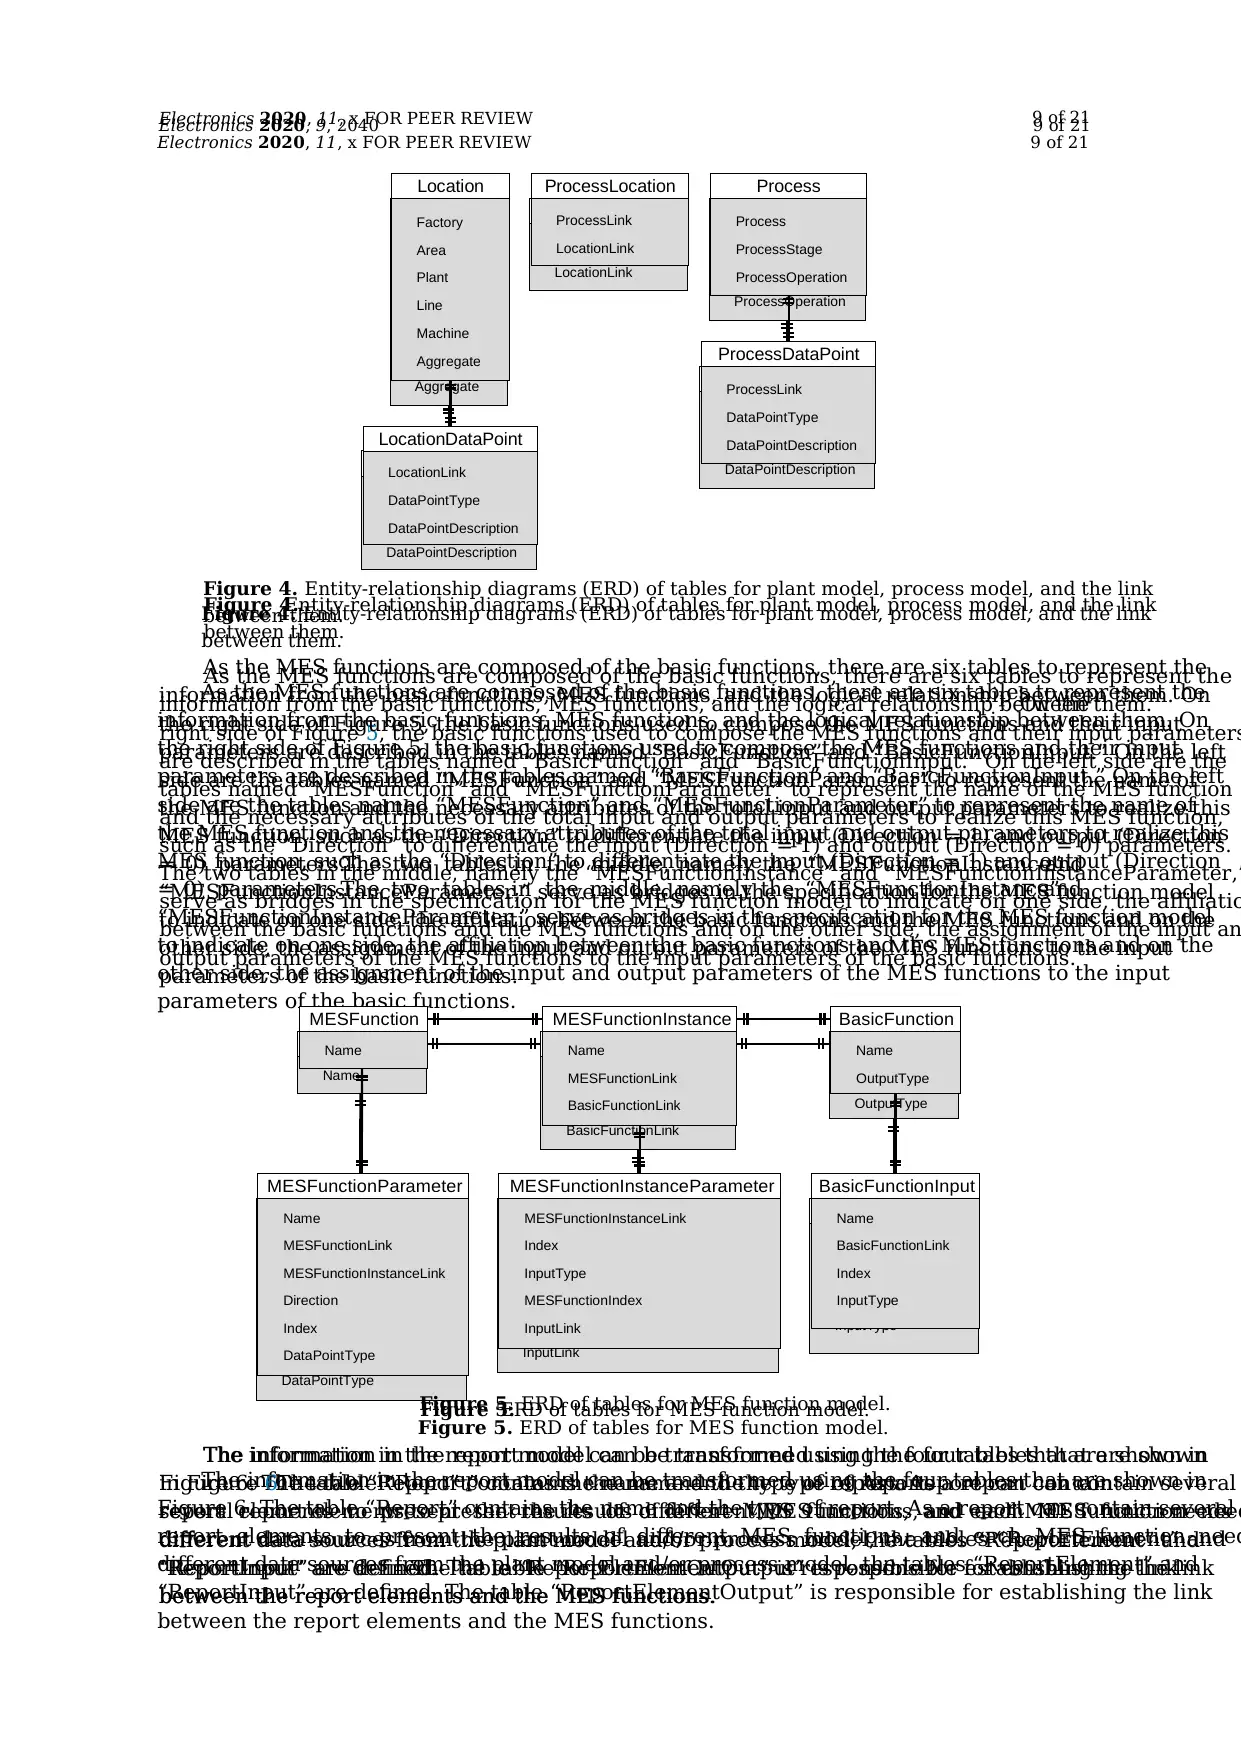
Figure 4. Entity-relationship diagrams (ERD) of tables for plant model, process model, and the link
between them.
As the MES functions are composed of the basic functions, there are six tables to represent the
information from the basic functions, MES functions, and the logical relationship between them. On
the right side of Figure 5, the basic functions used to compose the MES functions and their input
parameters are described in the tables named “BasicFunction” and “BasicFunctionInput.” On the left
side are the tables named “MESFunction” and “MESFunctionParameter” to represent the name of
the MES function and the necessary attributes of the total input and output parameters to realize this
MES function, such as the “Direction” to differentiate the input (Direction = 1) and output (Direction
= 0) parameters.The two tables in the middle, namely the “MESFunctionInstance”and
“MESFunctionInstanceParameter,” serve as bridges in the specification for the MES function model
to indicate on one side, the affiliation between the basic functions and the MES functions and on the
other side, the assignment of the input and output parameters of the MES functions to the input
parameters of the basic functions.
Figure 5. ERD of tables for MES function model.
The information in the report model can be transformed using the four tables that are shown in
Figure 6. The table “Report” contains the name and the type of report. As a report can contain several
report elements to present the results of different MES functions, and each MES function need
different data sources from the plant model and/or process model, the tables “ReportElement” and
“ReportInput” are defined. The table “ReportElementOutput” is responsible for establishing the link
between the report elements and the MES functions.
Factory
Area
Plant
Line
Machine
Aggregate
Location
LocationLink
DataPointType
DataPointDescription
LocationDataPoint
ProcessLink
LocationLink
ProcessLocation
Process
ProcessStage
ProcessOperation
Process
ProcessLink
DataPointType
DataPointDescription
ProcessDataPoint
Name
MESFunction
Name
MESFunctionLink
MESFunctionInstanceLink
Direction
Index
DataPointType
MESFunctionParameter
Name
MESFunctionLink
BasicFunctionLink
MESFunctionInstance
MESFunctionInstanceLink
Index
InputType
MESFunctionIndex
InputLink
MESFunctionInstanceParameter
Name
OutputType
BasicFunction
Name
BasicFunctionLink
Index
InputType
BasicFunctionInput
Figure 4.Entity-relationship diagrams (ERD) of tables for plant model, process model, and the link
between them.
As the MES functions are composed of the basic functions, there are six tables to represent the
information from the basic functions, MES functions, and the logical relationship between them.On the
right side of Figure 5, the basic functions used to compose the MES functions and their input parameters
are described in the tables named “BasicFunction” and “BasicFunctionInput.” On the left side are the
tables named “MESFunction” and “MESFunctionParameter” to represent the name of the MES function
and the necessary attributes of the total input and output parameters to realize this MES function,
such as the “Direction” to differentiate the input (Direction = 1) and output (Direction = 0) parameters.
The two tables in the middle, namely the “MESFunctionInstance” and “MESFunctionInstanceParameter,”
serve as bridges in the specification for the MES function model to indicate on one side, the affiliatio
between the basic functions and the MES functions and on the other side, the assignment of the input an
output parameters of the MES functions to the input parameters of the basic functions.
Electronics 2020, 11, x FOR PEER REVIEW 9 of 21
Figure 4. Entity-relationship diagrams (ERD) of tables for plant model, process model, and the link
between them.
As the MES functions are composed of the basic functions, there are six tables to represent the
information from the basic functions, MES functions, and the logical relationship between them. On
the right side of Figure 5, the basic functions used to compose the MES functions and their input
parameters are described in the tables named “BasicFunction” and “BasicFunctionInput.” On the left
side are the tables named “MESFunction” and “MESFunctionParameter” to represent the name of
the MES function and the necessary attributes of the total input and output parameters to realize this
MES function, such as the “Direction” to differentiate the input (Direction = 1) and output (Direction
= 0) parameters.The two tables in the middle, namely the “MESFunctionInstance”and
“MESFunctionInstanceParameter,” serve as bridges in the specification for the MES function model
to indicate on one side, the affiliation between the basic functions and the MES functions and on the
other side, the assignment of the input and output parameters of the MES functions to the input
parameters of the basic functions.
Figure 5. ERD of tables for MES function model.
The information in the report model can be transformed using the four tables that are shown in
Figure 6. The table “Report” contains the name and the type of report. As a report can contain several
report elements to present the results of different MES functions, and each MES function need
different data sources from the plant model and/or process model, the tables “ReportElement” and
“ReportInput” are defined. The table “ReportElementOutput” is responsible for establishing the link
between the report elements and the MES functions.
Factory
Area
Plant
Line
Machine
Aggregate
Location
LocationLink
DataPointType
DataPointDescription
LocationDataPoint
ProcessLink
LocationLink
ProcessLocation
Process
ProcessStage
ProcessOperation
Process
ProcessLink
DataPointType
DataPointDescription
ProcessDataPoint
Name
MESFunction
Name
MESFunctionLink
MESFunctionInstanceLink
Direction
Index
DataPointType
MESFunctionParameter
Name
MESFunctionLink
BasicFunctionLink
MESFunctionInstance
MESFunctionInstanceLink
Index
InputType
MESFunctionIndex
InputLink
MESFunctionInstanceParameter
Name
OutputType
BasicFunction
Name
BasicFunctionLink
Index
InputType
BasicFunctionInput
Figure 5.ERD of tables for MES function model.
The information in the report model can be transformed using the four tables that are shown
in Figure 6.The table “Report” contains the name and the type of report.As a report can contain
several report elements to present the results of different MES functions, and each MES function needs
different data sources from the plant model and/or process model, the tables “ReportElement” and
“ReportInput” are defined.The table “ReportElementOutput” is responsible for establishing the link
between the report elements and the MES functions.
Electronics 2020, 11, x FOR PEER REVIEW 9 of 21
Figure 4. Entity-relationship diagrams (ERD) of tables for plant model, process model, and the link
between them.
As the MES functions are composed of the basic functions, there are six tables to represent the
information from the basic functions, MES functions, and the logical relationship between them. On
the right side of Figure 5, the basic functions used to compose the MES functions and their input
parameters are described in the tables named “BasicFunction” and “BasicFunctionInput.” On the left
side are the tables named “MESFunction” and “MESFunctionParameter” to represent the name of
the MES function and the necessary attributes of the total input and output parameters to realize this
MES function, such as the “Direction” to differentiate the input (Direction = 1) and output (Direction
= 0) parameters.The two tables in the middle, namely the “MESFunctionInstance”and
“MESFunctionInstanceParameter,” serve as bridges in the specification for the MES function model
to indicate on one side, the affiliation between the basic functions and the MES functions and on the
other side, the assignment of the input and output parameters of the MES functions to the input
parameters of the basic functions.
Figure 5. ERD of tables for MES function model.
The information in the report model can be transformed using the four tables that are shown in
Figure 6. The table “Report” contains the name and the type of report. As a report can contain several
report elements to present the results of different MES functions, and each MES function need
different data sources from the plant model and/or process model, the tables “ReportElement” and
“ReportInput” are defined. The table “ReportElementOutput” is responsible for establishing the link
between the report elements and the MES functions.
Factory
Area
Plant
Line
Machine
Aggregate
Location
LocationLink
DataPointType
DataPointDescription
LocationDataPoint
ProcessLink
LocationLink
ProcessLocation
Process
ProcessStage
ProcessOperation
Process
ProcessLink
DataPointType
DataPointDescription
ProcessDataPoint
Name
MESFunction
Name
MESFunctionLink
MESFunctionInstanceLink
Direction
Index
DataPointType
MESFunctionParameter
Name
MESFunctionLink
BasicFunctionLink
MESFunctionInstance
MESFunctionInstanceLink
Index
InputType
MESFunctionIndex
InputLink
MESFunctionInstanceParameter
Name
OutputType
BasicFunction
Name
BasicFunctionLink
Index
InputType
BasicFunctionInput
Figure 4.Entity-relationship diagrams (ERD) of tables for plant model, process model, and the link
between them.
As the MES functions are composed of the basic functions, there are six tables to represent the
information from the basic functions, MES functions, and the logical relationship between them.On the
right side of Figure 5, the basic functions used to compose the MES functions and their input parameters
are described in the tables named “BasicFunction” and “BasicFunctionInput.” On the left side are the
tables named “MESFunction” and “MESFunctionParameter” to represent the name of the MES function
and the necessary attributes of the total input and output parameters to realize this MES function,
such as the “Direction” to differentiate the input (Direction = 1) and output (Direction = 0) parameters.
The two tables in the middle, namely the “MESFunctionInstance” and “MESFunctionInstanceParameter,”
serve as bridges in the specification for the MES function model to indicate on one side, the affiliatio
between the basic functions and the MES functions and on the other side, the assignment of the input an
output parameters of the MES functions to the input parameters of the basic functions.
Electronics 2020, 11, x FOR PEER REVIEW 9 of 21
Figure 4. Entity-relationship diagrams (ERD) of tables for plant model, process model, and the link
between them.
As the MES functions are composed of the basic functions, there are six tables to represent the
information from the basic functions, MES functions, and the logical relationship between them. On
the right side of Figure 5, the basic functions used to compose the MES functions and their input
parameters are described in the tables named “BasicFunction” and “BasicFunctionInput.” On the left
side are the tables named “MESFunction” and “MESFunctionParameter” to represent the name of
the MES function and the necessary attributes of the total input and output parameters to realize this
MES function, such as the “Direction” to differentiate the input (Direction = 1) and output (Direction
= 0) parameters.The two tables in the middle, namely the “MESFunctionInstance”and
“MESFunctionInstanceParameter,” serve as bridges in the specification for the MES function model
to indicate on one side, the affiliation between the basic functions and the MES functions and on the
other side, the assignment of the input and output parameters of the MES functions to the input
parameters of the basic functions.
Figure 5. ERD of tables for MES function model.
The information in the report model can be transformed using the four tables that are shown in
Figure 6. The table “Report” contains the name and the type of report. As a report can contain several
report elements to present the results of different MES functions, and each MES function need
different data sources from the plant model and/or process model, the tables “ReportElement” and
“ReportInput” are defined. The table “ReportElementOutput” is responsible for establishing the link
between the report elements and the MES functions.
Factory
Area
Plant
Line
Machine
Aggregate
Location
LocationLink
DataPointType
DataPointDescription
LocationDataPoint
ProcessLink
LocationLink
ProcessLocation
Process
ProcessStage
ProcessOperation
Process
ProcessLink
DataPointType
DataPointDescription
ProcessDataPoint
Name
MESFunction
Name
MESFunctionLink
MESFunctionInstanceLink
Direction
Index
DataPointType
MESFunctionParameter
Name
MESFunctionLink
BasicFunctionLink
MESFunctionInstance
MESFunctionInstanceLink
Index
InputType
MESFunctionIndex
InputLink
MESFunctionInstanceParameter
Name
OutputType
BasicFunction
Name
BasicFunctionLink
Index
InputType
BasicFunctionInput
Figure 5.ERD of tables for MES function model.
The information in the report model can be transformed using the four tables that are shown
in Figure 6.The table “Report” contains the name and the type of report.As a report can contain
several report elements to present the results of different MES functions, and each MES function needs
different data sources from the plant model and/or process model, the tables “ReportElement” and
“ReportInput” are defined.The table “ReportElementOutput” is responsible for establishing the link
between the report elements and the MES functions.
⊘ This is a preview!⊘
Do you want full access?
Subscribe today to unlock all pages.
Trusted by 1+ million students worldwide
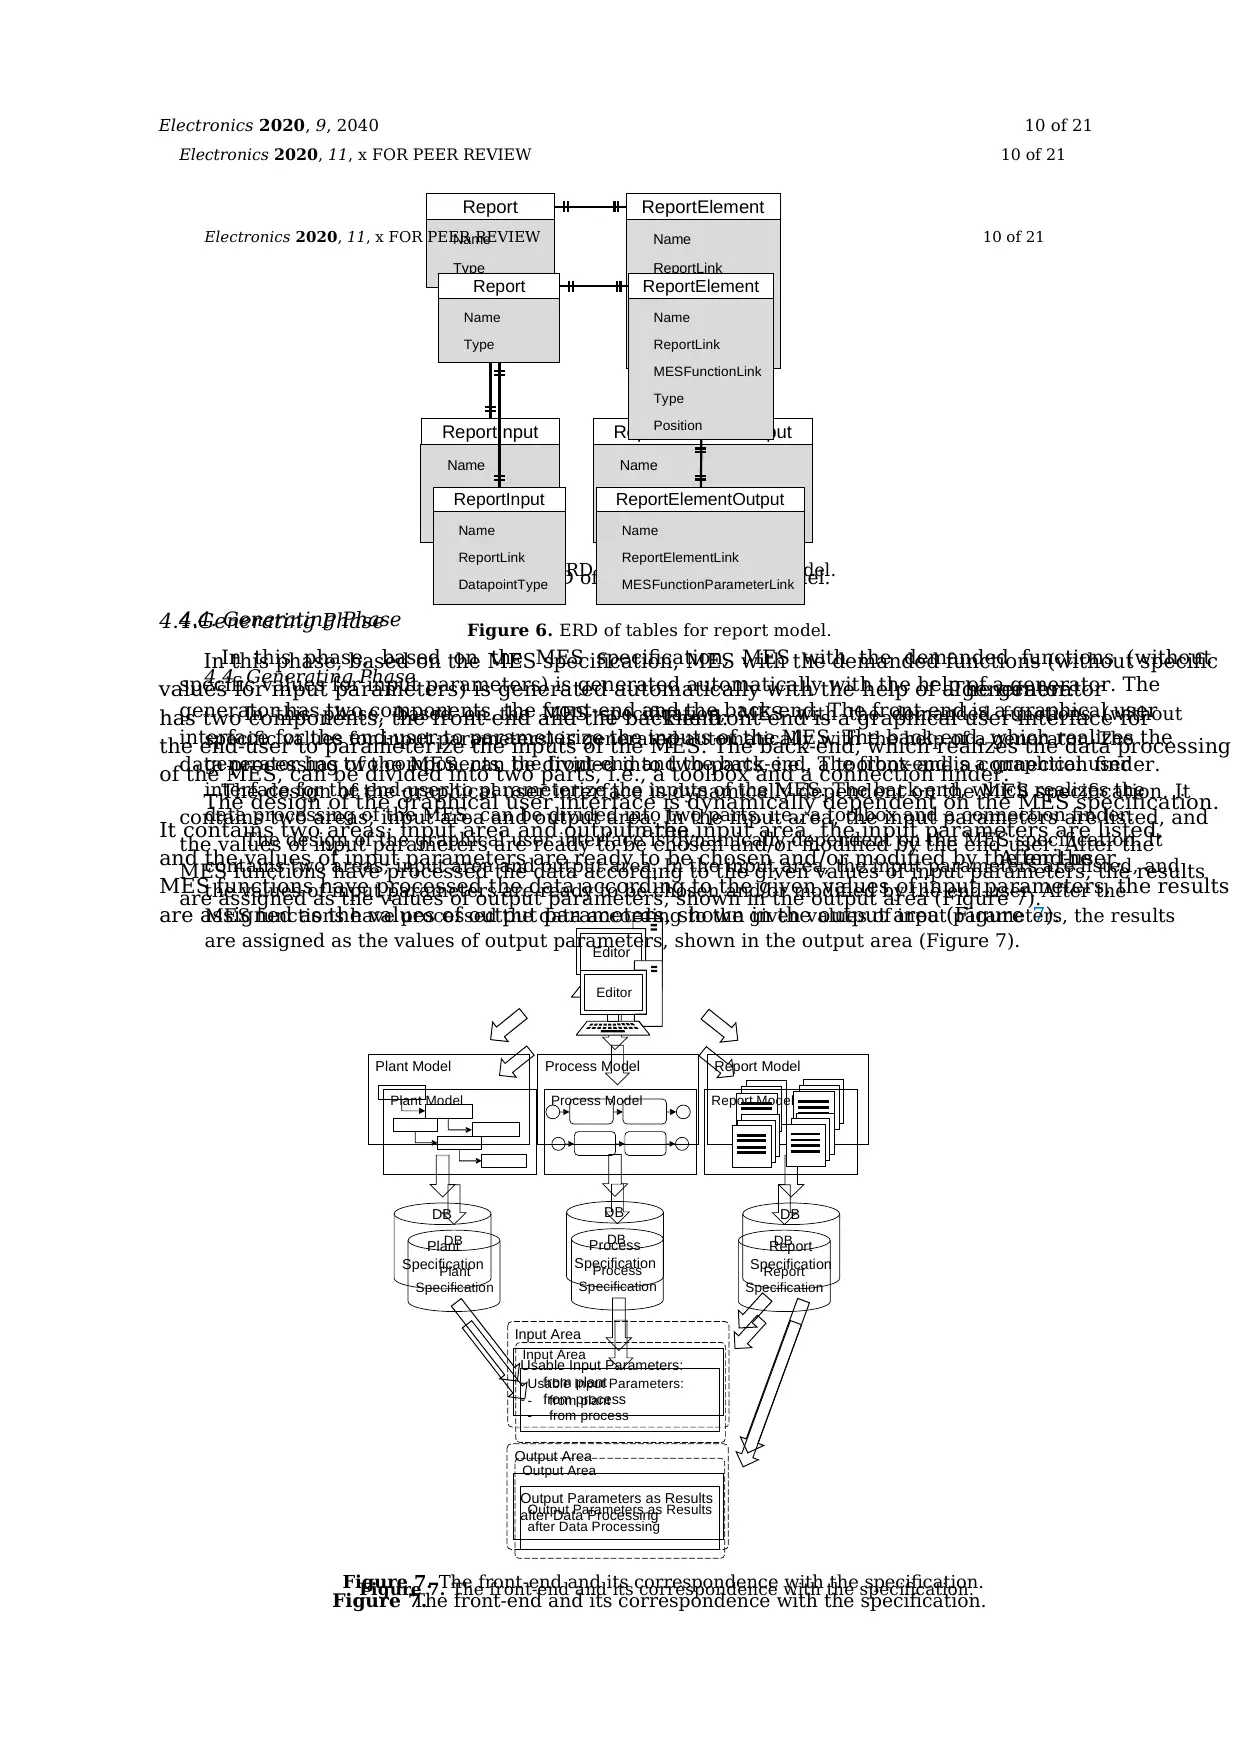
Electronics 2020, 9, 2040 10 of 21
Electronics 2020, 11, x FOR PEER REVIEW 10 of 21
Figure 6. ERD of tables for report model.
4.4. Generating Phase
In this phase, based on the MES specification, MES with the demanded functions (without
specific values for input parameters) is generated automatically with the help of a generator. The
generator has two components, the front-end and the back-end. The front-end is a graphical user
interface for the end-user to parameterize the inputs of the MES. The back-end, which realizes the
data processing of the MES, can be divided into two parts, i.e., a toolbox and a connection finder.
The design of the graphical user interface is dynamically dependent on the MES specification. It
contains two areas; input area and output area. In the input area, the input parameters are listed, and
the values of input parameters are ready to be chosen and/or modified by the end-user. After the
MES functions have processed the data according to the given values of input parameters, the results
are assigned as the values of output parameters, shown in the output area (Figure 7).
Figure 7. The front-end and its correspondence with the specification.
Name
ReportLink
MESFunctionLink
Type
Position
ReportElement
Name
Type
Report
Name
ReportLink
DatapointType
ReportInput
Name
ReportElementLink
MESFunctionParameterLink
ReportElementOutput
Process ModelPlant Model Report Model
Plant
Specification
DB
Process
Specification
DB
Report
Specification
DB
Input Area
Output Area
Usable Input Parameters:
- from plant
- from process
Output Parameters as Results
after Data Processing
Editor
Figure 6.ERD of tables for report model.
4.4.Generating Phase
In this phase, based on the MES specification, MES with the demanded functions (without specific
values for input parameters) is generated automatically with the help of a generator.The generator
has two components, the front-end and the back-end.The front-end is a graphical user interface for
the end-user to parameterize the inputs of the MES. The back-end, which realizes the data processing
of the MES, can be divided into two parts, i.e., a toolbox and a connection finder.
The design of the graphical user interface is dynamically dependent on the MES specification.
It contains two areas; input area and output area.In the input area, the input parameters are listed,
and the values of input parameters are ready to be chosen and/or modified by the end-user.After the
MES functions have processed the data according to the given values of input parameters, the results
are assigned as the values of output parameters, shown in the output area (Figure 7).
Electronics 2020, 11, x FOR PEER REVIEW 10 of 21
Figure 6. ERD of tables for report model.
4.4. Generating Phase
In this phase, based on the MES specification, MES with the demanded functions (without
specific values for input parameters) is generated automatically with the help of a generator. The
generator has two components, the front-end and the back-end. The front-end is a graphical user
interface for the end-user to parameterize the inputs of the MES. The back-end, which realizes the
data processing of the MES, can be divided into two parts, i.e., a toolbox and a connection finder.
The design of the graphical user interface is dynamically dependent on the MES specification. It
contains two areas; input area and output area. In the input area, the input parameters are listed, and
the values of input parameters are ready to be chosen and/or modified by the end-user. After the
MES functions have processed the data according to the given values of input parameters, the results
are assigned as the values of output parameters, shown in the output area (Figure 7).
Figure 7. The front-end and its correspondence with the specification.
Name
ReportLink
MESFunctionLink
Type
Position
ReportElement
Name
Type
Report
Name
ReportLink
DatapointType
ReportInput
Name
ReportElementLink
MESFunctionParameterLink
ReportElementOutput
Process ModelPlant Model Report Model
Plant
Specification
DB
Process
Specification
DB
Report
Specification
DB
Input Area
Output Area
Usable Input Parameters:
- from plant
- from process
Output Parameters as Results
after Data Processing
Editor
Figure 7.The front-end and its correspondence with the specification.
Electronics 2020, 11, x FOR PEER REVIEW 10 of 21
Figure 6. ERD of tables for report model.
4.4. Generating Phase
In this phase, based on the MES specification, MES with the demanded functions (without
specific values for input parameters) is generated automatically with the help of a generator. The
generator has two components, the front-end and the back-end. The front-end is a graphical user
interface for the end-user to parameterize the inputs of the MES. The back-end, which realizes the
data processing of the MES, can be divided into two parts, i.e., a toolbox and a connection finder.
The design of the graphical user interface is dynamically dependent on the MES specification. It
contains two areas; input area and output area. In the input area, the input parameters are listed, and
the values of input parameters are ready to be chosen and/or modified by the end-user. After the
MES functions have processed the data according to the given values of input parameters, the results
are assigned as the values of output parameters, shown in the output area (Figure 7).
Figure 7. The front-end and its correspondence with the specification.
Name
ReportLink
MESFunctionLink
Type
Position
ReportElement
Name
Type
Report
Name
ReportLink
DatapointType
ReportInput
Name
ReportElementLink
MESFunctionParameterLink
ReportElementOutput
Process ModelPlant Model Report Model
Plant
Specification
DB
Process
Specification
DB
Report
Specification
DB
Input Area
Output Area
Usable Input Parameters:
- from plant
- from process
Output Parameters as Results
after Data Processing
Editor
Figure 6.ERD of tables for report model.
4.4.Generating Phase
In this phase, based on the MES specification, MES with the demanded functions (without specific
values for input parameters) is generated automatically with the help of a generator.The generator
has two components, the front-end and the back-end.The front-end is a graphical user interface for
the end-user to parameterize the inputs of the MES. The back-end, which realizes the data processing
of the MES, can be divided into two parts, i.e., a toolbox and a connection finder.
The design of the graphical user interface is dynamically dependent on the MES specification.
It contains two areas; input area and output area.In the input area, the input parameters are listed,
and the values of input parameters are ready to be chosen and/or modified by the end-user.After the
MES functions have processed the data according to the given values of input parameters, the results
are assigned as the values of output parameters, shown in the output area (Figure 7).
Electronics 2020, 11, x FOR PEER REVIEW 10 of 21
Figure 6. ERD of tables for report model.
4.4. Generating Phase
In this phase, based on the MES specification, MES with the demanded functions (without
specific values for input parameters) is generated automatically with the help of a generator. The
generator has two components, the front-end and the back-end. The front-end is a graphical user
interface for the end-user to parameterize the inputs of the MES. The back-end, which realizes the
data processing of the MES, can be divided into two parts, i.e., a toolbox and a connection finder.
The design of the graphical user interface is dynamically dependent on the MES specification. It
contains two areas; input area and output area. In the input area, the input parameters are listed, and
the values of input parameters are ready to be chosen and/or modified by the end-user. After the
MES functions have processed the data according to the given values of input parameters, the results
are assigned as the values of output parameters, shown in the output area (Figure 7).
Figure 7. The front-end and its correspondence with the specification.
Name
ReportLink
MESFunctionLink
Type
Position
ReportElement
Name
Type
Report
Name
ReportLink
DatapointType
ReportInput
Name
ReportElementLink
MESFunctionParameterLink
ReportElementOutput
Process ModelPlant Model Report Model
Plant
Specification
DB
Process
Specification
DB
Report
Specification
DB
Input Area
Output Area
Usable Input Parameters:
- from plant
- from process
Output Parameters as Results
after Data Processing
Editor
Figure 7.The front-end and its correspondence with the specification.
Paraphrase This Document
Need a fresh take? Get an instant paraphrase of this document with our AI Paraphraser
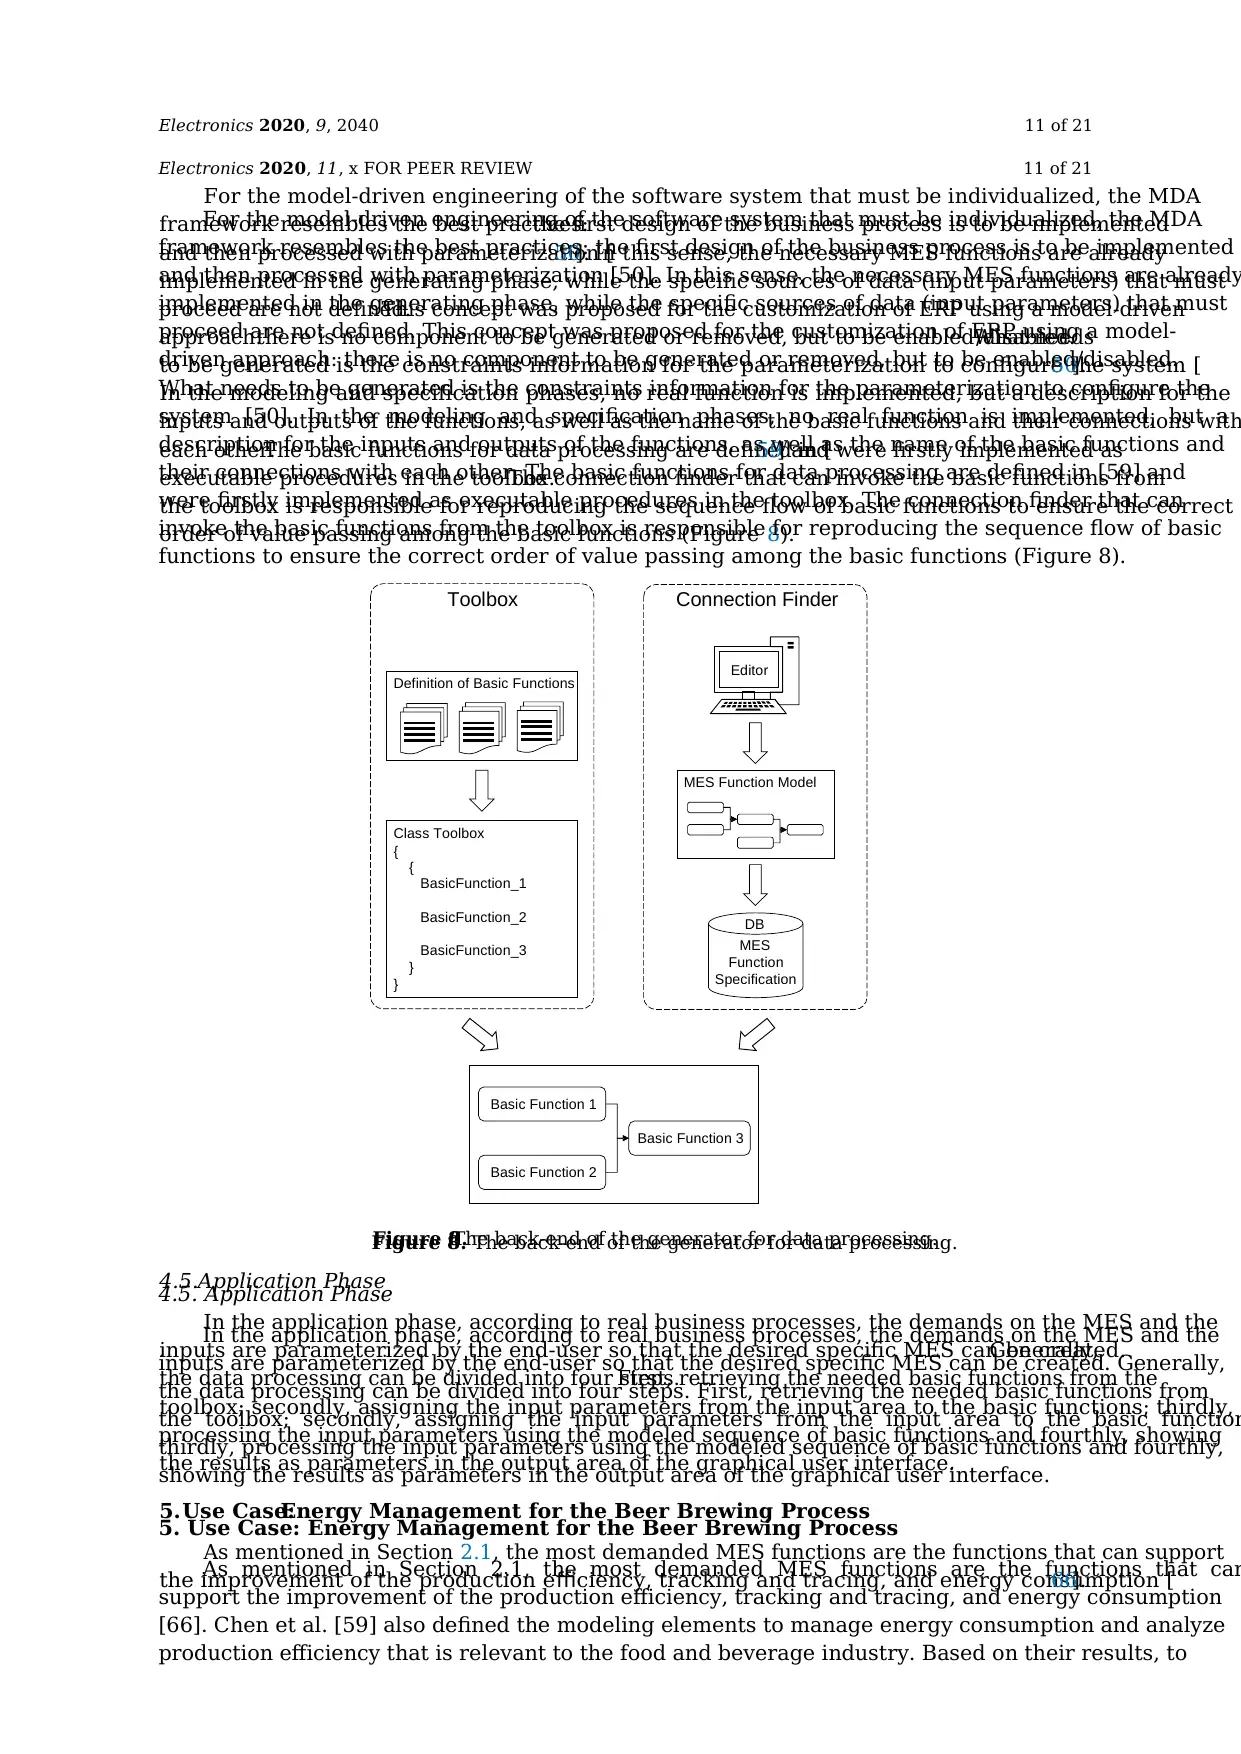
Electronics 2020, 9, 2040 11 of 21
For the model-driven engineering of the software system that must be individualized, the MDA
framework resembles the best practices:the first design of the business process is to be implemented
and then processed with parameterization [50]. In this sense, the necessary MES functions are already
implemented in the generating phase, while the specific sources of data (input parameters) that must
proceed are not defined.This concept was proposed for the customization of ERP using a model-driven
approach:there is no component to be generated or removed, but to be enabled/disabled.What needs
to be generated is the constraints information for the parameterization to configure the system [50].
In the modeling and specification phases, no real function is implemented, but a description for the
inputs and outputs of the functions, as well as the name of the basic functions and their connections with
each other.The basic functions for data processing are defined in [59] and were firstly implemented as
executable procedures in the toolbox.The connection finder that can invoke the basic functions from
the toolbox is responsible for reproducing the sequence flow of basic functions to ensure the correct
order of value passing among the basic functions (Figure 8).
Electronics 2020, 11, x FOR PEER REVIEW 11 of 21
For the model-driven engineering of the software system that must be individualized, the MDA
framework resembles the best practices: the first design of the business process is to be implemented
and then processed with parameterization [50]. In this sense, the necessary MES functions are already
implemented in the generating phase, while the specific sources of data (input parameters) that must
proceed are not defined. This concept was proposed for the customization of ERP using a model-
driven approach: there is no component to be generated or removed, but to be enabled/disabled.
What needs to be generated is the constraints information for the parameterization to configure the
system [50]. In the modeling and specification phases, no real function is implemented, but a
description for the inputs and outputs of the functions, as well as the name of the basic functions and
their connections with each other. The basic functions for data processing are defined in [59] and
were firstly implemented as executable procedures in the toolbox. The connection finder that can
invoke the basic functions from the toolbox is responsible for reproducing the sequence flow of basic
functions to ensure the correct order of value passing among the basic functions (Figure 8).
Figure 8. The back-end of the generator for data processing.
4.5. Application Phase
In the application phase, according to real business processes, the demands on the MES and the
inputs are parameterized by the end-user so that the desired specific MES can be created. Generally,
the data processing can be divided into four steps. First, retrieving the needed basic functions from
the toolbox; secondly, assigning the input parameters from the input area to the basic function
thirdly, processing the input parameters using the modeled sequence of basic functions and fourthly,
showing the results as parameters in the output area of the graphical user interface.
5. Use Case: Energy Management for the Beer Brewing Process
As mentioned in Section 2.1, the most demanded MES functions are the functions that can
support the improvement of the production efficiency, tracking and tracing, and energy consumption
[66]. Chen et al. [59] also defined the modeling elements to manage energy consumption and analyze
production efficiency that is relevant to the food and beverage industry. Based on their results, to
Basic Function 1
Basic Function 2
Basic Function 3
Definition of Basic Functions
Class Toolbox
{
{
BasicFunction_1
BasicFunction_2
BasicFunction_3
}
}
Toolbox
MES
Function
Specification
DB
MES Function Model
Connection Finder
Editor
Figure 8.The back-end of the generator for data processing.
4.5.Application Phase
In the application phase, according to real business processes, the demands on the MES and the
inputs are parameterized by the end-user so that the desired specific MES can be created.Generally,
the data processing can be divided into four steps.First, retrieving the needed basic functions from the
toolbox; secondly, assigning the input parameters from the input area to the basic functions; thirdly,
processing the input parameters using the modeled sequence of basic functions and fourthly, showing
the results as parameters in the output area of the graphical user interface.
5.Use Case:Energy Management for the Beer Brewing Process
As mentioned in Section 2.1, the most demanded MES functions are the functions that can support
the improvement of the production efficiency, tracking and tracing, and energy consumption [66].
For the model-driven engineering of the software system that must be individualized, the MDA
framework resembles the best practices:the first design of the business process is to be implemented
and then processed with parameterization [50]. In this sense, the necessary MES functions are already
implemented in the generating phase, while the specific sources of data (input parameters) that must
proceed are not defined.This concept was proposed for the customization of ERP using a model-driven
approach:there is no component to be generated or removed, but to be enabled/disabled.What needs
to be generated is the constraints information for the parameterization to configure the system [50].
In the modeling and specification phases, no real function is implemented, but a description for the
inputs and outputs of the functions, as well as the name of the basic functions and their connections with
each other.The basic functions for data processing are defined in [59] and were firstly implemented as
executable procedures in the toolbox.The connection finder that can invoke the basic functions from
the toolbox is responsible for reproducing the sequence flow of basic functions to ensure the correct
order of value passing among the basic functions (Figure 8).
Electronics 2020, 11, x FOR PEER REVIEW 11 of 21
For the model-driven engineering of the software system that must be individualized, the MDA
framework resembles the best practices: the first design of the business process is to be implemented
and then processed with parameterization [50]. In this sense, the necessary MES functions are already
implemented in the generating phase, while the specific sources of data (input parameters) that must
proceed are not defined. This concept was proposed for the customization of ERP using a model-
driven approach: there is no component to be generated or removed, but to be enabled/disabled.
What needs to be generated is the constraints information for the parameterization to configure the
system [50]. In the modeling and specification phases, no real function is implemented, but a
description for the inputs and outputs of the functions, as well as the name of the basic functions and
their connections with each other. The basic functions for data processing are defined in [59] and
were firstly implemented as executable procedures in the toolbox. The connection finder that can
invoke the basic functions from the toolbox is responsible for reproducing the sequence flow of basic
functions to ensure the correct order of value passing among the basic functions (Figure 8).
Figure 8. The back-end of the generator for data processing.
4.5. Application Phase
In the application phase, according to real business processes, the demands on the MES and the
inputs are parameterized by the end-user so that the desired specific MES can be created. Generally,
the data processing can be divided into four steps. First, retrieving the needed basic functions from
the toolbox; secondly, assigning the input parameters from the input area to the basic function
thirdly, processing the input parameters using the modeled sequence of basic functions and fourthly,
showing the results as parameters in the output area of the graphical user interface.
5. Use Case: Energy Management for the Beer Brewing Process
As mentioned in Section 2.1, the most demanded MES functions are the functions that can
support the improvement of the production efficiency, tracking and tracing, and energy consumption
[66]. Chen et al. [59] also defined the modeling elements to manage energy consumption and analyze
production efficiency that is relevant to the food and beverage industry. Based on their results, to
Basic Function 1
Basic Function 2
Basic Function 3
Definition of Basic Functions
Class Toolbox
{
{
BasicFunction_1
BasicFunction_2
BasicFunction_3
}
}
Toolbox
MES
Function
Specification
DB
MES Function Model
Connection Finder
Editor
Figure 8.The back-end of the generator for data processing.
4.5.Application Phase
In the application phase, according to real business processes, the demands on the MES and the
inputs are parameterized by the end-user so that the desired specific MES can be created.Generally,
the data processing can be divided into four steps.First, retrieving the needed basic functions from the
toolbox; secondly, assigning the input parameters from the input area to the basic functions; thirdly,
processing the input parameters using the modeled sequence of basic functions and fourthly, showing
the results as parameters in the output area of the graphical user interface.
5.Use Case:Energy Management for the Beer Brewing Process
As mentioned in Section 2.1, the most demanded MES functions are the functions that can support
the improvement of the production efficiency, tracking and tracing, and energy consumption [66].

Electronics 2020, 9, 2040 12 of 21
Chen et al.[59] also defined the modeling elements to manage energy consumption and analyze
production efficiency that is relevant to the food and beverage industry.Based on their results,
to evaluate the feasibility of the presented approach and the achievement of the requirements defined
in Section 3, the approach was applied to the traditional brewing process in a fictitious brewhouse.
This brewhouse provides the basis of the technical systems and production process that the generated
MES is built for, and data for processing.The brewing process was chosen as it is a representative
production type (batch process) in the food and beverage industry.Figure 9 illustrates the traditional
brewing process in the brewhouse.
Electronics 2020, 11, x FOR PEER REVIEW 12 of 21
evaluate the feasibility of the presented approach and the achievement of the requirements defined
in Section 3, the approach was applied to the traditional brewing process in a fictitious brewhouse.
This brewhouse provides the basis of the technical systems and production process that the generated
MES is built for, and data for processing. The brewing process was chosen as it is a representative
production type (batch process) in the food and beverage industry. Figure 9 illustrates the traditional
brewing process in the brewhouse.
Figure 9. Traditional brewing process in the brewhouse.
In the brewhouse, to produce the wort for fermentation, malted barley, water, and hops are
needed as raw materials. The malt and water are mixed and heated to specific temperature fo
extracting in the mash tun. The separation of the liquid phase (wort) from the grains is performed in
the lauter tun. The wort kettle boils the worttogether with hops for their sterilization and
isomerization. Solid particles in wort, such as hops and proteins, are precipitated and separated at
the bottom of the whirlpool. After that, the wort is cooled down and is ready for fermentation and
storage in the fermentation room [67].
5.1. Analyzing the Demands and Actual State
As the brewhouse is the main energy consumer of the whole brewery, namely 38% of tota
energy consumption [68,69], and the energy used in a brewhouse can be divided into two primary
units, thermal energy, and electrical energy, each for 10.2–11.4 kWh/hl (hectoliter) SB (sales beer) and
0.84–2.3 kWh/hl SB in average [70,71], the targeted MES should focus on the management of the
thermal energy in this use case. The wort kettle and the mash tun are the consumers of the thermal
energy in the brewhouse, taking the share of 77.1% and 22.9% [70]. According to the data above, the
consumption data of the brewery with a designed annual beer production volume of 200,000 hl are
shown in Table 1. The consumption data with the data point defined in WS (WS_Cons_Steam) were
stored in a database for the period from 2019.01.01 00:00:00 to 2019.12.31 23:59:59.
Table 1. Thermal energy consumption data of the consumers in the brewhouse.
Energy
Consumer
Thermal Energy Consumption from
the Literature on Average
Consumption per
Year
Consumption per
Second
Mash Tun 2.48 kWh/hl SB 496 MWh 0.02 kWh
Wort Kettle 8.32 kWh/hl SB 1664 MWh 0.07 kWh
5.2. Modeling the MES
The components in this use case were modeled in an editor that supports the extended MES-ML
presented in [57,58]. The modeling elements that were defined in [59] were used. The production line
in the brewery includes the mash tun, lauter tun, wort kettle, whirlpool, and heat exchanger. As
mentioned above, the related data points for the energy data were assigned to the technical systems
in the plant model. Figure 10 shows the model of the technical systems with a detailed view of the
data point assigned to the mash tun.
Wort
Mash Tun Lauter Tun Wort Kettle Whirlpool
Hops
Malt & Water
Figure 9.Traditional brewing process in the brewhouse.
In the brewhouse, to produce the wort for fermentation, malted barley, water, and hops are needed
as raw materials.The malt and water are mixed and heated to specific temperature for extracting
in the mash tun.The separation of the liquid phase (wort) from the grains is performed in the
lauter tun.The wort kettle boils the wort together with hops for their sterilization and isomerization.
Solid particles in wort, such as hops and proteins, are precipitated and separated at the bottom of
the whirlpool.After that, the wort is cooled down and is ready for fermentation and storage in the
fermentation room [67].
5.1.Analyzing the Demands and Actual State
As the brewhouse is the main energy consumer of the whole brewery,namely 38% of total
energy consumption [68,69], and the energy used in a brewhouse can be divided into two primary
units, thermal energy, and electrical energy, each for 10.2–11.4 kWh/hl (hectoliter) SB (sales beer) and
0.84–2.3 kWh/hl SB in average [70,71], the targeted MES should focus on the management of the
thermal energy in this use case.The wort kettle and the mash tun are the consumers of the thermal
energy in the brewhouse,taking the share of 77.1% and 22.9% [70]. According to the data above,
the consumption data of the brewery with a designed annual beer production volume of 200,000 hl are
shown in Table 1.The consumption data with the data point defined in WS (WS_Cons_Steam) were
stored in a database for the period from 1 January 2019 00:00:00 to 31 December 2019 23:59:59.
Table 1.Thermal energy consumption data of the consumers in the brewhouse.
Energy Consumer Thermal Energy Consumption
from the Literature on Average
Consumption per YearConsumption per Second
Mash Tun 2.48 kWh/hl SB 496 MWh 0.02 kWh
Wort Kettle 8.32 kWh/hl SB 1664 MWh 0.07 kWh
5.2.Modeling the MES
The components in this use case were modeled in an editor that supports the extended MES-ML
presented in [57,58]. The modeling elements that were defined in [59] were used.The production
line in the brewery includes the mash tun,lauter tun,wort kettle,whirlpool,and heat exchanger.
As mentioned above, the related data points for the energy data were assigned to the technical systems
⊘ This is a preview!⊘
Do you want full access?
Subscribe today to unlock all pages.
Trusted by 1+ million students worldwide
1 out of 21
Related Documents


Your All-in-One AI-Powered Toolkit for Academic Success.
+13062052269
info@desklib.com
Available 24*7 on WhatsApp / Email
![[object Object]](/_next/static/media/star-bottom.7253800d.svg)
Unlock your academic potential
Copyright © 2020–2026 A2Z Services. All Rights Reserved. Developed and managed by ZUCOL.