In-depth Financial Statement Analysis Report: Metcash Limited
VerifiedAdded on 2023/06/03
|24
|6487
|479
Report
AI Summary
This report provides a comprehensive financial analysis of Metcash Limited, an Australian company distributing various consumable products. It includes detailed forecasting models applied to the company's financial statements, valuation models, sensitivity analysis, and management decision considerations. The analysis covers sales growth, asset turnover ratio, profit margin, dividend payout ratio, cost of debt, and cost of equity to determine the Weighted Average Cost of Capital (WACC). Valuation is performed using Discounted Dividend Model, Residual Income Model (RIM), Residual Operating Income Model (ROIM), and Free Cash Flow (FCF) methods. Sensitivity analysis is conducted on key assumptions like sales growth, ATO, and PM. The report also offers management consulting advice, highlighting potential opportunities and challenges for sales. Ultimately, the analysis aims to provide recommendations regarding investment levels in Metcash based on its financial performance and strategic decisions.
Running Head: Financial Statement Analysis
1
Project Report: Financial Statement Analysis
1
Project Report: Financial Statement Analysis
Paraphrase This Document
Need a fresh take? Get an instant paraphrase of this document with our AI Paraphraser
Financial Statement Analysis
2
Contents
Introduction...................................................................................................................3
Company overview........................................................................................................3
Assumptions.................................................................................................................. 3
Forecasting................................................................................................................... 3
Sales growth.................................................................................................................4
Asset turnover ratio.......................................................................................................6
Profit margin.................................................................................................................. 7
Dividend payout ratio....................................................................................................8
Cost of debt...................................................................................................................9
Cost of equity................................................................................................................ 9
WACC......................................................................................................................... 10
Valuation..................................................................................................................... 10
Discounted dividend model.........................................................................................11
RIM............................................................................................................................. 11
ROIM........................................................................................................................... 11
FCF............................................................................................................................. 12
Sensitivity analysis......................................................................................................12
Sales growth............................................................................................................... 12
ATO............................................................................................................................. 12
PM............................................................................................................................... 13
Dividend payout.......................................................................................................... 13
NBC............................................................................................................................ 13
Management consulting advice...................................................................................14
Potential opportunity for sales.....................................................................................14
Financial Statement Analysis
3
Potential challenges for sales......................................................................................14
Analysis and recommendation....................................................................................14
Conclusion.................................................................................................................. 15
References.................................................................................................................. 16
Appendix..................................................................................................................... 17
⊘ This is a preview!⊘
Do you want full access?
Subscribe today to unlock all pages.
Trusted by 1+ million students worldwide
Financial Statement Analysis
4
Introduction:
Metcash is an Australian company which distributes and markets the fresh products,
groceries, hardware, beverages and other consumable products. A financial analyst is
required to focus on the past and present financial data of the business in order to identify
that how would be the financial performance of the business so that a better decision could
be made about the strategies and other policies of the business. The financial analysis study
makes it easy for investors to get the real information and forecasting of the performance of
the business so that the investment decision could be made accordingly. A strategic decision
could be made on the basis of the financial performance and it leads the manager to a clear
conclusion (Madura, 2014). In the report, the financial analysis study has been performed on
Metcash. The forecasting models have been applied firstly on the financial statement of the
company in order to, along with that, the valuation model, sensitivity analysis and
management decision process has been studied to measure the overall position of the
company and make a recommendation about the investment level in the business.
Assumptions:
In order to forecast the future performance of a business, it is important for an analyst
to take each and every financial and non financial aspect of the business in context. It is
important for the analyst to forecast the other factors first and then make a decision about
the ultimate item. Such as, in case of measuring the forecasted profit margin level of the
business, it has been found that the analyst requires to forecasted sales and expenses of
the business first. By linking each of the forecasting items, it becomes easy for the analyst
and the investors to reach over a conclusion immediately.
Forecasting:
Forecasting is a process which takes the concern on the previous year figures and
the present factors of the business to measure about the future changes in a business. It is
important for a business to measure all the relevant changes and make the decision about
the forecasting accordingly.
Sales growth:
Sales growth is one of the most important factors to measure and evaluate in order to
find the future changes and performance of a business. There are various factors which
could influence the sales level of the Metcash such as foos demands, liquor demand,
inflation rate, GDP etc. During the financial year 2017, the sales growth of the comapny was
highest because of strong sells in the liquor and acquisition of the hardware company.
Paraphrase This Document
Need a fresh take? Get an instant paraphrase of this document with our AI Paraphraser
Financial Statement Analysis
5
Though, in the year of 2018, the growth rate has been decreased because the Metcash hard
competition in the food sector with Woolworths, Wesfarmers and Aldi and inflation rate has
also affected the sales of the business.
Food:
The food sales of Metcash limited has been reduced by 1.4% because of the prices
cut by Woolworths and Coles. The food sales of Metcash has also been affected because of
the Darkes Supermarket, who is one of the largest client of Metcash because of the lower
demand from the market. However, few changes have been made by Metcash limited to
improve the demand and turnover of food. The store of Metcash has deleted 6000 products
from the warehouse and added 2900 new products to attract more customers. Ready meals
are also offered by the company in order to improve the sales of the business.
Liquor:
Liquors are provided by Metcash limited in two divisions which are Independent
brand Australia and Australian liquor markets. The reports explain that the demand of liquor
has been increased to 5.7%. because of the acquisition of Porters liquor. Metcash limited
has also various opportunities which could improve the sales at huge level in near future
such as provide premium products, improvement in the wholesale sales, sales through IBA
network etc.
Hardware:
In case of Hardware performance, the demand of Metcash limited has been
improved at great extent. The changes have taken place because of the synergies. The
forecasting level explains that in near future, the hardware sales would be improved more.
Metcash limited could grab the various opportunities such as it could support independent
retailers, reduce the wholesale price etc to improve the demand of products.
Logistics:
the logistic demand would be improved along with the changes in the market and the
changes in the sustainable growth and cost structure of Metcash limited.
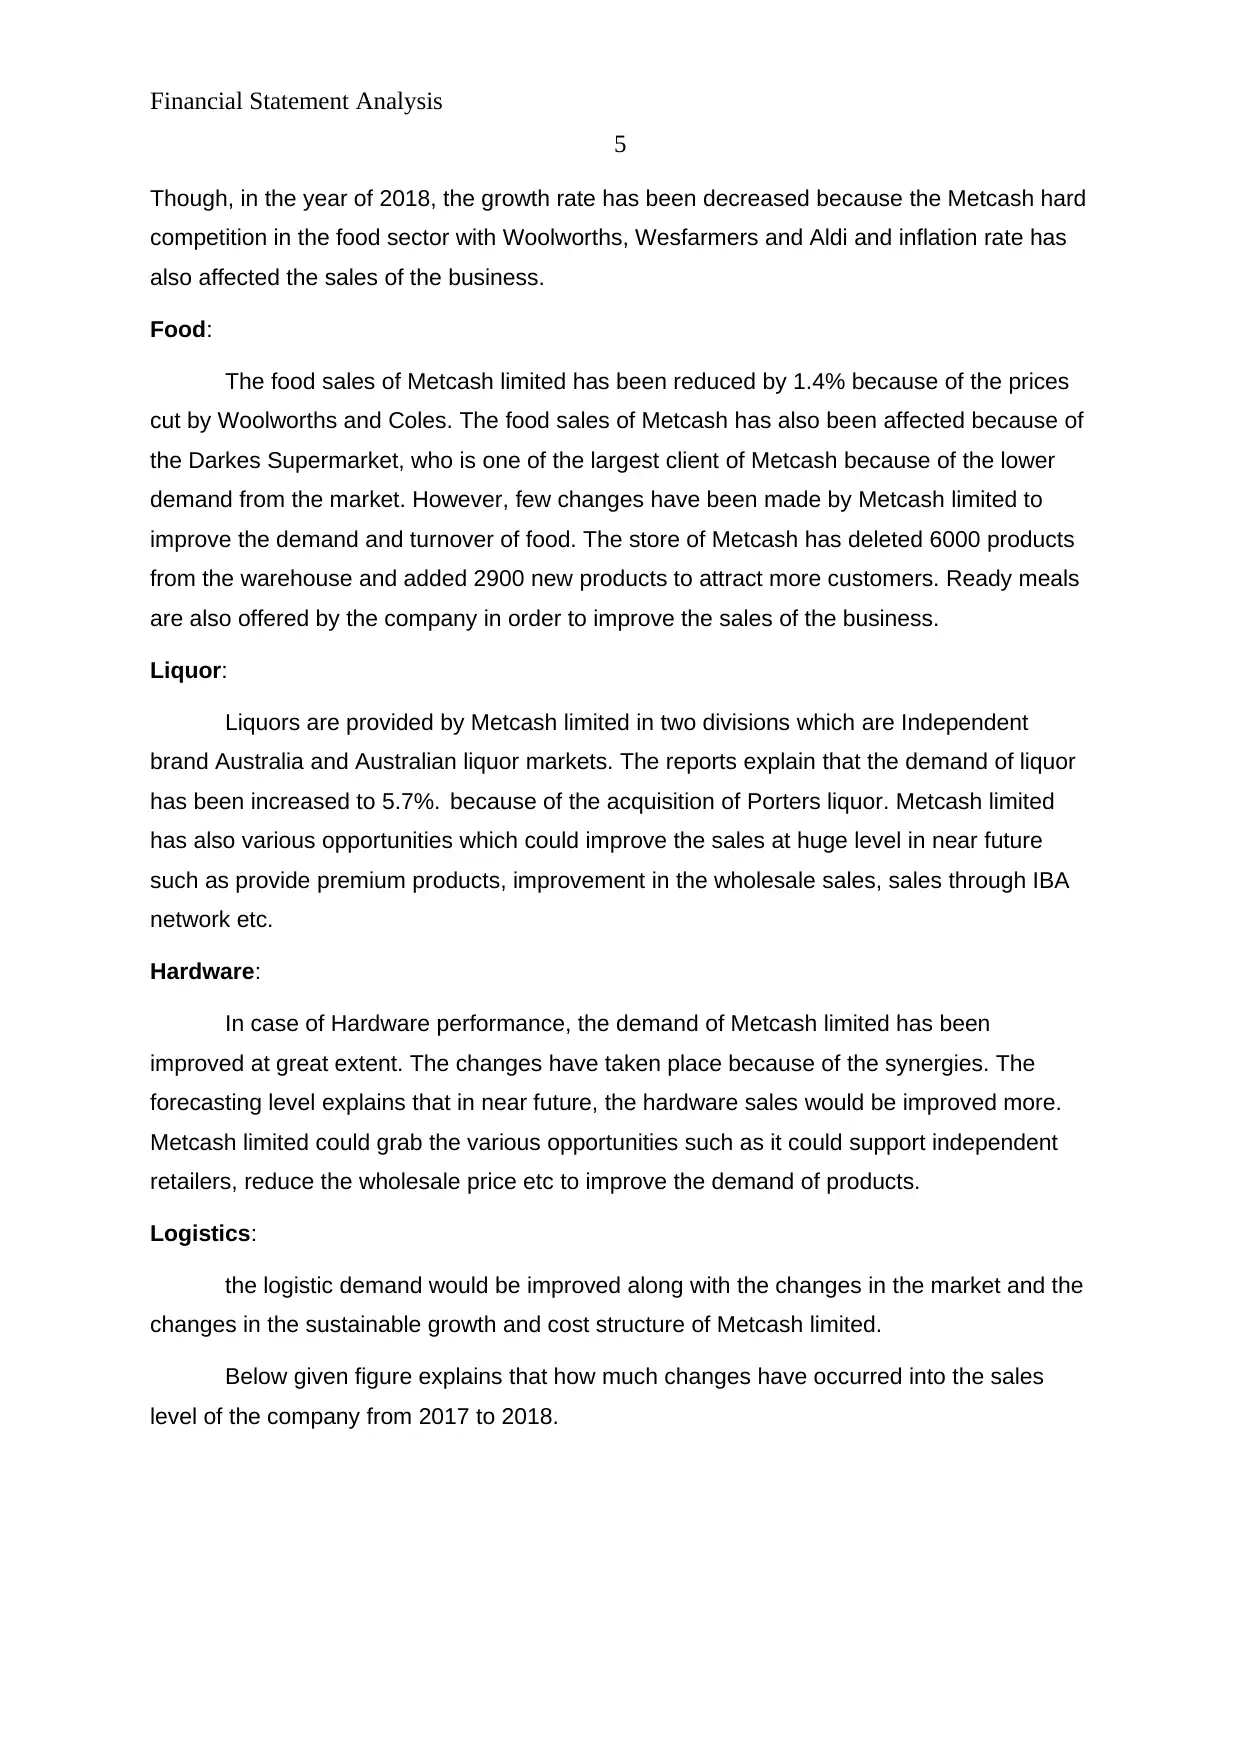
Below given figure explains that how much changes have occurred into the sales
level of the company from 2017 to 2018.
5
Though, in the year of 2018, the growth rate has been decreased because the Metcash hard
competition in the food sector with Woolworths, Wesfarmers and Aldi and inflation rate has
also affected the sales of the business.
Food:
The food sales of Metcash limited has been reduced by 1.4% because of the prices
cut by Woolworths and Coles. The food sales of Metcash has also been affected because of
the Darkes Supermarket, who is one of the largest client of Metcash because of the lower
demand from the market. However, few changes have been made by Metcash limited to
improve the demand and turnover of food. The store of Metcash has deleted 6000 products
from the warehouse and added 2900 new products to attract more customers. Ready meals
are also offered by the company in order to improve the sales of the business.
Liquor:
Liquors are provided by Metcash limited in two divisions which are Independent
brand Australia and Australian liquor markets. The reports explain that the demand of liquor
has been increased to 5.7%. because of the acquisition of Porters liquor. Metcash limited
has also various opportunities which could improve the sales at huge level in near future
such as provide premium products, improvement in the wholesale sales, sales through IBA
network etc.
Hardware:
In case of Hardware performance, the demand of Metcash limited has been
improved at great extent. The changes have taken place because of the synergies. The
forecasting level explains that in near future, the hardware sales would be improved more.
Metcash limited could grab the various opportunities such as it could support independent
retailers, reduce the wholesale price etc to improve the demand of products.
Logistics:
the logistic demand would be improved along with the changes in the market and the
changes in the sustainable growth and cost structure of Metcash limited.
Below given figure explains that how much changes have occurred into the sales
level of the company from 2017 to 2018.
Financial Statement Analysis
6
Resultsoverviewbypillar
FY18 FY17 %
$m $m Change
Sales revenue
Food 8,899.6 9,011.4 (1.2%)
Liquor 3,465.5 3,278.5 5.7%
Hardware1 2,098.6 1,578.5 33.0%
Total sales revenue (52 trading weeks) 14,463.7 13,868.4 4.3%
53rd trading week - 253.5 -
Total sales revenue 14,463.7 14,121.9 2.4%
EBIT2
Food3 188.6 188.1 0.3%
Liquor 68.4 67.0 2.1%
Sales revenue (%)
14%
Food
62%
Liquor 24%
Hardware
EBIT (%)
21%
Hardware4 69.0 48.5 42.3%
Business Pillars 326.0 303.6 7.4%
Food
Liquor 58%
Corporate5 6.7 1.2 -
Total EBIT 332.7 304.8 9.2%
21%
Hardware
Figure 1: Sales overview
(Yahoo finance, 2018)
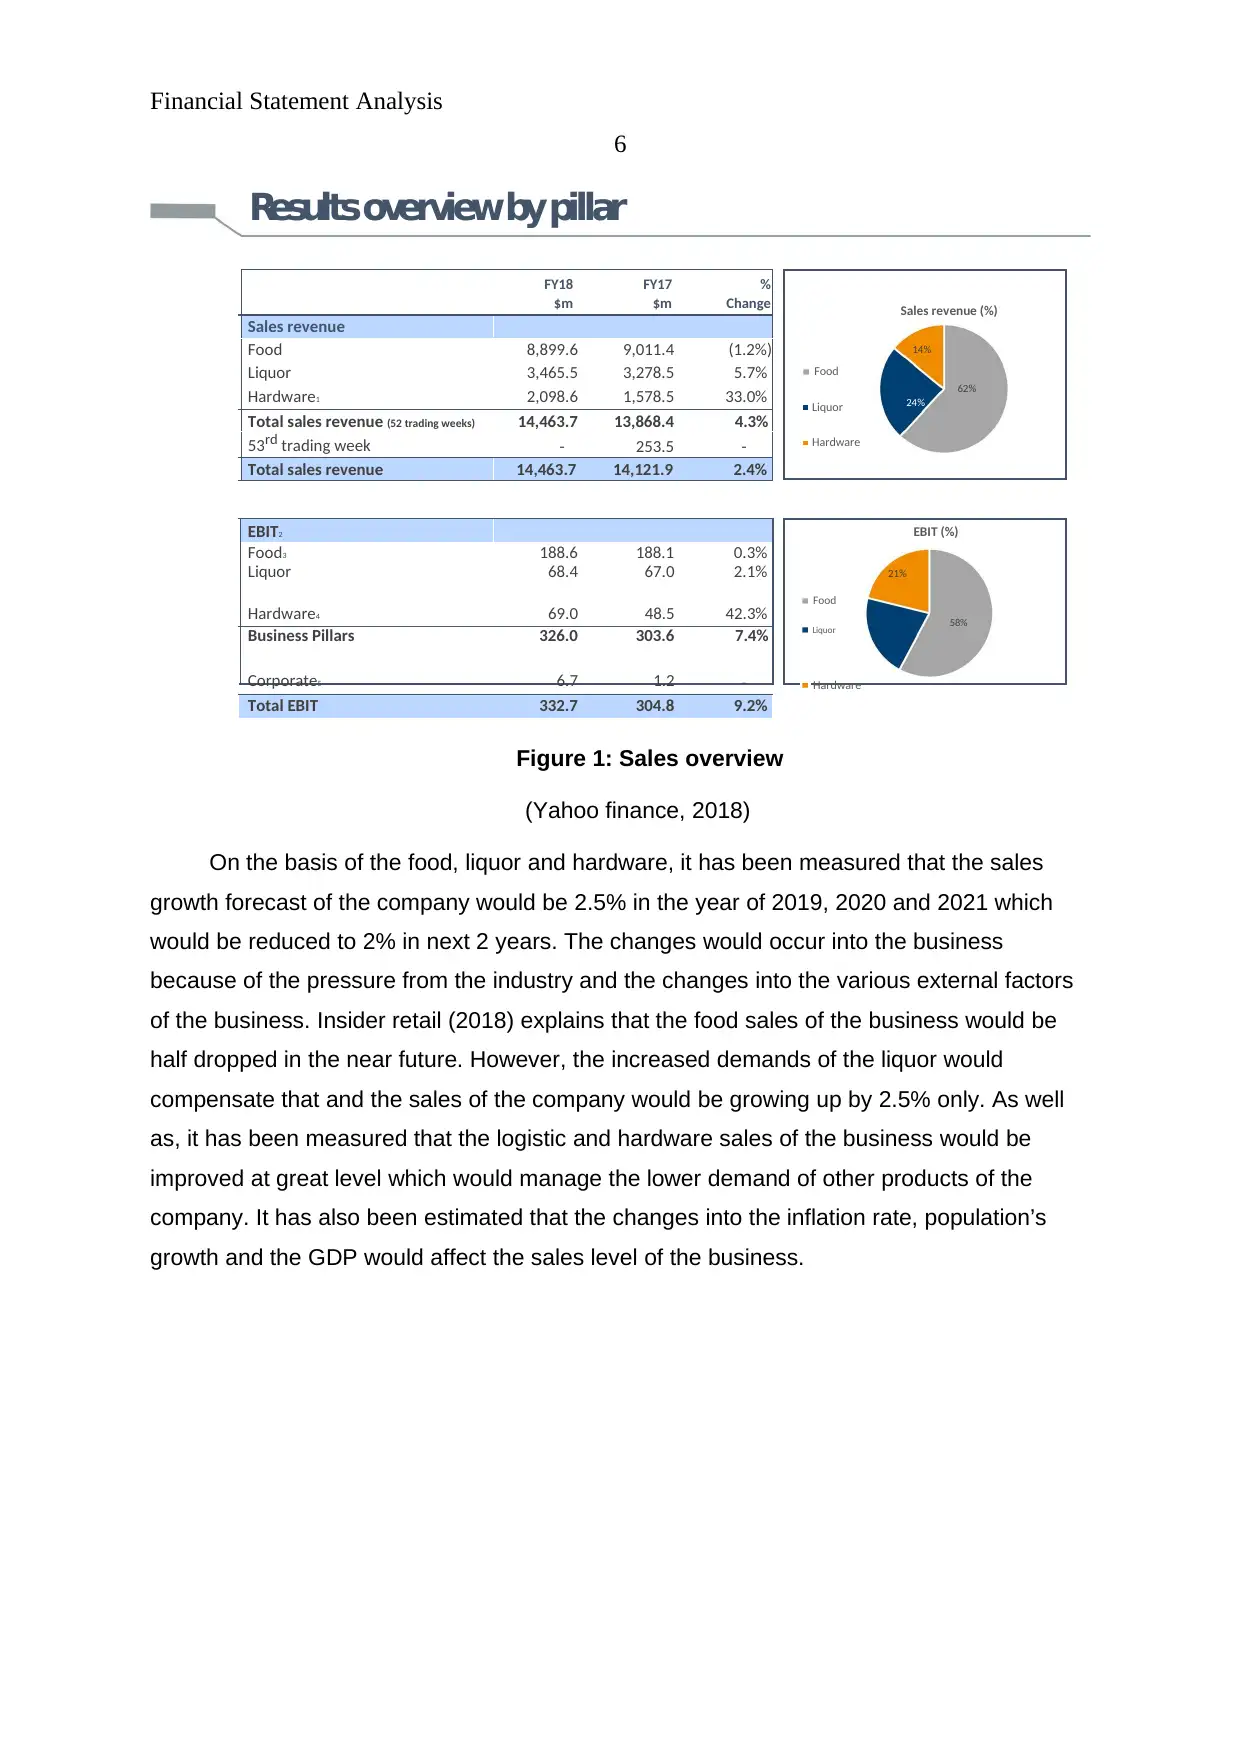
On the basis of the food, liquor and hardware, it has been measured that the sales
growth forecast of the company would be 2.5% in the year of 2019, 2020 and 2021 which
would be reduced to 2% in next 2 years. The changes would occur into the business
because of the pressure from the industry and the changes into the various external factors
of the business. Insider retail (2018) explains that the food sales of the business would be
half dropped in the near future. However, the increased demands of the liquor would
compensate that and the sales of the company would be growing up by 2.5% only. As well
as, it has been measured that the logistic and hardware sales of the business would be
improved at great level which would manage the lower demand of other products of the
company. It has also been estimated that the changes into the inflation rate, population’s
growth and the GDP would affect the sales level of the business.
6
Resultsoverviewbypillar
FY18 FY17 %
$m $m Change
Sales revenue
Food 8,899.6 9,011.4 (1.2%)
Liquor 3,465.5 3,278.5 5.7%
Hardware1 2,098.6 1,578.5 33.0%
Total sales revenue (52 trading weeks) 14,463.7 13,868.4 4.3%
53rd trading week - 253.5 -
Total sales revenue 14,463.7 14,121.9 2.4%
EBIT2
Food3 188.6 188.1 0.3%
Liquor 68.4 67.0 2.1%
Sales revenue (%)
14%
Food
62%
Liquor 24%
Hardware
EBIT (%)
21%
Hardware4 69.0 48.5 42.3%
Business Pillars 326.0 303.6 7.4%
Food
Liquor 58%
Corporate5 6.7 1.2 -
Total EBIT 332.7 304.8 9.2%
21%
Hardware
Figure 1: Sales overview
(Yahoo finance, 2018)
On the basis of the food, liquor and hardware, it has been measured that the sales
growth forecast of the company would be 2.5% in the year of 2019, 2020 and 2021 which
would be reduced to 2% in next 2 years. The changes would occur into the business
because of the pressure from the industry and the changes into the various external factors
of the business. Insider retail (2018) explains that the food sales of the business would be
half dropped in the near future. However, the increased demands of the liquor would
compensate that and the sales of the company would be growing up by 2.5% only. As well
as, it has been measured that the logistic and hardware sales of the business would be
improved at great level which would manage the lower demand of other products of the
company. It has also been estimated that the changes into the inflation rate, population’s
growth and the GDP would affect the sales level of the business.
⊘ This is a preview!⊘
Do you want full access?
Subscribe today to unlock all pages.
Trusted by 1+ million students worldwide
Financial Statement Analysis
7
Figure 2: Sales growth rate
(Insider retail, 2018)
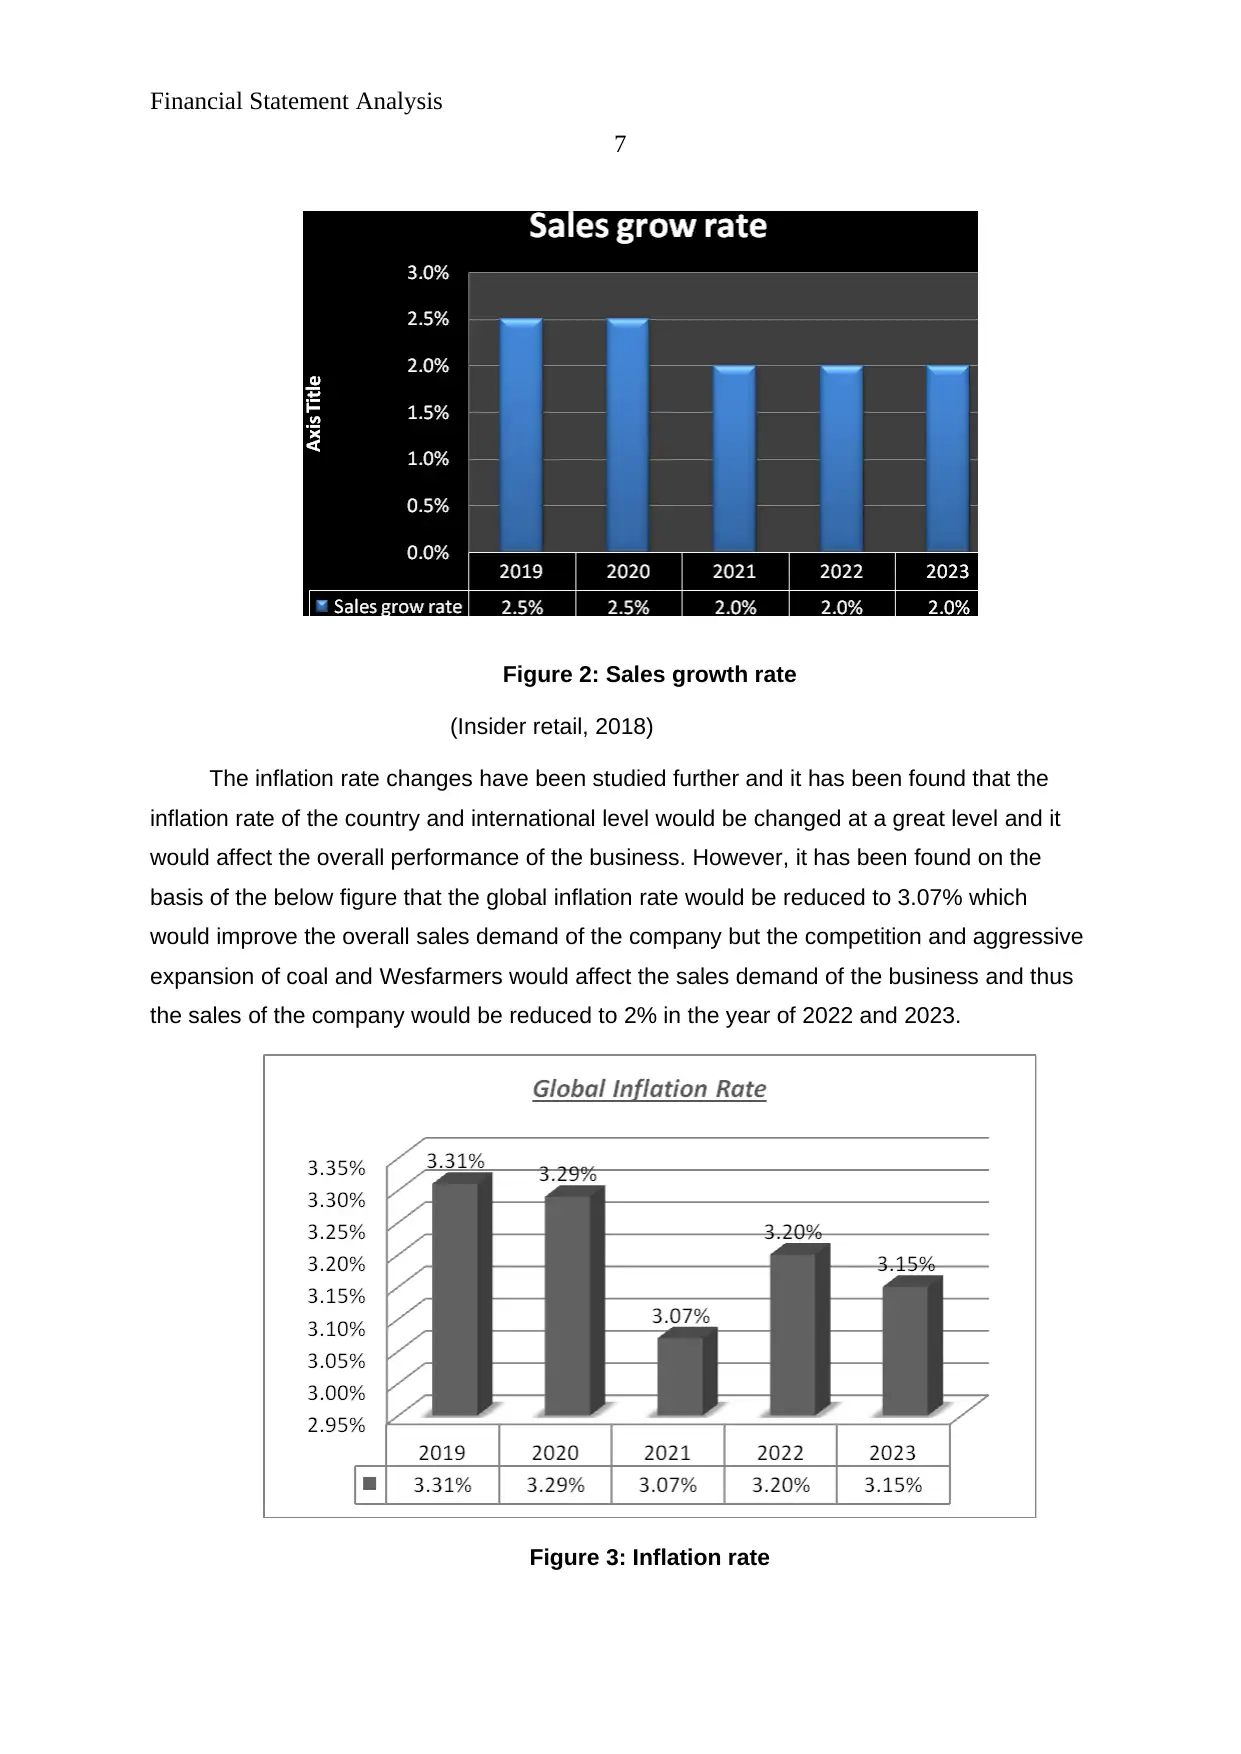
The inflation rate changes have been studied further and it has been found that the
inflation rate of the country and international level would be changed at a great level and it
would affect the overall performance of the business. However, it has been found on the
basis of the below figure that the global inflation rate would be reduced to 3.07% which
would improve the overall sales demand of the company but the competition and aggressive
expansion of coal and Wesfarmers would affect the sales demand of the business and thus
the sales of the company would be reduced to 2% in the year of 2022 and 2023.
Figure 3: Inflation rate
7
Figure 2: Sales growth rate
(Insider retail, 2018)
The inflation rate changes have been studied further and it has been found that the
inflation rate of the country and international level would be changed at a great level and it
would affect the overall performance of the business. However, it has been found on the
basis of the below figure that the global inflation rate would be reduced to 3.07% which
would improve the overall sales demand of the company but the competition and aggressive
expansion of coal and Wesfarmers would affect the sales demand of the business and thus
the sales of the company would be reduced to 2% in the year of 2022 and 2023.
Figure 3: Inflation rate
Paraphrase This Document
Need a fresh take? Get an instant paraphrase of this document with our AI Paraphraser
Financial Statement Analysis
8
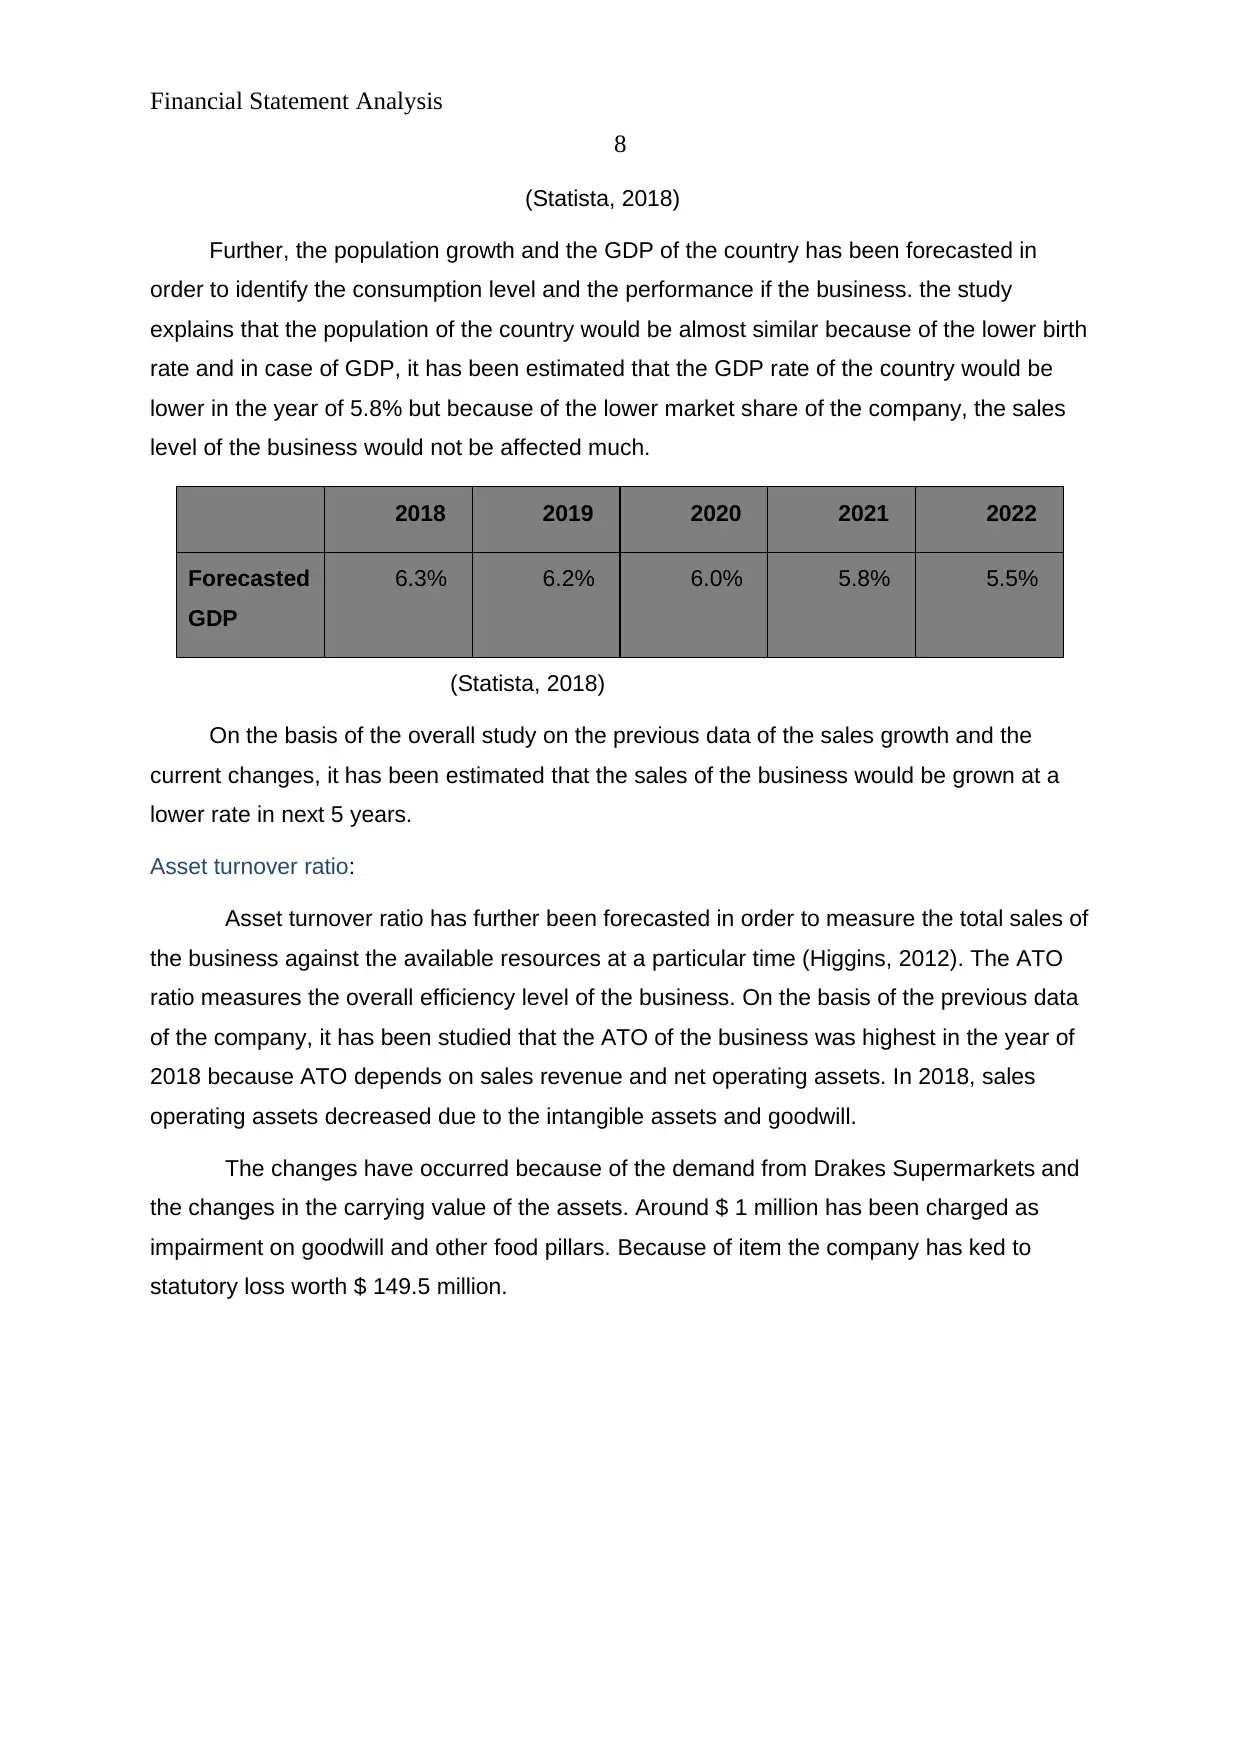
(Statista, 2018)
Further, the population growth and the GDP of the country has been forecasted in
order to identify the consumption level and the performance if the business. the study
explains that the population of the country would be almost similar because of the lower birth
rate and in case of GDP, it has been estimated that the GDP rate of the country would be
lower in the year of 5.8% but because of the lower market share of the company, the sales
level of the business would not be affected much.
2018 2019 2020 2021 2022
Forecasted
GDP
6.3% 6.2% 6.0% 5.8% 5.5%
(Statista, 2018)
On the basis of the overall study on the previous data of the sales growth and the
current changes, it has been estimated that the sales of the business would be grown at a
lower rate in next 5 years.
Asset turnover ratio:
Asset turnover ratio has further been forecasted in order to measure the total sales of
the business against the available resources at a particular time (Higgins, 2012). The ATO
ratio measures the overall efficiency level of the business. On the basis of the previous data
of the company, it has been studied that the ATO of the business was highest in the year of
2018 because ATO depends on sales revenue and net operating assets. In 2018, sales
operating assets decreased due to the intangible assets and goodwill.
The changes have occurred because of the demand from Drakes Supermarkets and
the changes in the carrying value of the assets. Around $ 1 million has been charged as
impairment on goodwill and other food pillars. Because of item the company has ked to
statutory loss worth $ 149.5 million.
8
(Statista, 2018)
Further, the population growth and the GDP of the country has been forecasted in
order to identify the consumption level and the performance if the business. the study
explains that the population of the country would be almost similar because of the lower birth
rate and in case of GDP, it has been estimated that the GDP rate of the country would be
lower in the year of 5.8% but because of the lower market share of the company, the sales
level of the business would not be affected much.
2018 2019 2020 2021 2022
Forecasted
GDP
6.3% 6.2% 6.0% 5.8% 5.5%
(Statista, 2018)
On the basis of the overall study on the previous data of the sales growth and the
current changes, it has been estimated that the sales of the business would be grown at a
lower rate in next 5 years.
Asset turnover ratio:
Asset turnover ratio has further been forecasted in order to measure the total sales of
the business against the available resources at a particular time (Higgins, 2012). The ATO
ratio measures the overall efficiency level of the business. On the basis of the previous data
of the company, it has been studied that the ATO of the business was highest in the year of
2018 because ATO depends on sales revenue and net operating assets. In 2018, sales
operating assets decreased due to the intangible assets and goodwill.
The changes have occurred because of the demand from Drakes Supermarkets and
the changes in the carrying value of the assets. Around $ 1 million has been charged as
impairment on goodwill and other food pillars. Because of item the company has ked to
statutory loss worth $ 149.5 million.
Financial Statement Analysis
9
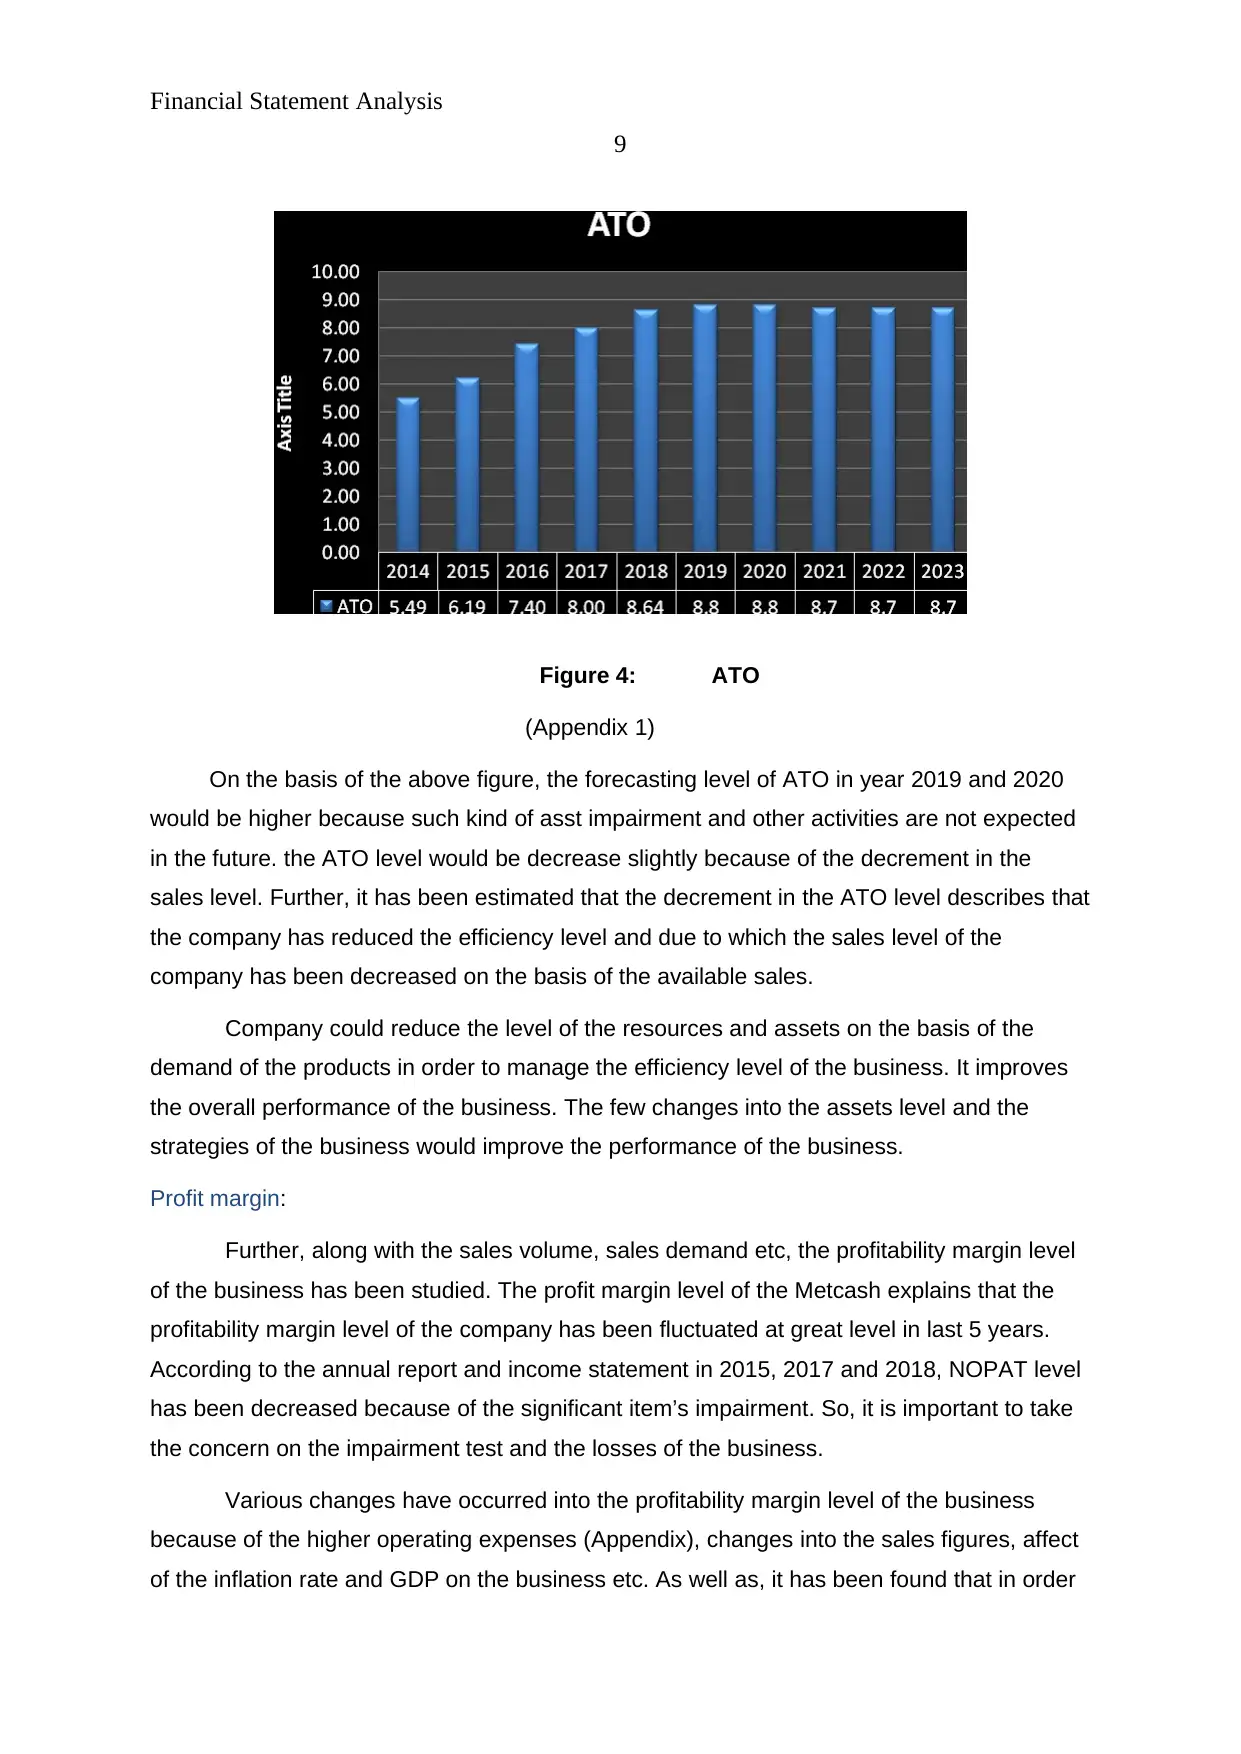
Figure 4: ATO
(Appendix 1)
On the basis of the above figure, the forecasting level of ATO in year 2019 and 2020
would be higher because such kind of asst impairment and other activities are not expected
in the future. the ATO level would be decrease slightly because of the decrement in the
sales level. Further, it has been estimated that the decrement in the ATO level describes that
the company has reduced the efficiency level and due to which the sales level of the
company has been decreased on the basis of the available sales.
Company could reduce the level of the resources and assets on the basis of the
demand of the products in order to manage the efficiency level of the business. It improves
the overall performance of the business. The few changes into the assets level and the
strategies of the business would improve the performance of the business.
Profit margin:
Further, along with the sales volume, sales demand etc, the profitability margin level
of the business has been studied. The profit margin level of the Metcash explains that the
profitability margin level of the company has been fluctuated at great level in last 5 years.
According to the annual report and income statement in 2015, 2017 and 2018, NOPAT level
has been decreased because of the significant item’s impairment. So, it is important to take
the concern on the impairment test and the losses of the business.
Various changes have occurred into the profitability margin level of the business
because of the higher operating expenses (Appendix), changes into the sales figures, affect
of the inflation rate and GDP on the business etc. As well as, it has been found that in order
9
Figure 4: ATO
(Appendix 1)
On the basis of the above figure, the forecasting level of ATO in year 2019 and 2020
would be higher because such kind of asst impairment and other activities are not expected
in the future. the ATO level would be decrease slightly because of the decrement in the
sales level. Further, it has been estimated that the decrement in the ATO level describes that
the company has reduced the efficiency level and due to which the sales level of the
company has been decreased on the basis of the available sales.
Company could reduce the level of the resources and assets on the basis of the
demand of the products in order to manage the efficiency level of the business. It improves
the overall performance of the business. The few changes into the assets level and the
strategies of the business would improve the performance of the business.
Profit margin:
Further, along with the sales volume, sales demand etc, the profitability margin level
of the business has been studied. The profit margin level of the Metcash explains that the
profitability margin level of the company has been fluctuated at great level in last 5 years.
According to the annual report and income statement in 2015, 2017 and 2018, NOPAT level
has been decreased because of the significant item’s impairment. So, it is important to take
the concern on the impairment test and the losses of the business.
Various changes have occurred into the profitability margin level of the business
because of the higher operating expenses (Appendix), changes into the sales figures, affect
of the inflation rate and GDP on the business etc. As well as, it has been found that in order
⊘ This is a preview!⊘
Do you want full access?
Subscribe today to unlock all pages.
Trusted by 1+ million students worldwide
Financial Statement Analysis
10
to manage the cost leadership pricing strategy (the lowest cost in the market to improve the
market share), the company has to reduce the margin % (Higgins, 2012). In last 5 years,
from 2013 to 2018, the profit margin of the company was reduced by 0.9% because of the
changes in the demand of food, liquor and prices of Metcash limited.
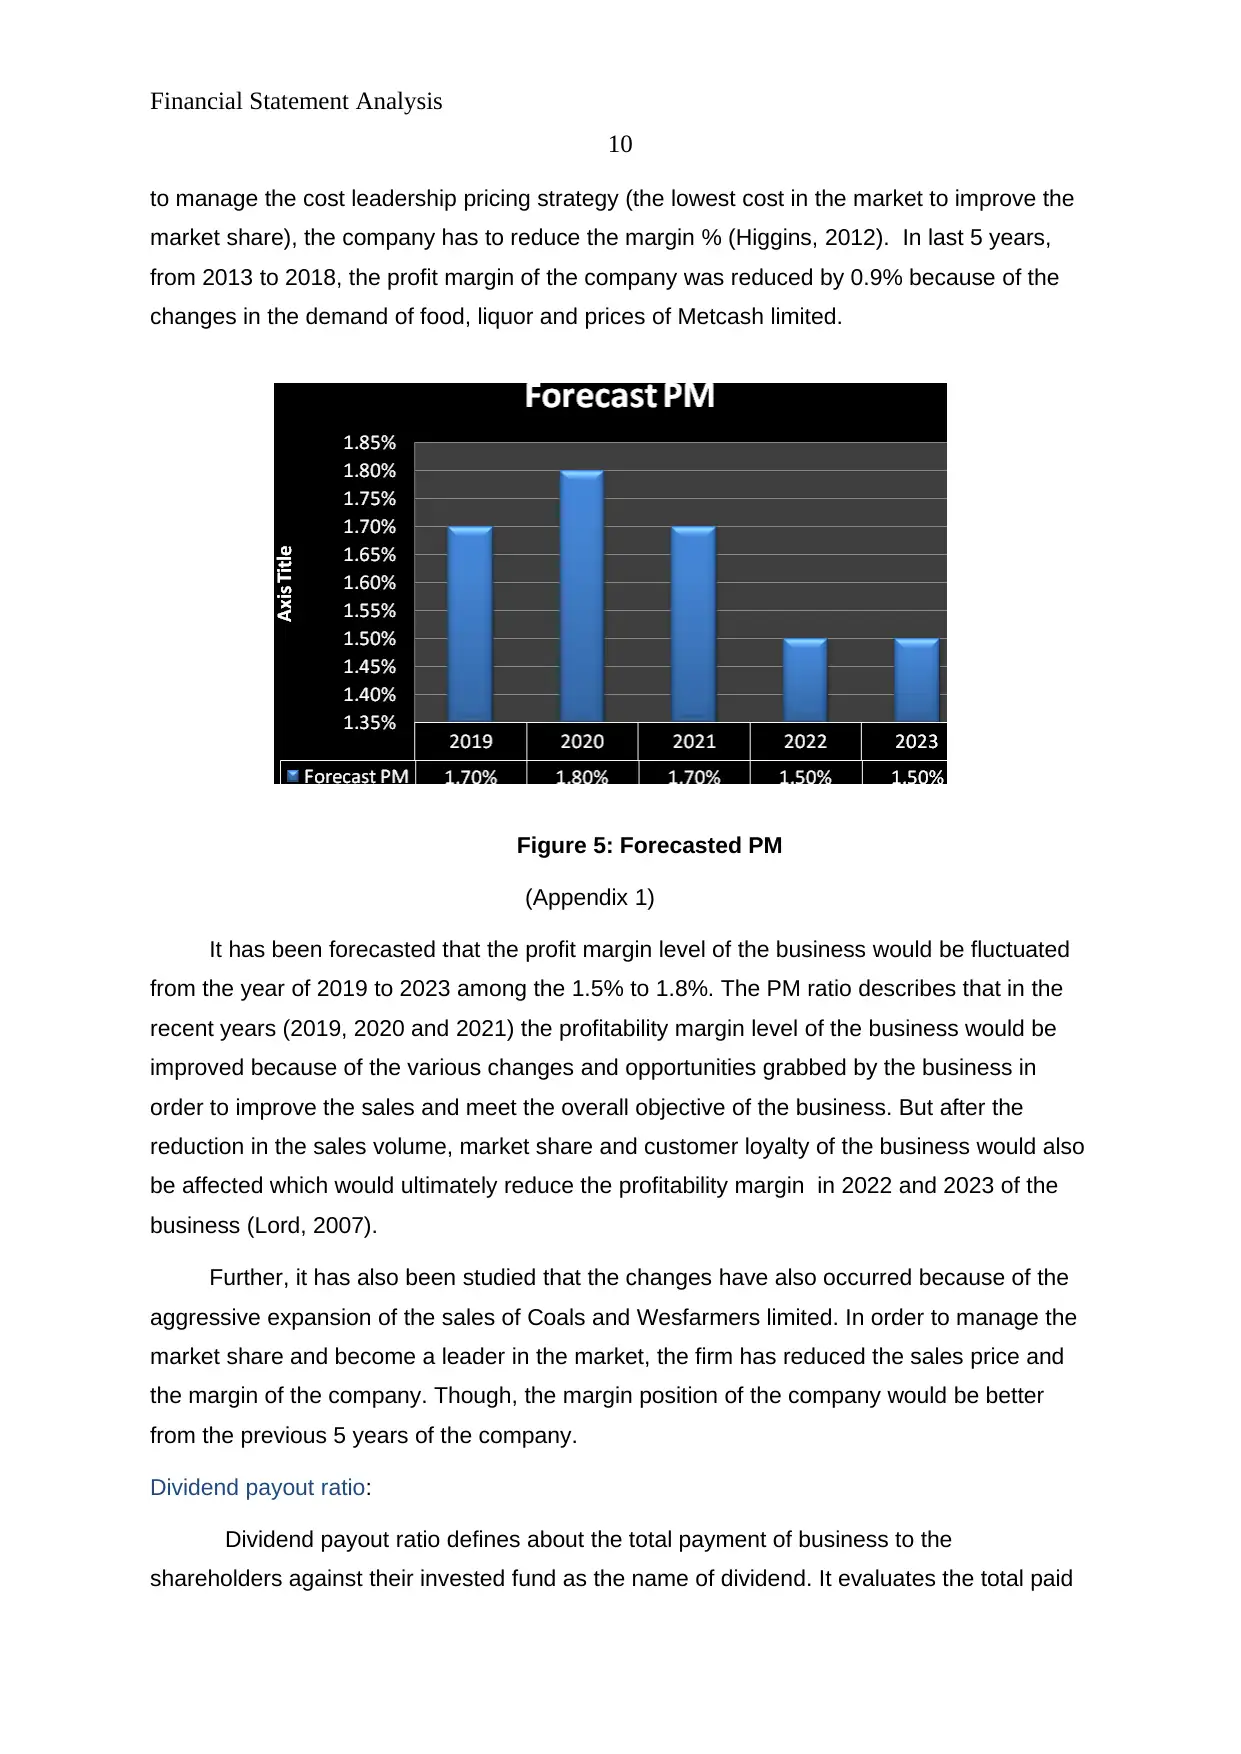
Figure 5: Forecasted PM
(Appendix 1)
It has been forecasted that the profit margin level of the business would be fluctuated
from the year of 2019 to 2023 among the 1.5% to 1.8%. The PM ratio describes that in the
recent years (2019, 2020 and 2021) the profitability margin level of the business would be
improved because of the various changes and opportunities grabbed by the business in
order to improve the sales and meet the overall objective of the business. But after the
reduction in the sales volume, market share and customer loyalty of the business would also
be affected which would ultimately reduce the profitability margin in 2022 and 2023 of the
business (Lord, 2007).
Further, it has also been studied that the changes have also occurred because of the
aggressive expansion of the sales of Coals and Wesfarmers limited. In order to manage the
market share and become a leader in the market, the firm has reduced the sales price and
the margin of the company. Though, the margin position of the company would be better
from the previous 5 years of the company.
Dividend payout ratio:
Dividend payout ratio defines about the total payment of business to the
shareholders against their invested fund as the name of dividend. It evaluates the total paid
10
to manage the cost leadership pricing strategy (the lowest cost in the market to improve the
market share), the company has to reduce the margin % (Higgins, 2012). In last 5 years,
from 2013 to 2018, the profit margin of the company was reduced by 0.9% because of the
changes in the demand of food, liquor and prices of Metcash limited.
Figure 5: Forecasted PM
(Appendix 1)
It has been forecasted that the profit margin level of the business would be fluctuated
from the year of 2019 to 2023 among the 1.5% to 1.8%. The PM ratio describes that in the
recent years (2019, 2020 and 2021) the profitability margin level of the business would be
improved because of the various changes and opportunities grabbed by the business in
order to improve the sales and meet the overall objective of the business. But after the
reduction in the sales volume, market share and customer loyalty of the business would also
be affected which would ultimately reduce the profitability margin in 2022 and 2023 of the
business (Lord, 2007).
Further, it has also been studied that the changes have also occurred because of the
aggressive expansion of the sales of Coals and Wesfarmers limited. In order to manage the
market share and become a leader in the market, the firm has reduced the sales price and
the margin of the company. Though, the margin position of the company would be better
from the previous 5 years of the company.
Dividend payout ratio:
Dividend payout ratio defines about the total payment of business to the
shareholders against their invested fund as the name of dividend. It evaluates the total paid
Paraphrase This Document
Need a fresh take? Get an instant paraphrase of this document with our AI Paraphraser
Financial Statement Analysis
11
amount against the total profit of the business. Increment in the NOPAT improves the FCF
level of the business which is driven by the total profit kevel and the sales of the company.
Through conducting the study on Metcash, it has been found that the dividend payout ratio
of the company has been lower in the year of 2018 at great extent because of the reduction
in net income. the decrement has occurred because of the loss of Drake contract.
2014 2015 2016 2017 2018
Dividend 207.1 55.9 1.4 1.3 105.3
Dividend payout
Ratio =Dividend
paid /Net Income 95.76%
-
16.52% 0.57% 0.67%
-
84.24%
(Appendix 1)
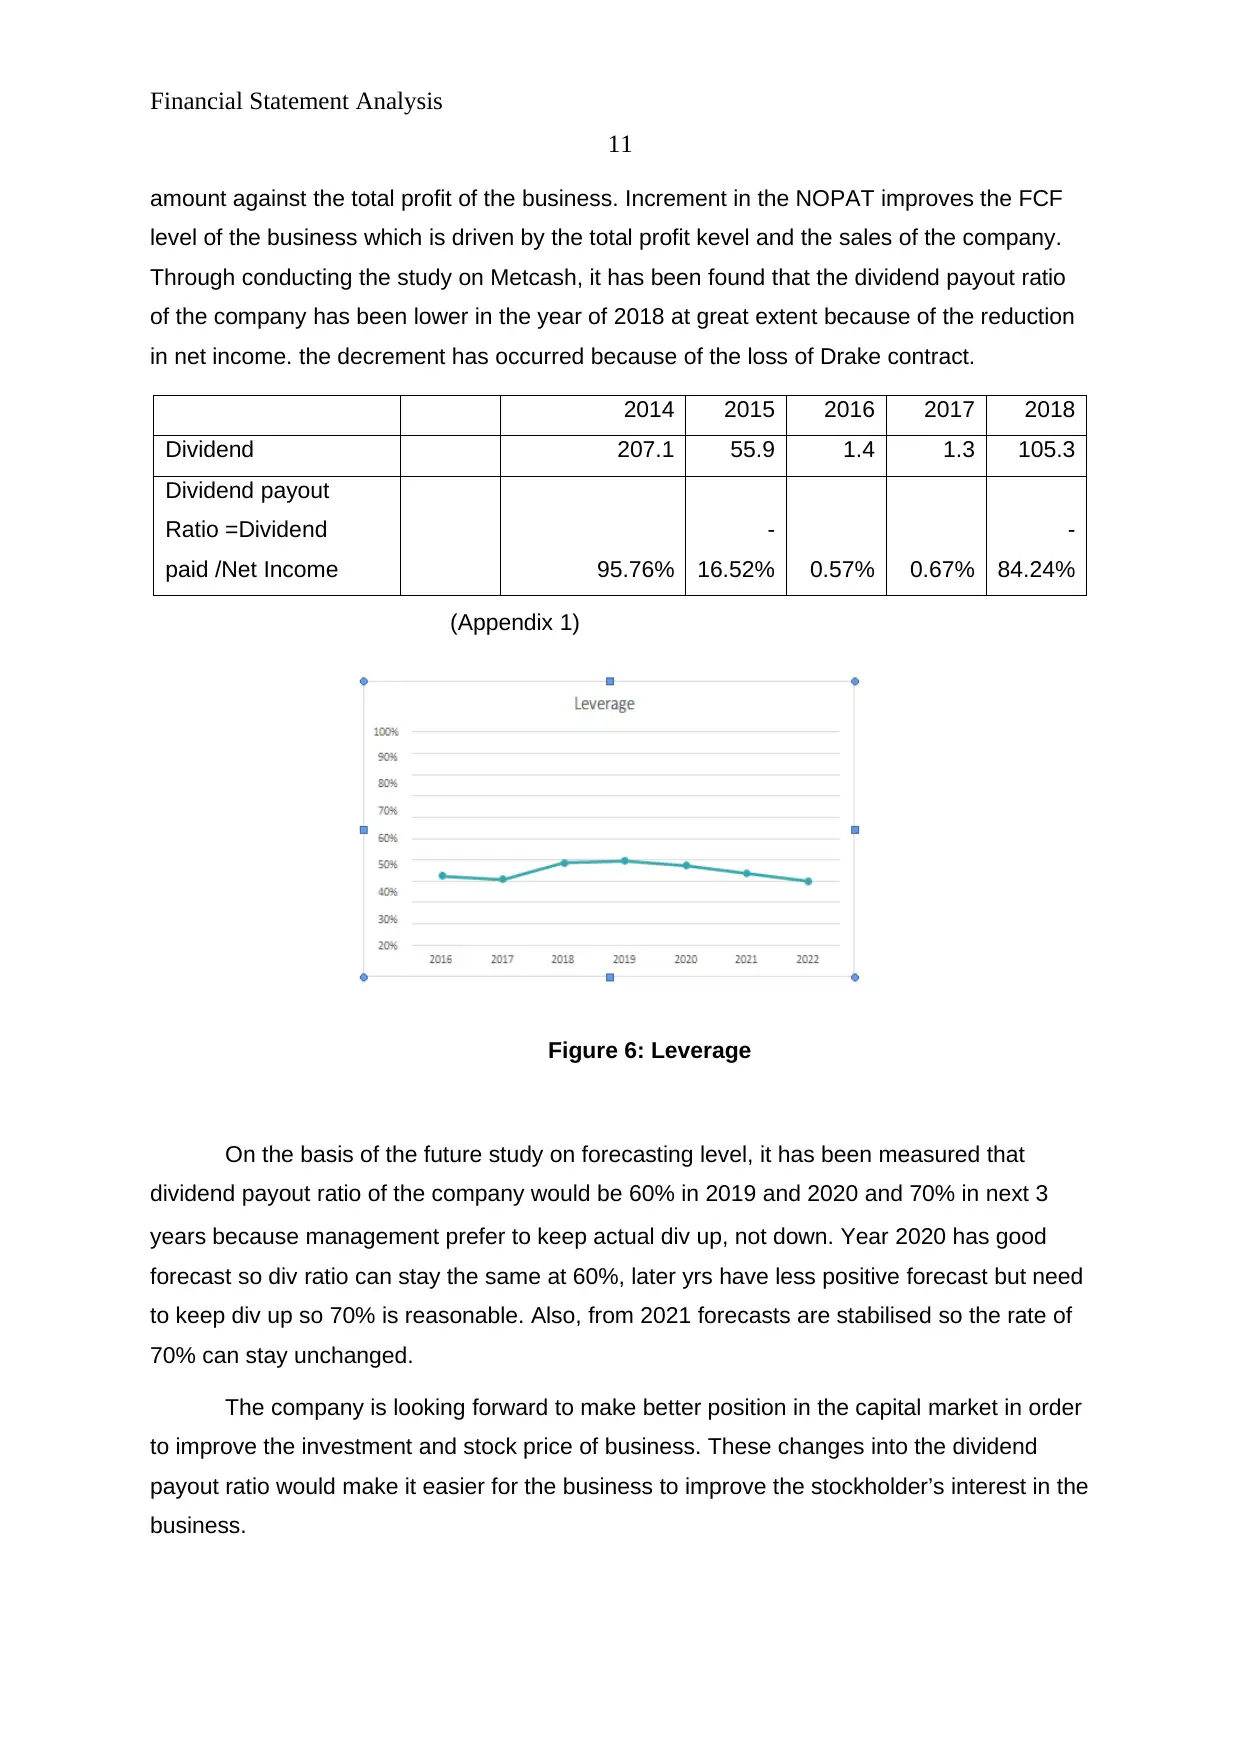
Figure 6: Leverage
On the basis of the future study on forecasting level, it has been measured that
dividend payout ratio of the company would be 60% in 2019 and 2020 and 70% in next 3
years because management prefer to keep actual div up, not down. Year 2020 has good
forecast so div ratio can stay the same at 60%, later yrs have less positive forecast but need
to keep div up so 70% is reasonable. Also, from 2021 forecasts are stabilised so the rate of
70% can stay unchanged.
The company is looking forward to make better position in the capital market in order
to improve the investment and stock price of business. These changes into the dividend
payout ratio would make it easier for the business to improve the stockholder’s interest in the
business.
11
amount against the total profit of the business. Increment in the NOPAT improves the FCF
level of the business which is driven by the total profit kevel and the sales of the company.
Through conducting the study on Metcash, it has been found that the dividend payout ratio
of the company has been lower in the year of 2018 at great extent because of the reduction
in net income. the decrement has occurred because of the loss of Drake contract.
2014 2015 2016 2017 2018
Dividend 207.1 55.9 1.4 1.3 105.3
Dividend payout
Ratio =Dividend
paid /Net Income 95.76%
-
16.52% 0.57% 0.67%
-
84.24%
(Appendix 1)
Figure 6: Leverage
On the basis of the future study on forecasting level, it has been measured that
dividend payout ratio of the company would be 60% in 2019 and 2020 and 70% in next 3
years because management prefer to keep actual div up, not down. Year 2020 has good
forecast so div ratio can stay the same at 60%, later yrs have less positive forecast but need
to keep div up so 70% is reasonable. Also, from 2021 forecasts are stabilised so the rate of
70% can stay unchanged.
The company is looking forward to make better position in the capital market in order
to improve the investment and stock price of business. These changes into the dividend
payout ratio would make it easier for the business to improve the stockholder’s interest in the
business.
Financial Statement Analysis
12
2019 2020 2021 2022 2023
Forecast net dividend payout
ratio
-84.24% 60% 60% 70% 70% 70%
(Appendix 1)
Cost of debt:
Further, the cost of debt level of the business has been studied in order to evaluate
that how much cost would be spent by the company in order to manage the funds from the
debenture holders of the business. The cost of debt level of the business explains that the
cost of debt of the business is 13.5%. It explains that the level of cost of debt of the business
is quite higher and it would lead to the business towards the huge cost level. In order to
manage this much of cost, the business has to invest in those projects and investment
proposal, where the cost of debt of the business is lower (Higgins, 2012). The cost of debt
level of the Metcash is even higher than the Reserve Bank of Australia’s interest rate which
explains that the few requirements are required in the business in order to manage the cost
level.
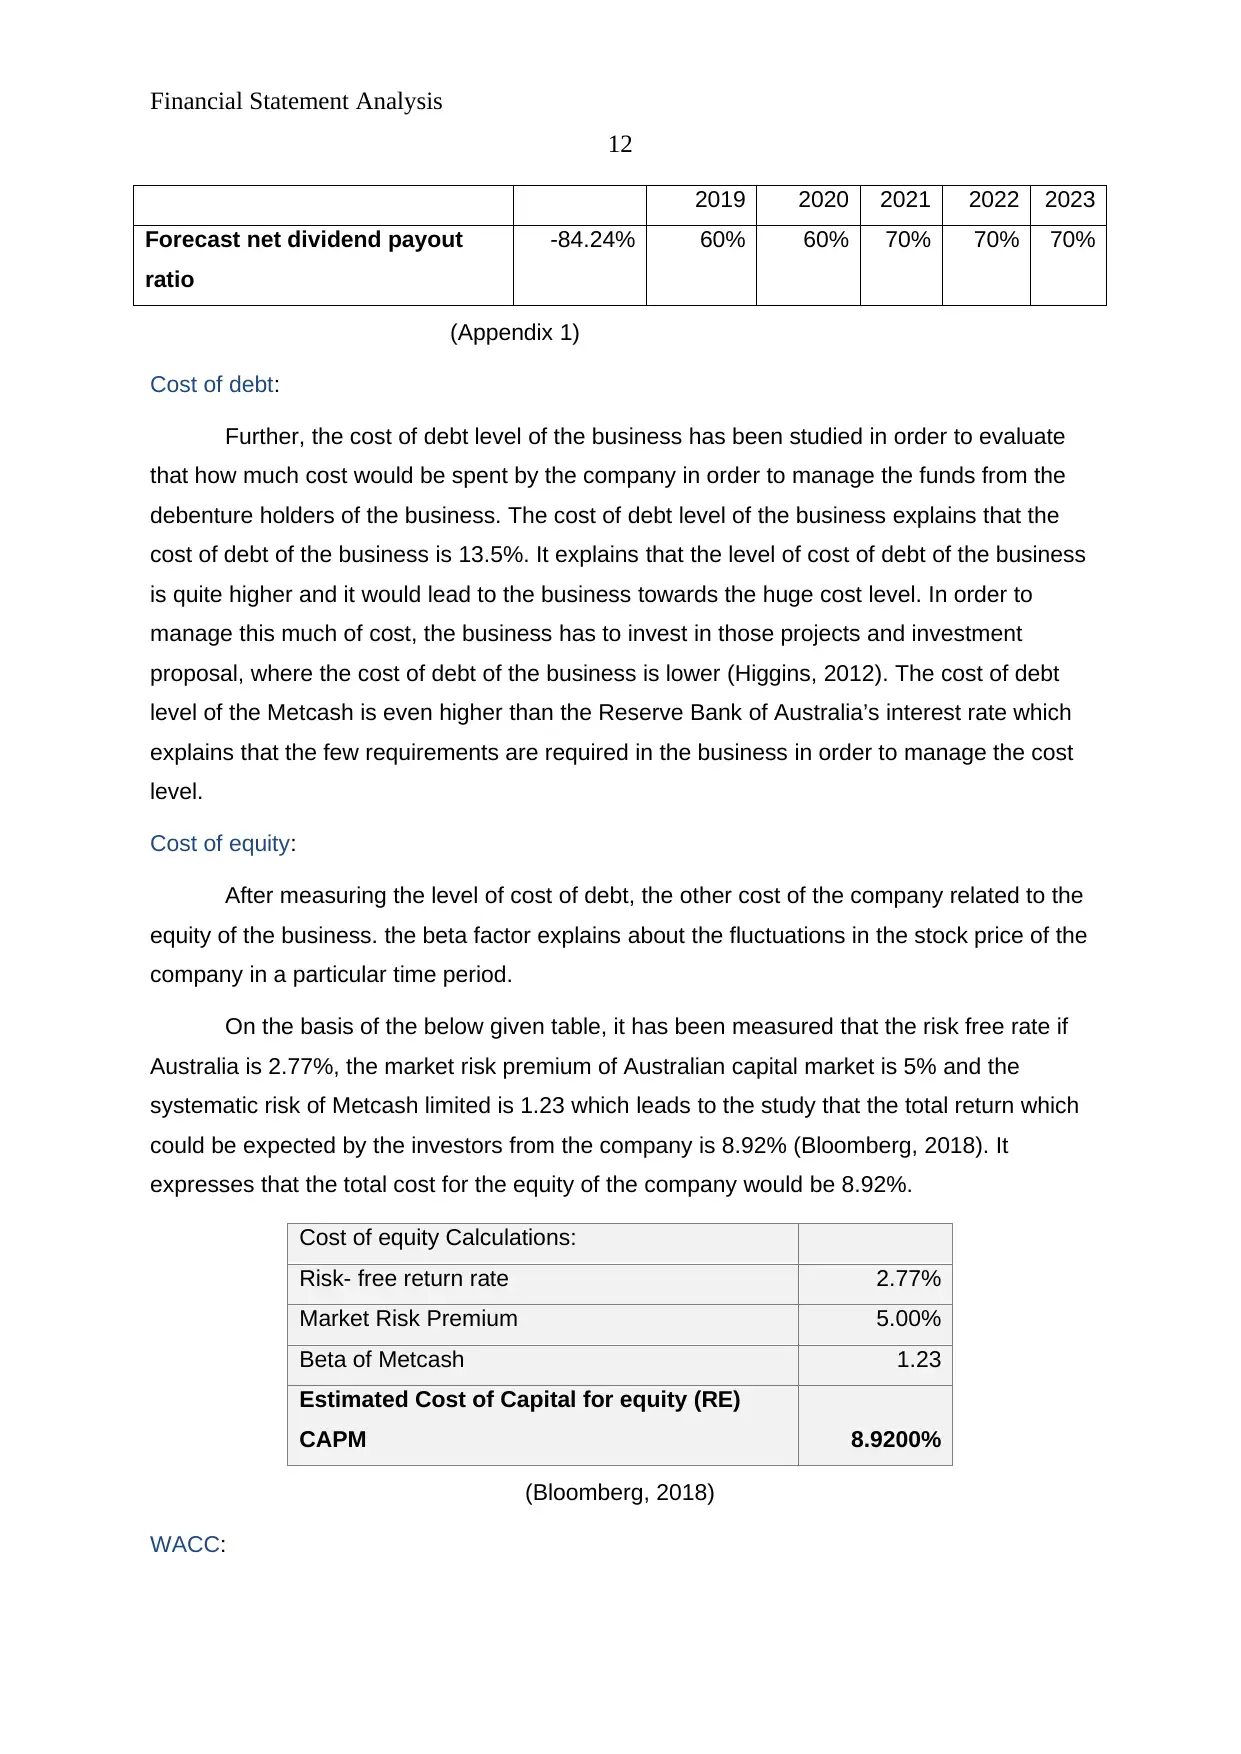
Cost of equity:
After measuring the level of cost of debt, the other cost of the company related to the
equity of the business. the beta factor explains about the fluctuations in the stock price of the
company in a particular time period.
On the basis of the below given table, it has been measured that the risk free rate if
Australia is 2.77%, the market risk premium of Australian capital market is 5% and the
systematic risk of Metcash limited is 1.23 which leads to the study that the total return which
could be expected by the investors from the company is 8.92% (Bloomberg, 2018). It
expresses that the total cost for the equity of the company would be 8.92%.
Cost of equity Calculations:
Risk- free return rate 2.77%
Market Risk Premium 5.00%
Beta of Metcash 1.23
Estimated Cost of Capital for equity (RE)
CAPM 8.9200%
(Bloomberg, 2018)
WACC:
12
2019 2020 2021 2022 2023
Forecast net dividend payout
ratio
-84.24% 60% 60% 70% 70% 70%
(Appendix 1)
Cost of debt:
Further, the cost of debt level of the business has been studied in order to evaluate
that how much cost would be spent by the company in order to manage the funds from the
debenture holders of the business. The cost of debt level of the business explains that the
cost of debt of the business is 13.5%. It explains that the level of cost of debt of the business
is quite higher and it would lead to the business towards the huge cost level. In order to
manage this much of cost, the business has to invest in those projects and investment
proposal, where the cost of debt of the business is lower (Higgins, 2012). The cost of debt
level of the Metcash is even higher than the Reserve Bank of Australia’s interest rate which
explains that the few requirements are required in the business in order to manage the cost
level.
Cost of equity:
After measuring the level of cost of debt, the other cost of the company related to the
equity of the business. the beta factor explains about the fluctuations in the stock price of the
company in a particular time period.
On the basis of the below given table, it has been measured that the risk free rate if
Australia is 2.77%, the market risk premium of Australian capital market is 5% and the
systematic risk of Metcash limited is 1.23 which leads to the study that the total return which
could be expected by the investors from the company is 8.92% (Bloomberg, 2018). It
expresses that the total cost for the equity of the company would be 8.92%.
Cost of equity Calculations:
Risk- free return rate 2.77%
Market Risk Premium 5.00%
Beta of Metcash 1.23
Estimated Cost of Capital for equity (RE)
CAPM 8.9200%
(Bloomberg, 2018)
WACC:
⊘ This is a preview!⊘
Do you want full access?
Subscribe today to unlock all pages.
Trusted by 1+ million students worldwide
1 out of 24
Related Documents


Your All-in-One AI-Powered Toolkit for Academic Success.
+13062052269
info@desklib.com
Available 24*7 on WhatsApp / Email
![[object Object]](/_next/static/media/star-bottom.7253800d.svg)
Unlock your academic potential
Copyright © 2020–2026 A2Z Services. All Rights Reserved. Developed and managed by ZUCOL.