Singapore University PSY392 TMA01: Rainfall Data Analysis Report

Verified

Added on  2022/08/27

|16
|1805
|30
Homework Assignment
AI Summary
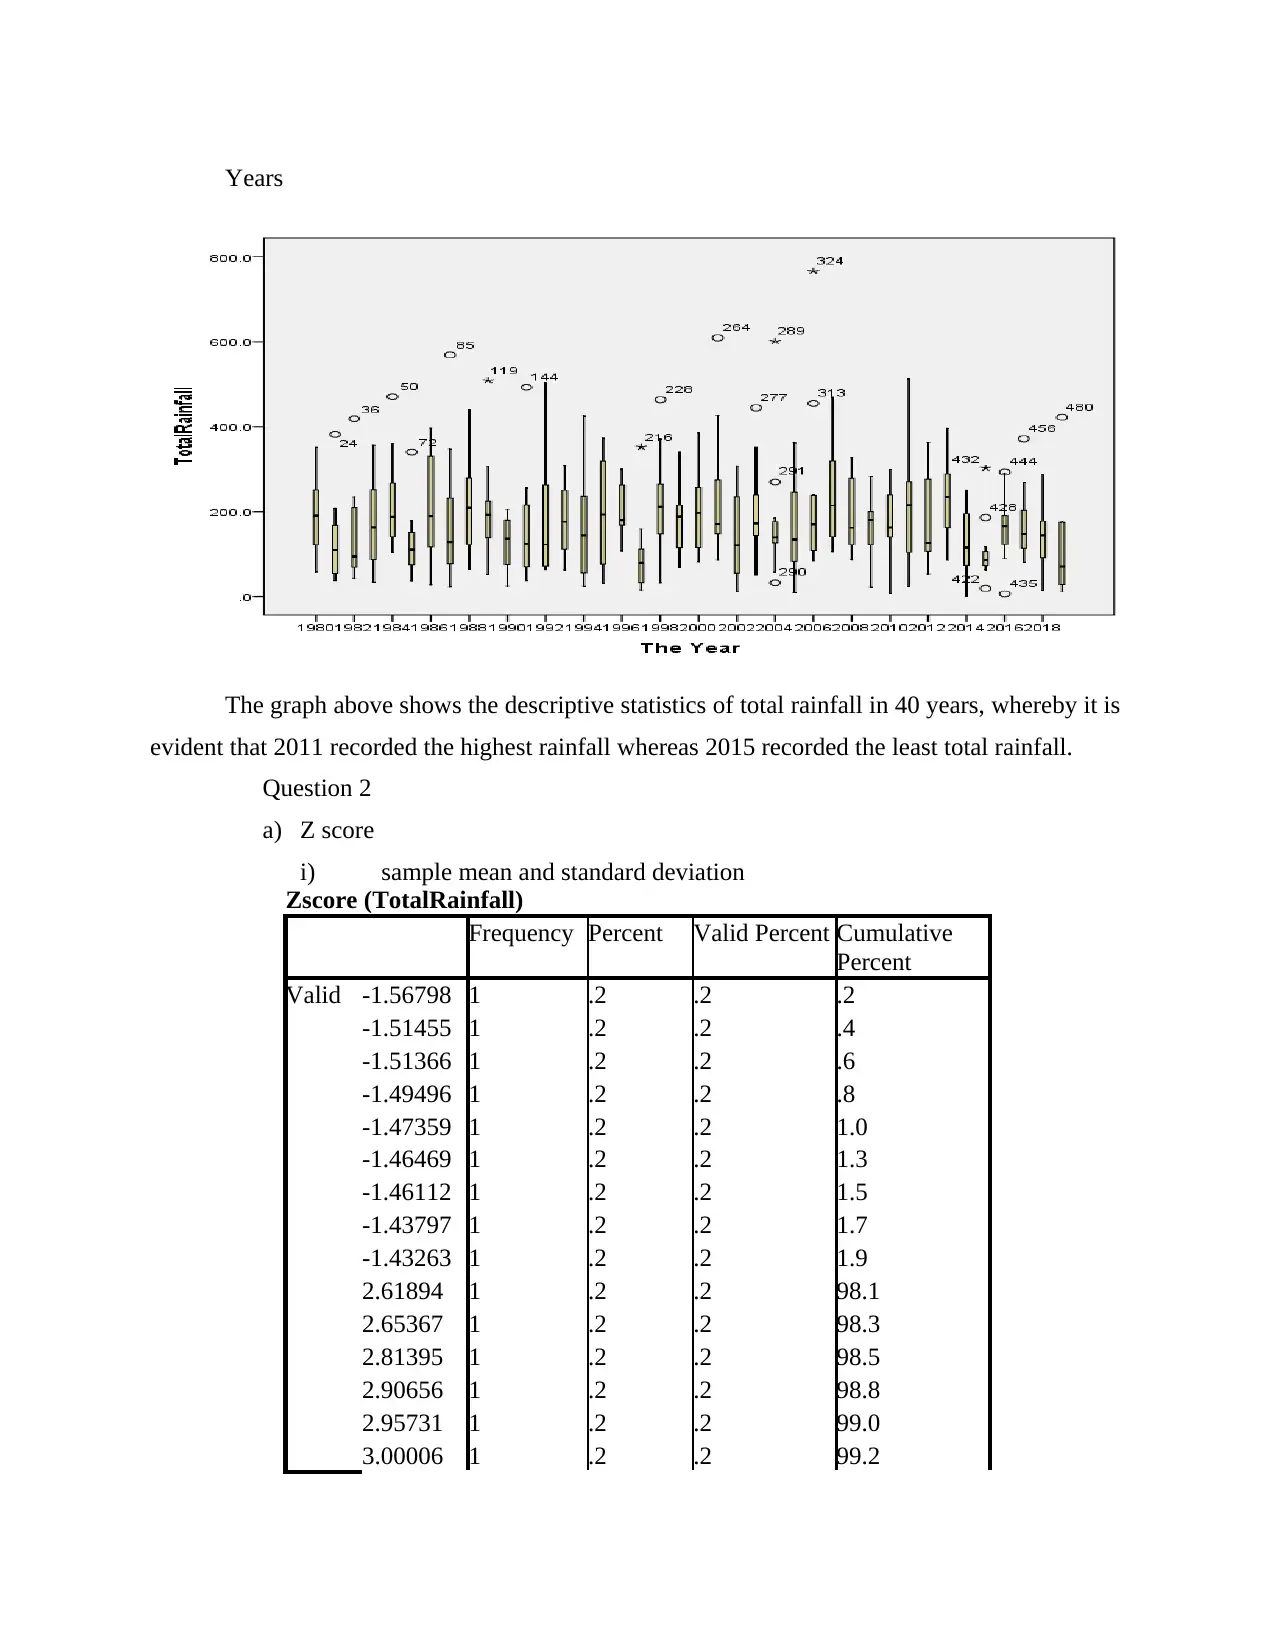
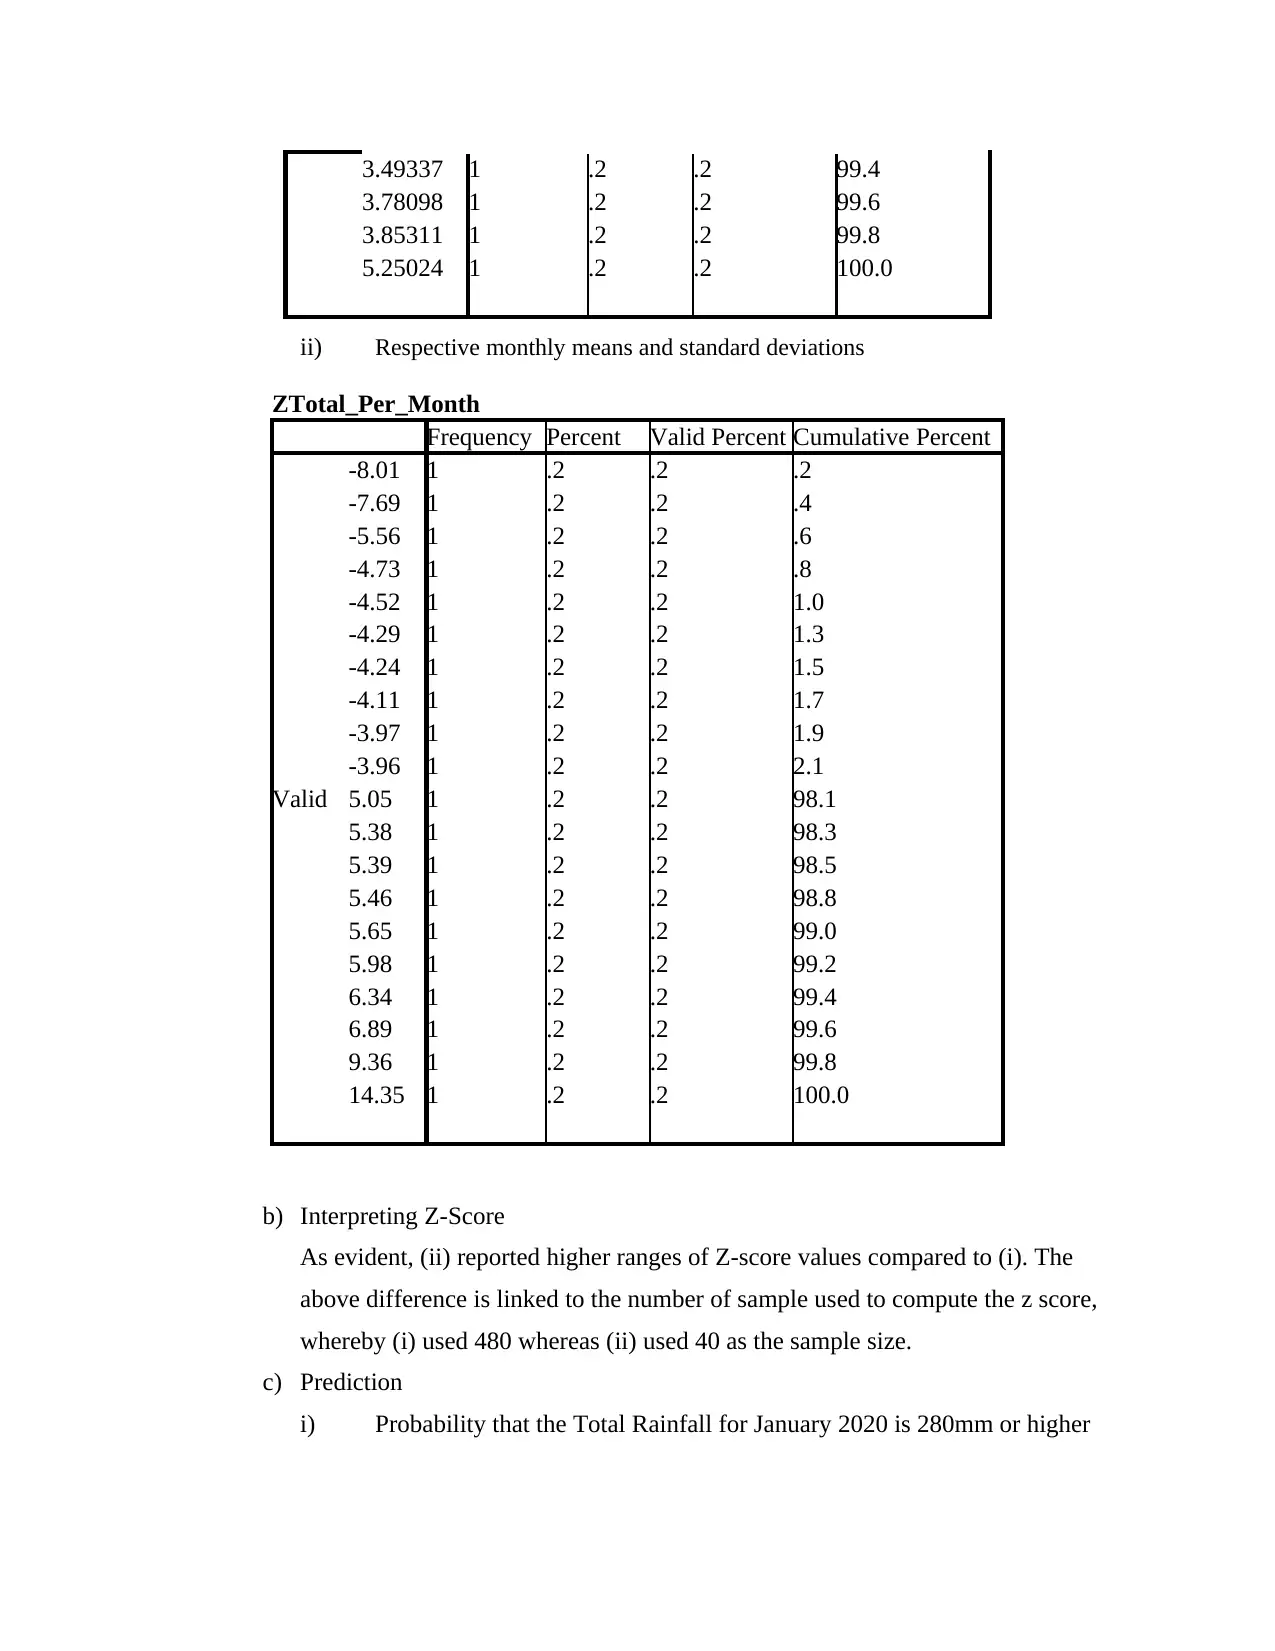
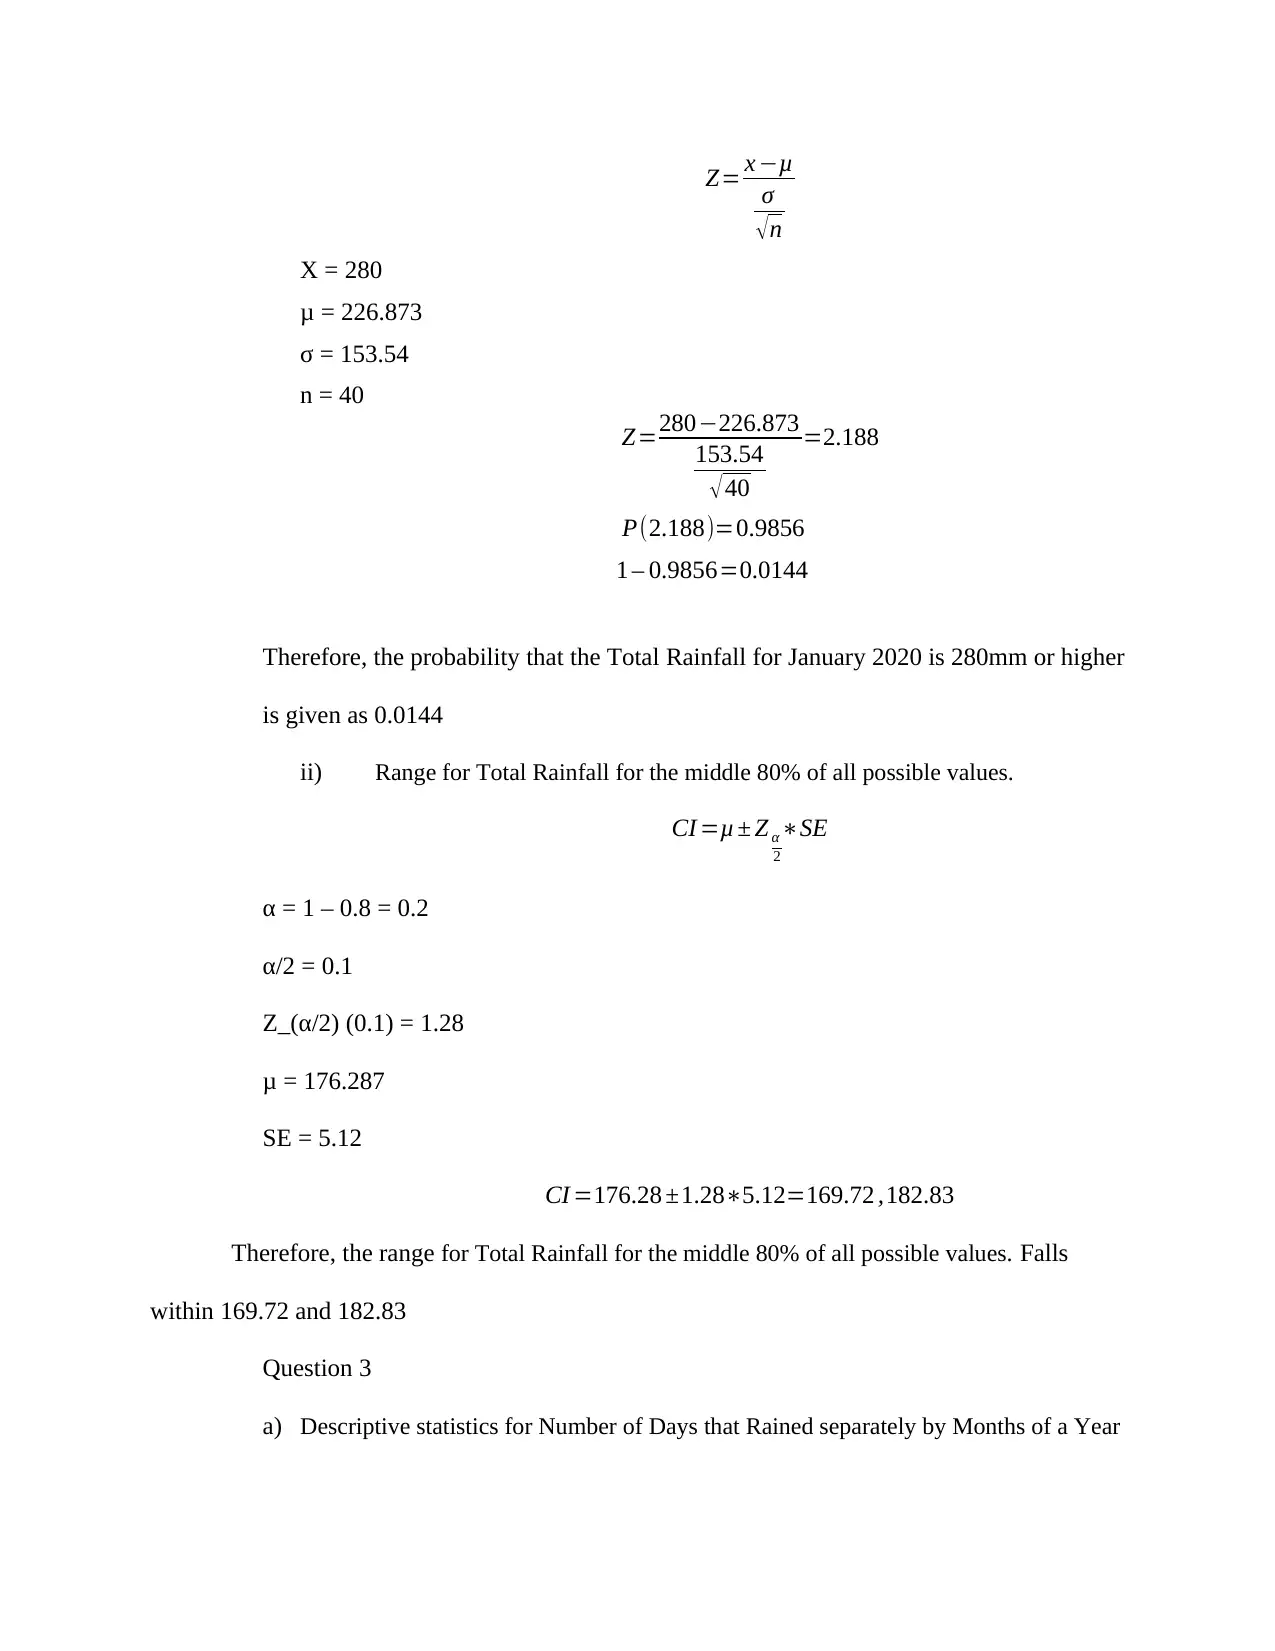
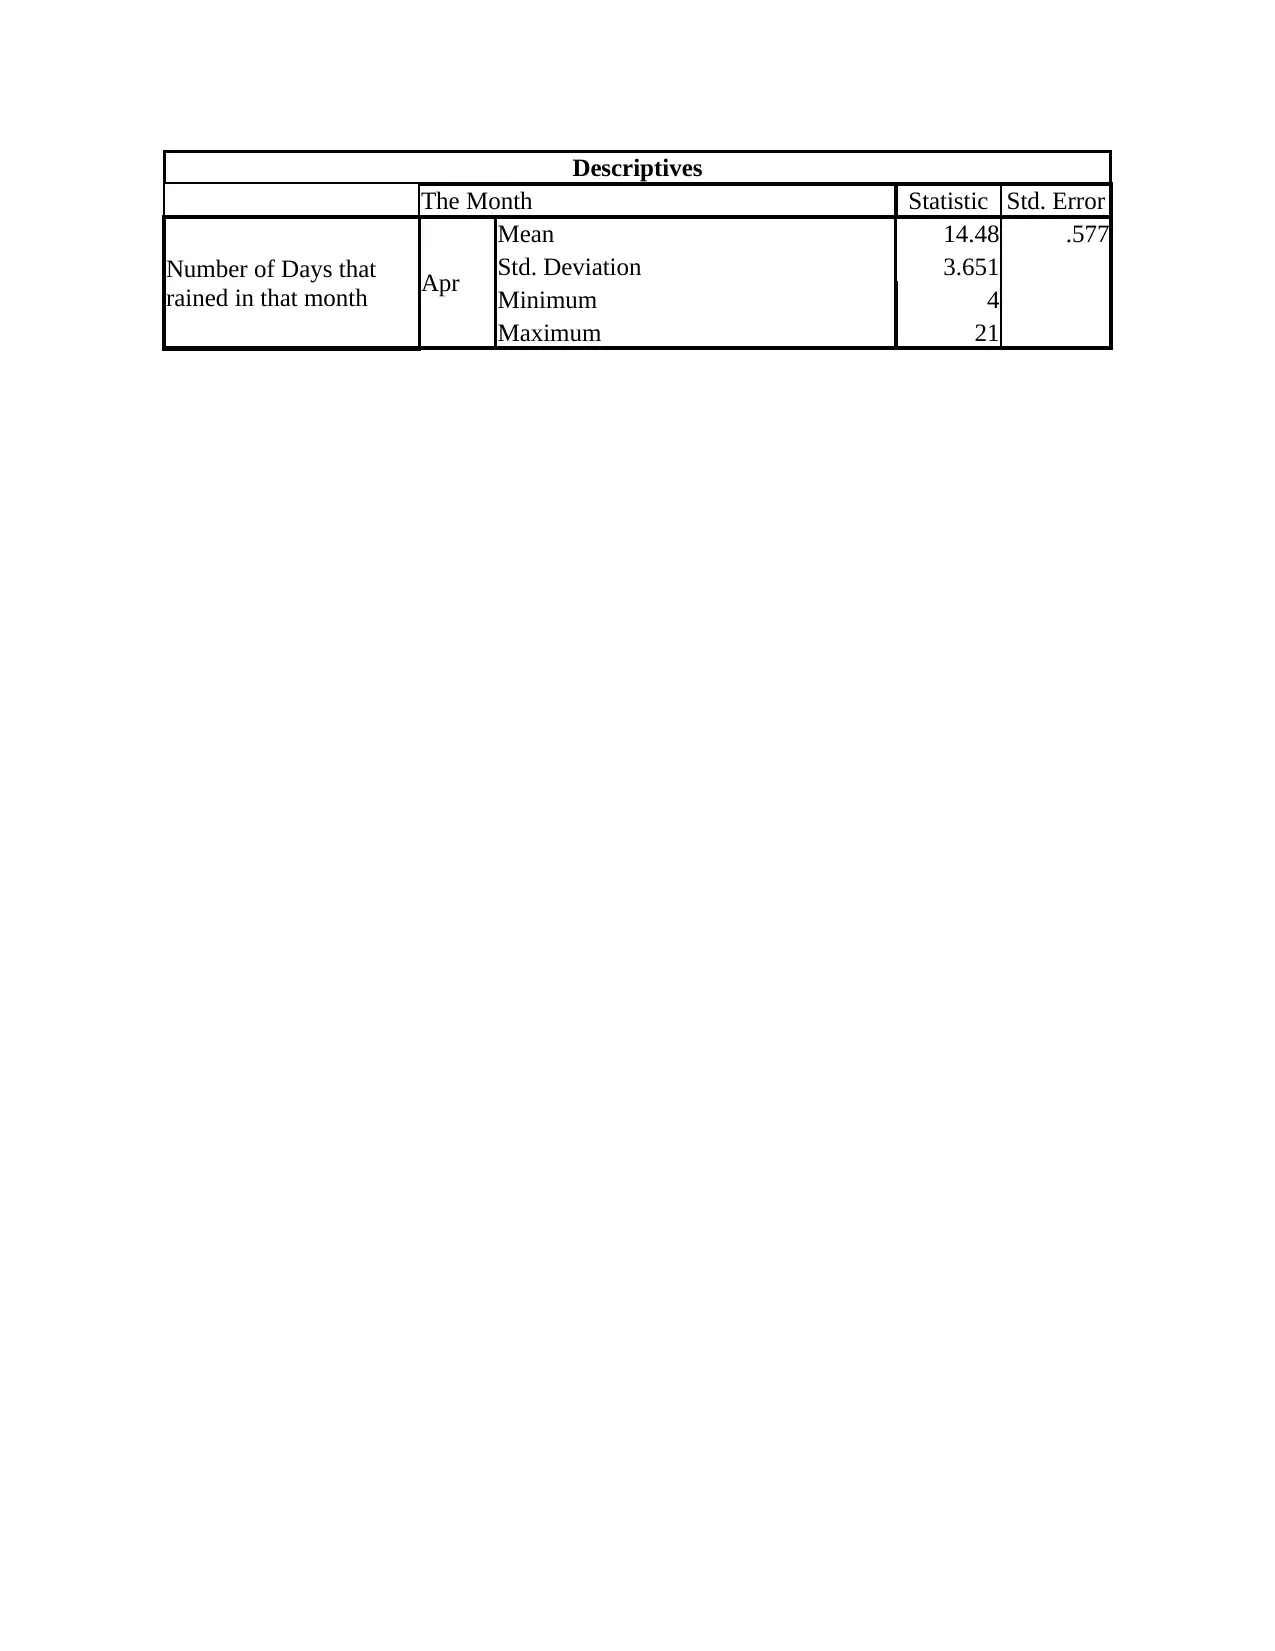
This assignment solution addresses a PSY392 Methods of Data Analysis assignment, focusing on the analysis of rainfall data. The assignment includes a cover page with student details and declarations of academic integrity. The solution delves into the analysis of rainfall data across different decades and months, utilizing descriptive statistics, frequency distributions, and Z-scores. It presents data on total rainfall, number of rainy days, and their statistical properties, including means, medians, standard deviations, and ranges. The analysis also involves prediction probabilities for future rainfall and discusses the appropriateness of different rainfall measures, along with identifying potential issues like outliers and suggesting data transformations for better analysis. The assignment demonstrates the application of statistical methods to interpret and draw meaningful conclusions from the rainfall dataset.
tabler-icon-diamond-filled.svg

Contribute Materials

Your contribution can guide someone’s learning journey. Share your documents today.
Document Page
School of Humanities & Behavioural Sciences
Psychology Assignment Cover Page
Student’s Name (official): Click here to enter text.
Student’s PI: Click here to enter text. Date of Submission: Click or tap to enter a
date.
Course Code: Choose an item. Assignment Type: Choose an item.
Please read and acknowledge the following self-declaration on academic integrity by clicking all
3 check-boxes (a cross will appear in the box) to indicate that you have understood and abided
by each item.
Plagiarism or Self-Plagiarism
The assignment I am submitting for this course is original and new
work. All sources I have quoted or referred to while working on this
assignment have been properly cited and acknowledged. This assignment is
substantially my own work (i.e., I have not excessively quoted other
people’s work and have not copied chunks of text, word for word), and is
not work that I have submitted for assessment previously for another
course.
Collusion
This assignment is entirely the product of my own effort. I have not
sought help from other people, whether in person or electronically, and
whether from persons known to me personally or otherwise.
Declaration
tabler-icon-diamond-filled.svg

Secure Best Marks with AI Grader

Need help grading? Try our AI Grader for instant feedback on your assignments.
Document Page
I have read and understood Section 7.2.2 of the SUSS’s Student
Handbook on academic integrity, and am aware of the University’s
penalties for academic dishonesty, which include marks deduction and
expulsion from the University. I bear full responsibility if my work is found
to be the result of plagiarism and/or collusion.
In addition, please acknowledge the following:
I have completed SD103 Academic Integrity. Respond Y/N
I have completed my assignment in accordance to the APA format. Respond Y/N
IMPORTANT
A penalty of 5 marks deduction will be imposed if this cover page
is incomplete, inaccurate or missing from the final submission of your assignment.
No appeals concerning the Cover Page will be entertained.
Document Page
For lecturers only
MARKS TABLE & FEEDBACK
Possible Marks Awarded
Pre-TMA Task 10
Question 1 a 15
b 20
Question 2 a 15
b 5
c 15
Question 3 a 5
b 5
c 10
Total 100 0
Document Page
Overall Feedback
Note to students: Please make sure you read the feedback given by your lecturers.
tabler-icon-diamond-filled.svg

Secure Best Marks with AI Grader

Need help grading? Try our AI Grader for instant feedback on your assignments.
Document Page
Data Preview Screen shots
Question 1
a) Frequency distribution
Decades
Frequency Percent Valid Percent Cumulative Percent
Valid
1980-1989 120 25.0 25.0 25.0
1990-1999 120 25.0 25.0 50.0
2000-2009 120 25.0 25.0 75.0
2010-2019 120 25.0 25.0 100.0
Total 480 100.0 100.0
Document Page
Number of Days in a month
Frequency Percent Valid Percent Cumulative Percent
Valid
28 30 6.3 6.3 6.3
29 10 2.1 2.1 8.3
30 160 33.3 33.3 41.7
31 280 58.3 58.3 100.0
Total 480 100.0 100.0
b) Descriptive Statistics
Decade
Descriptives
Decades Statistic Std. Error
Total
Rainfall
1980-1989
Mean 179.860 10.3304
Median 155.350
Variance 12806.126
Std. Deviation 113.1642
Minimum 22.6
Maximum 568.6
1990-1999
Mean 169.989 10.0176
Median 159.300
Variance 12042.316
Std. Deviation 109.7375
Minimum 15.4
Maximum 502.7
2000-2009
Mean 193.718 11.3861
Median 164.650
Variance 15557.245
Std. Deviation 124.7287
Minimum 8.4
Maximum 765.9
2010-2019
Mean 161.582 9.0287
Median 143.800
Variance 9782.006
Std. Deviation 98.9040
Minimum .2
Maximum 513.2
Document Page
The table above shows the descriptive statistics of total rainfall in four decades. For
instance, during 2010 to 2019 the mean total rain fall was 161.58 with a standard deviation of
98.90. Consequently, during that decade the maximum total rainfall recorded was 513.2 whereas
the minimum total rainfall was 0.2. Moreover, the table above shows that 2000 to 2009 recorded
the highest total rainfall whereas 2010 to 2019 reported the least rainfall
Months
Descriptives
The Month Statistic Std. Error
TotalRainfall
Apr
Mean 154.933 10.6946
Std. Deviation 67.6385
Minimum 43.1
Maximum 311.6
Aug
Mean 146.765 11.3080
Std. Deviation 71.5180
Minimum 11.8
Maximum 327.3
Dec
Mean 314.658 22.1250
Std. Deviation 139.9309
Minimum 62.9
Maximum 765.9
Feb Mean 109.660 16.5491
Variance 10954.923
Std. Deviation 104.6658
tabler-icon-diamond-filled.svg

Paraphrase This Document

Need a fresh take? Get an instant paraphrase of this document with our AI Paraphraser
Document Page
Minimum .2
Maximum 470.4
Jan
Mean 226.873 24.2781
Std. Deviation 153.5481
Minimum 15.4
Maximum 600.9
Jul
Mean 145.768 11.3062
Std. Deviation 71.5067
Minimum 12.2
Maximum 305.4
Jun
Mean 130.393 10.0228
Std. Deviation 63.3900
Minimum 21.8
Maximum 265.8
Mar
Mean 155.785 16.3395
Std. Deviation 103.3399
Minimum 6.2
Maximum 361.3
May
Mean 168.738 11.8604
Std. Deviation 75.0119
Minimum 41.6
Maximum 370.8
Nov
Mean 251.763 16.6301
Std. Deviation 105.1777
Minimum 53.5
Maximum 508.4
Oct
Mean 163.350 13.5344
Std. Deviation 85.5992
Minimum 10.8
Maximum 351.4
Sep
Mean 146.765 14.6452
Std. Deviation 92.6241
Minimum 22.8
Maximum 440.4
The table above shows the descriptive statistics of total rainfall in 12 months. For
instance, September recorded a mean total rain fall was 146.76 with a standard deviation of
92.62. Moreover, the table above shows that December recorded the highest total rainfall
whereas February reported the least rainfall.
Document Page
Years
The graph above shows the descriptive statistics of total rainfall in 40 years, whereby it is
evident that 2011 recorded the highest rainfall whereas 2015 recorded the least total rainfall.
Question 2
a) Z score
i) sample mean and standard deviation
Zscore (TotalRainfall)
Frequency Percent Valid Percent Cumulative
Percent
Valid -1.56798 1 .2 .2 .2
-1.51455 1 .2 .2 .4
-1.51366 1 .2 .2 .6
-1.49496 1 .2 .2 .8
-1.47359 1 .2 .2 1.0
-1.46469 1 .2 .2 1.3
-1.46112 1 .2 .2 1.5
-1.43797 1 .2 .2 1.7
-1.43263 1 .2 .2 1.9
2.61894 1 .2 .2 98.1
2.65367 1 .2 .2 98.3
2.81395 1 .2 .2 98.5
2.90656 1 .2 .2 98.8
2.95731 1 .2 .2 99.0
3.00006 1 .2 .2 99.2
Document Page
3.49337 1 .2 .2 99.4
3.78098 1 .2 .2 99.6
3.85311 1 .2 .2 99.8
5.25024 1 .2 .2 100.0
ii) Respective monthly means and standard deviations
ZTotal_Per_Month
Frequency Percent Valid Percent Cumulative Percent
Valid
-8.01 1 .2 .2 .2
-7.69 1 .2 .2 .4
-5.56 1 .2 .2 .6
-4.73 1 .2 .2 .8
-4.52 1 .2 .2 1.0
-4.29 1 .2 .2 1.3
-4.24 1 .2 .2 1.5
-4.11 1 .2 .2 1.7
-3.97 1 .2 .2 1.9
-3.96 1 .2 .2 2.1
5.05 1 .2 .2 98.1
5.38 1 .2 .2 98.3
5.39 1 .2 .2 98.5
5.46 1 .2 .2 98.8
5.65 1 .2 .2 99.0
5.98 1 .2 .2 99.2
6.34 1 .2 .2 99.4
6.89 1 .2 .2 99.6
9.36 1 .2 .2 99.8
14.35 1 .2 .2 100.0
b) Interpreting Z-Score
As evident, (ii) reported higher ranges of Z-score values compared to (i). The
above difference is linked to the number of sample used to compute the z score,
whereby (i) used 480 whereas (ii) used 40 as the sample size.
c) Prediction
i) Probability that the Total Rainfall for January 2020 is 280mm or higher
tabler-icon-diamond-filled.svg

Secure Best Marks with AI Grader

Need help grading? Try our AI Grader for instant feedback on your assignments.
Document Page
Z= x μ
σ
n
X = 280
μ = 226.873
σ = 153.54
n = 40
Z=280226.873
153.54
40
=2.188
P(2.188)=0.9856
1 0.9856=0.0144
Therefore, the probability that the Total Rainfall for January 2020 is 280mm or higher
is given as 0.0144
ii) Range for Total Rainfall for the middle 80% of all possible values.
CI =μ ± Z α
2
SE
α = 1 – 0.8 = 0.2
α/2 = 0.1
Z_(α/2) (0.1) = 1.28
μ = 176.287
SE = 5.12
CI =176.28 ±1.285.12=169.72 ,182.83
Therefore, the range for Total Rainfall for the middle 80% of all possible values. Falls
within 169.72 and 182.83
Question 3
a) Descriptive statistics for Number of Days that Rained separately by Months of a Year
Document Page
Descriptives
The Month Statistic Std. Error
Number of Days that
rained in that month Apr
Mean 14.48 .577
Std. Deviation 3.651
Minimum 4
Maximum 21
Document Page
Aug
Mean 13.48 .608
Std. Deviation 3.843
Minimum 4
Maximum 21
Dec
Mean 18.88 .540
Std. Deviation 3.413
Minimum 11
Maximum 25
Feb
Mean 8.38 .791
Std. Deviation 5.001
Minimum 1
Maximum 22
Jan
Mean 13.43 .843
Std. Deviation 5.330
Minimum 3
Maximum 25
Jul
Mean 13.43 .613
Std. Deviation 3.876
Minimum 6
Maximum 21
Jun
Mean 12.50 .480
Std. Deviation 3.038
Minimum 4
Maximum 19
Mar
Mean 12.13 .851
Std. Deviation 5.384
Minimum 2
Maximum 22
May
Mean 13.80 .549
Std. Deviation 3.473
Minimum 6
Maximum 23
Nov
Mean 18.80 .582
Std. Deviation 3.681
Minimum 11
Maximum 27
Oct Mean 15.03 .707
Std. Deviation 4.469
Minimum 5
Maximum 21
tabler-icon-diamond-filled.svg

Paraphrase This Document

Need a fresh take? Get an instant paraphrase of this document with our AI Paraphraser
Document Page
Sep
Mean 13.18 .687
Std. Deviation 4.344
Minimum 3
Maximum 22
The table above shows the descriptive statistics of total rainfall in 12 months. For
instance, September recorded a mean number of days that rained of 13.18 with a standard
deviation of 4.344. Moreover, the table above shows that December recorded the highest
numbers of days that rained whereas February reported the least number of days. Therefore, the
wettest and driest months defined by Number of Days that Rained are the same as the wettest
and driest months defined by Total Rainfall.
b) Examine the appropriateness
Among, the 2 measures Total rainfall is the most appropriate measures of rainfall since it
incorporated the quantity of rain, however number of days does not quantify whether the rainfall
was immense or a little hence total rainfall will exhibit the actual distribution.
c) Identify one issue with using either Total Rainfall
As exhibited in the box plot below the Total rainfall has numerous outliers thus the
results may be biased hence to curb the issue it is recommendable to transform the variable to its
natural logarithms.
Document Page
Transformed Descriptive
Descriptives
The Month Statistic Std. Error
LN_Total_Rainfal
l Apr
Mean 4.9349 .07839
Std. Deviation .49578
Minimum 3.76
Maximum 5.74
Aug
Mean 4.8318 .10146
Std. Deviation .64170
Minimum 2.47
Maximum 5.79
Dec
Mean 5.6438 .07941
Std. Deviation .50225
Minimum 4.14
Maximum 6.64
Feb
Mean 4.1511 .21582
Std. Deviation 1.36499
Minimum -1.61
Maximum 6.15
Jan Mean 5.1485 .13144
Std. Deviation .83131
Document Page
Minimum 2.73
Maximum 6.40
Jul
Mean 4.8179 .10634
Std. Deviation .67256
Minimum 2.50
Maximum 5.72
Jun
Mean 4.7401 .08693
Std. Deviation .54982
Minimum 3.08
Maximum 5.58
Mar
Mean 4.7795 .13112
Std. Deviation .82930
Minimum 1.82
Maximum 5.89
May
Mean 5.0246 .07601
Std. Deviation .48073
Minimum 3.73
Maximum 5.92
Nov
Mean 5.4293 .07601
Std. Deviation .48074
Minimum 3.98
Maximum 6.23
Oct
Mean 4.9143 .11114
Std. Deviation .70292
Minimum 2.38
Maximum 5.86
Sep
Mean 4.7812 .11085
Std. Deviation .70110
Minimum 3.13
Maximum 6.09
Notably, despite transforming the values it is evident that December recorded the highest
total rainfall at 5.64 whereas February reported the least total rainfall at 4.15.
chevron_up_icon
1 out of 16
circle_padding
hide_on_mobile
zoom_out_icon
logo.png

Your All-in-One AI-Powered Toolkit for Academic Success.

Available 24*7 on WhatsApp / Email

[object Object]