Metro Rail Financial Project: Detailed Economic and Financial Report
VerifiedAdded on 2023/06/07
|42
|6440
|70
Report
AI Summary
This report provides a comprehensive financial analysis of the Metro Rail Project, exploring alternative funding sources and the application of 'Value Capture' methodologies. It assesses project benefits, revenues, and their impact on beneficiaries, incorporating financial techniques such as Net Present Value (NPV), Profitability Index (PI), and Internal Rate of Return (IRR). The analysis includes calculations of NPV and PI, along with a factor analysis identifying key factors influencing commuter preferences towards the Delhi Metro. The report also examines the effect of demographic factors like age and gender on these preferences, utilizing statistical tools such as Cronbach’s Alpha and Independent Sample T-Tests. The findings contribute to understanding the economic viability and social impact of the Metro Rail Project, offering insights for decision-making and business case development.

METRO RAIL FINANCIAL PROJECT
Student Name:
Student ID Number:
Subject Title:
AQF Level:
Word count: 4750
1
Student Name:
Student ID Number:
Subject Title:
AQF Level:
Word count: 4750
1
Paraphrase This Document
Need a fresh take? Get an instant paraphrase of this document with our AI Paraphraser
METRO RAIL FINANCIAL PROJECT
Executive Summary
Alternative funding sources, beyond commonwealth and state government funding processes and debt
funding,mayberequiredtoassistalllevelsofgovernmentinthedeliveryofnew,improvedorreplacement
publicinfrastructuretoimprovethelivabilityandcompetitivenessofourcity.
TherehavebeenmanyexamplesofalternativefundingforinfrastructureinIndia overthepast40 years.
TheCityLoopfundingwasamixofbudgetfunding,anduser/beneficiarypays
charges.Morerecently,thisbeneficiarypaysmodelhasbeentermedas‘ValueCapture’.Valuecapture
occurswhenrevenuescollectedbygovernmentsofalllevels,orbypartiesworkingwithgovernments,can
bedirectlylinkedtotheadditionalbenefitsreceivedbythosebeneficiariesfromnew,improvedor
replacementinfrastructure.
TheCityhasundertakentoinvestigate‘beneficiarypays’fundinginconnectionwiththeMetroRailProject(DMRP),includin
ginitiallytoidentifyanappropriateframework.This
approachtoprojectfundingisamethodofsharingtheresponsibilityofpayingforinfrastructureamongst
thosebeneficiarieswhostandtogainthemostfromnew,improvedorreplacementinfrastructure.
AneffectiveassessmentofaValueCaptureProjectbenefitsandrevenuesshouldgeneraterevenuethatis credible and clearly
identifiable as a benefit to the beneficiaries who can make best use of the
infrastructure.Thecalculationshouldbeusefulfordecisionmakingandeasilyabletobeintegratedintoa
businesscase.Thechoiceoftools,methodsandapproachesthatareappropriateforconductingan
effectivecalculationofaValueCaptureProjectbenefitsandrevenuesdependonarangeofconsiderations.
2
METRO RAIL FINANCIAL PROJECT
Contents
Executive Summary.................................................................................... 2
Introduction:............................................................................................ 4
Research Objectives:................................................................................... 4
Hypothesis.............................................................................................. 4
Sample and Data Collection:........................................................................... 4
Primary data:.................................................................................................6
Secondary data:............................................................................................6
FINANCIAL ANALYSIS:.............................................................................6
TECHNIQUES OF CAPITAL BUDGETING..........................................................6
Net Present Value:.........................................................................................................................................................6
ProfitabilityIndex:..........................................................................................................................................................7
Internal Rate ofReturn:..................................................................................................................................................7
CALCULATION OF NPV AND PI.......................................................................8
CALCULATION OF FINANCIAL IRR...................................................................9
FACTOR ANALYSIS CONDUCTED:...................................................................9
Factor Analysis............................................................................................11
EFFECT OF AGE ON VARIOUS FACTORS OF PREFERENCE TOWARDS METRO......20
Risk factor Analysis............................................................................24
Value capture analyses focus on three areas:.............................................24
A Value CaptureFramework.........................................................................25
ElementsofaValueCaptureFramework.........................................................26
Elements of a Value Capture Framework....................................................27
ContextoftheValueCaptureProject..................................................................28
Understandingthebenefitsflowinggreateruseoftheinfrastructure...................................29
COMMERCIAL IN CONFIDENCE................................................................30
EFFECT OF GENDER ON VARIOUS FACTORS OF PREFERENCE TOWARDS METRO. 32
CONCLUSION.......................................................................................36
REFERENCES....................................................................................... 38
3
⊘ This is a preview!⊘
Do you want full access?
Subscribe today to unlock all pages.
Trusted by 1+ million students worldwide
METRO RAIL FINANCIAL PROJECT
Introduction:
The existence of the Delhi Metro project deals with the Revolutionary Transportation system of the Delhi as
capital of India due to which the birth of metro took place mainly in the tracks of the urban areas leading to the
construction of the big Railway system and Railway lines. Since then over 130 cities were developed in Europe
and Ecosystem was established in many parts of Asia and America. Station of Delhi Metro it was operated by
DMRC that is Delhi Metro Rail Corporation Limited. Work was started at the base of November 2010 where
DMRC try to operate around 2800 trips daily between 6 a.m. To 11 p.m. It was during that period that the four
coaches were laid in order to increase the passengers day by day and several coaches were also added in order to
have the greater network for the commuter participation. Picture perception also late for the development of the
new railway tracks in Government of India also initiated the Yellow line in the year 2004 w line in 2005 and the
branch line in the year 2009 as well as the green and pilot lines in the year 2010 and finally the Delhi Airport
Metro Expressway was commenced in the year 2011(Zhang, 2018)..
Research Objectives:
Objective 1: To study the financial analysis of Delhi Metro.
Objective 2: To study the reasons contributing to increase in ridership of Delhi Metro.
Objective 3: To study the different profile of commuters of Delhi Metro.
Hypothesis
H01: There is no significant difference between the mean scores of various factors of preference towards metro
for different agegroups(Zhang & Liao, 2018).
H02: There is no considerable difference between the two major aspects- mean scores of various factors of
preference towards metro for different genders(Zhang & Liao, 2018).
Sample and Data Collection:
4
Paraphrase This Document
Need a fresh take? Get an instant paraphrase of this document with our AI Paraphraser
METRO RAIL FINANCIAL PROJECT
Primary data:
Before starting the data collection for the study the questionnaire was pre-tested to assess the validity and
reliability. Also, any possibility of any weakness can also be ruled out at this stage. The statements of the
questionnaire were discussed with the experts of marketing research and the suggestions given by them were
incorporated i.e. some statements were discarded. After the final approval from experts, pilot study was
undertaken on 65 respondents to ensure the appropriateness of the statements. The questionnaire was revised
and the final questionnaire was administered to 650 respondents to get a targeted 601 valid responses (92.46%
response). The data was analyzed by software namely SPSS version 19.0 and Descriptive Analysis, Independent
sample T-Test was used to test the hypotheses and factor analysis was used to check out the factors(Zhang &
Liao, 2018).
Secondary data:
The type of data has been collected from different government offices.
Factor Analysis was used on 41 items for determining the various influencing factors for Delhi Metro. The
hypotheses to assess the impact of demographic characteristics of consumers on their preference of Delhi Metro
has been tested using Independent Sample T-Test and One- Way ANOVA(Zhang, 2018)..
FINANCIAL ANALYSIS:
TECHNIQUES OF CAPITAL BUDGETING
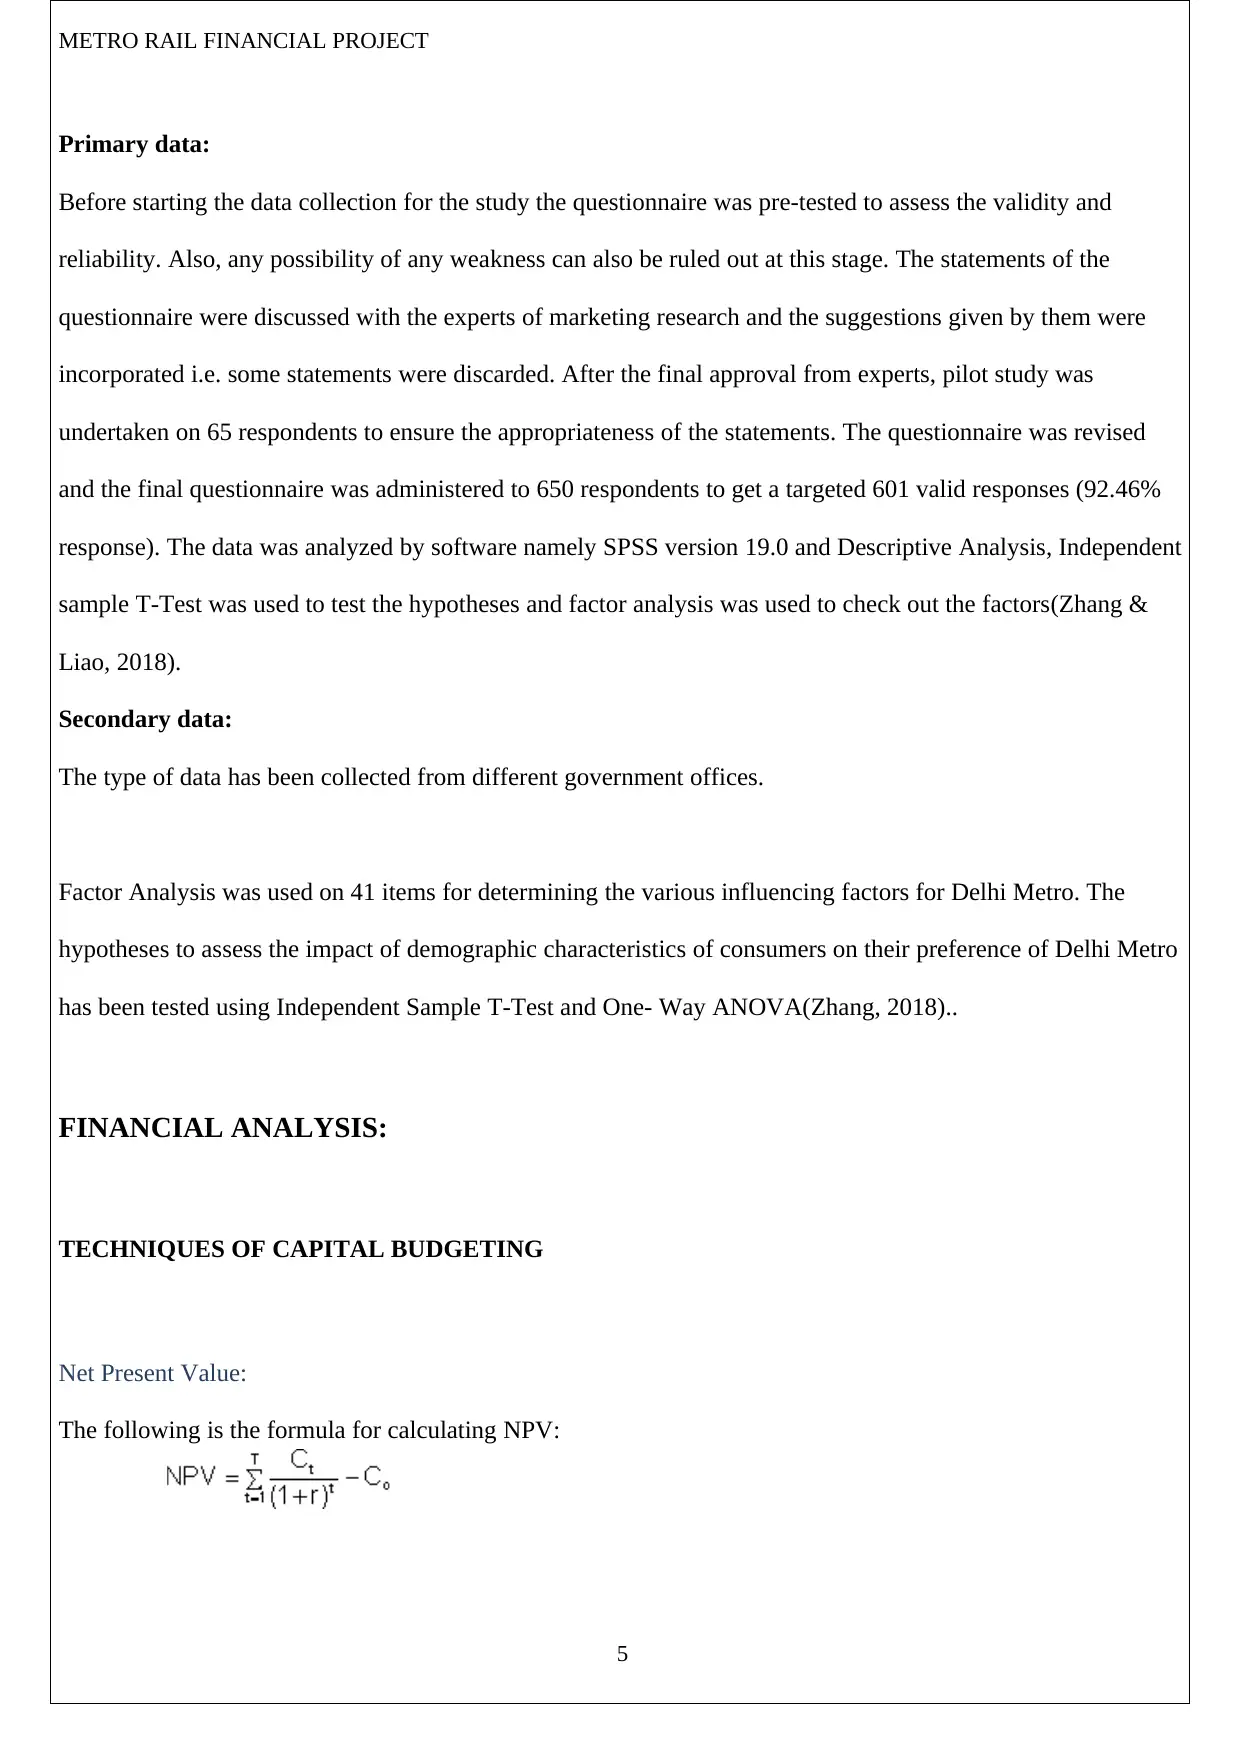
Net Present Value:
The following is the formula for calculating NPV:
5
Primary data:
Before starting the data collection for the study the questionnaire was pre-tested to assess the validity and
reliability. Also, any possibility of any weakness can also be ruled out at this stage. The statements of the
questionnaire were discussed with the experts of marketing research and the suggestions given by them were
incorporated i.e. some statements were discarded. After the final approval from experts, pilot study was
undertaken on 65 respondents to ensure the appropriateness of the statements. The questionnaire was revised
and the final questionnaire was administered to 650 respondents to get a targeted 601 valid responses (92.46%
response). The data was analyzed by software namely SPSS version 19.0 and Descriptive Analysis, Independent
sample T-Test was used to test the hypotheses and factor analysis was used to check out the factors(Zhang &
Liao, 2018).
Secondary data:
The type of data has been collected from different government offices.
Factor Analysis was used on 41 items for determining the various influencing factors for Delhi Metro. The
hypotheses to assess the impact of demographic characteristics of consumers on their preference of Delhi Metro
has been tested using Independent Sample T-Test and One- Way ANOVA(Zhang, 2018)..
FINANCIAL ANALYSIS:
TECHNIQUES OF CAPITAL BUDGETING
Net Present Value:
The following is the formula for calculating NPV:
5
METRO RAIL FINANCIAL PROJECT
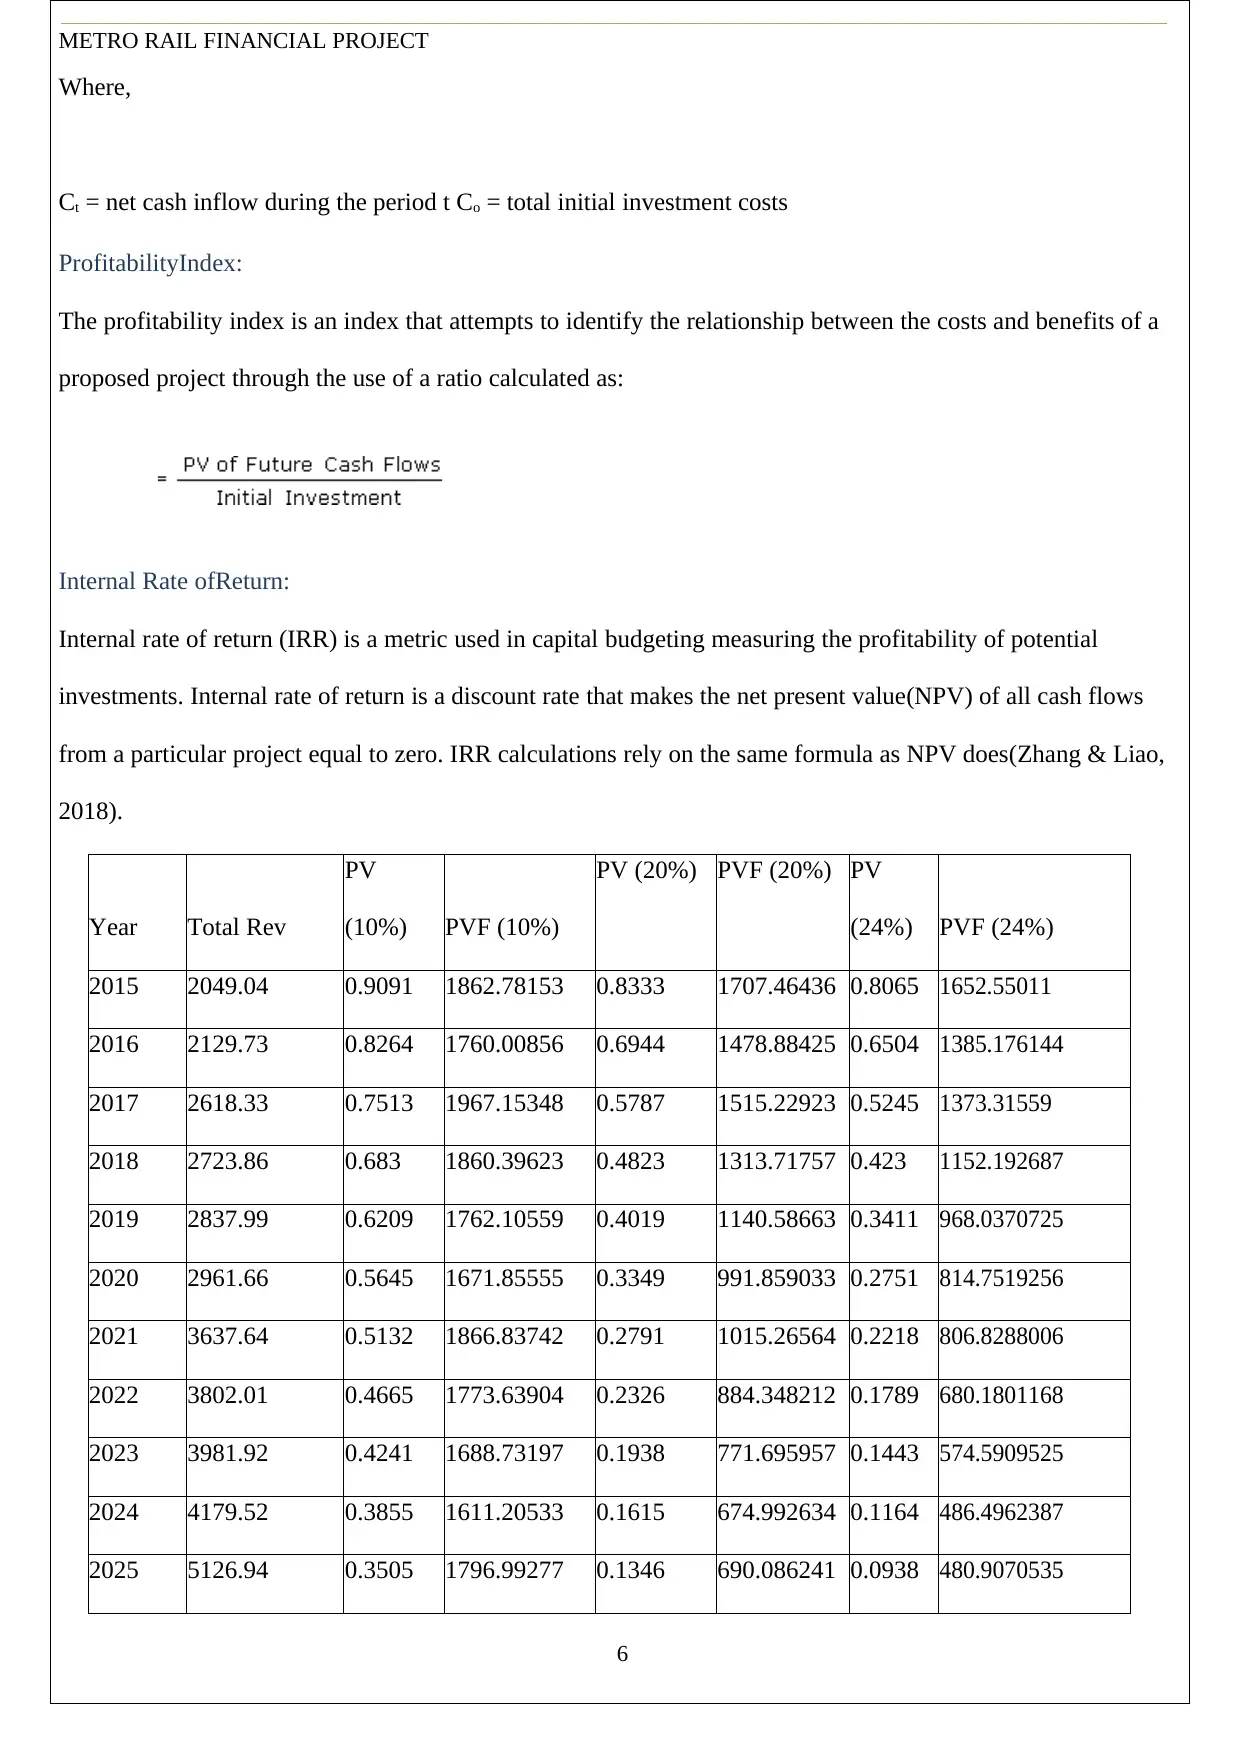
Where,
Ct = net cash inflow during the period t Co = total initial investment costs
ProfitabilityIndex:
The profitability index is an index that attempts to identify the relationship between the costs and benefits of a
proposed project through the use of a ratio calculated as:
Internal Rate ofReturn:
Internal rate of return (IRR) is a metric used in capital budgeting measuring the profitability of potential
investments. Internal rate of return is a discount rate that makes the net present value(NPV) of all cash flows
from a particular project equal to zero. IRR calculations rely on the same formula as NPV does(Zhang & Liao,
2018).
Year Total Rev
PV
(10%) PVF (10%)
PV (20%) PVF (20%) PV
(24%) PVF (24%)
2015 2049.04 0.9091 1862.78153 0.8333 1707.46436 0.8065 1652.55011
2016 2129.73 0.8264 1760.00856 0.6944 1478.88425 0.6504 1385.176144
2017 2618.33 0.7513 1967.15348 0.5787 1515.22923 0.5245 1373.31559
2018 2723.86 0.683 1860.39623 0.4823 1313.71757 0.423 1152.192687
2019 2837.99 0.6209 1762.10559 0.4019 1140.58663 0.3411 968.0370725
2020 2961.66 0.5645 1671.85555 0.3349 991.859033 0.2751 814.7519256
2021 3637.64 0.5132 1866.83742 0.2791 1015.26564 0.2218 806.8288006
2022 3802.01 0.4665 1773.63904 0.2326 884.348212 0.1789 680.1801168
2023 3981.92 0.4241 1688.73197 0.1938 771.695957 0.1443 574.5909525
2024 4179.52 0.3855 1611.20533 0.1615 674.992634 0.1164 486.4962387
2025 5126.94 0.3505 1796.99277 0.1346 690.086241 0.0938 480.9070535
6
⊘ This is a preview!⊘
Do you want full access?
Subscribe today to unlock all pages.
Trusted by 1+ million students worldwide
METRO RAIL FINANCIAL PROJECT
2026 5391.95 0.3186 1717.87645 0.1122 604.977207 0.0757 408.1708964
2027 5687.50 0.2897 1647.66933 0.0935 531.781437 0.061 346.9376221
2028 6017.90 0.2633 1584.51387 0.0779 468.794645 0.0492 296.0808287
2029 7370.57 0.2394 1764.51342 0.0649 478.349711 0.0397 292.6114564
2030 7822.92 0.2176 1702.26709 0.0541 423.219896 0.032 250.333395
Total 28038.5476 14691.2527 11969.16089
Intial
investment
14432 14432 14432
NPV 13606.5476 259.25265 -2462.839111
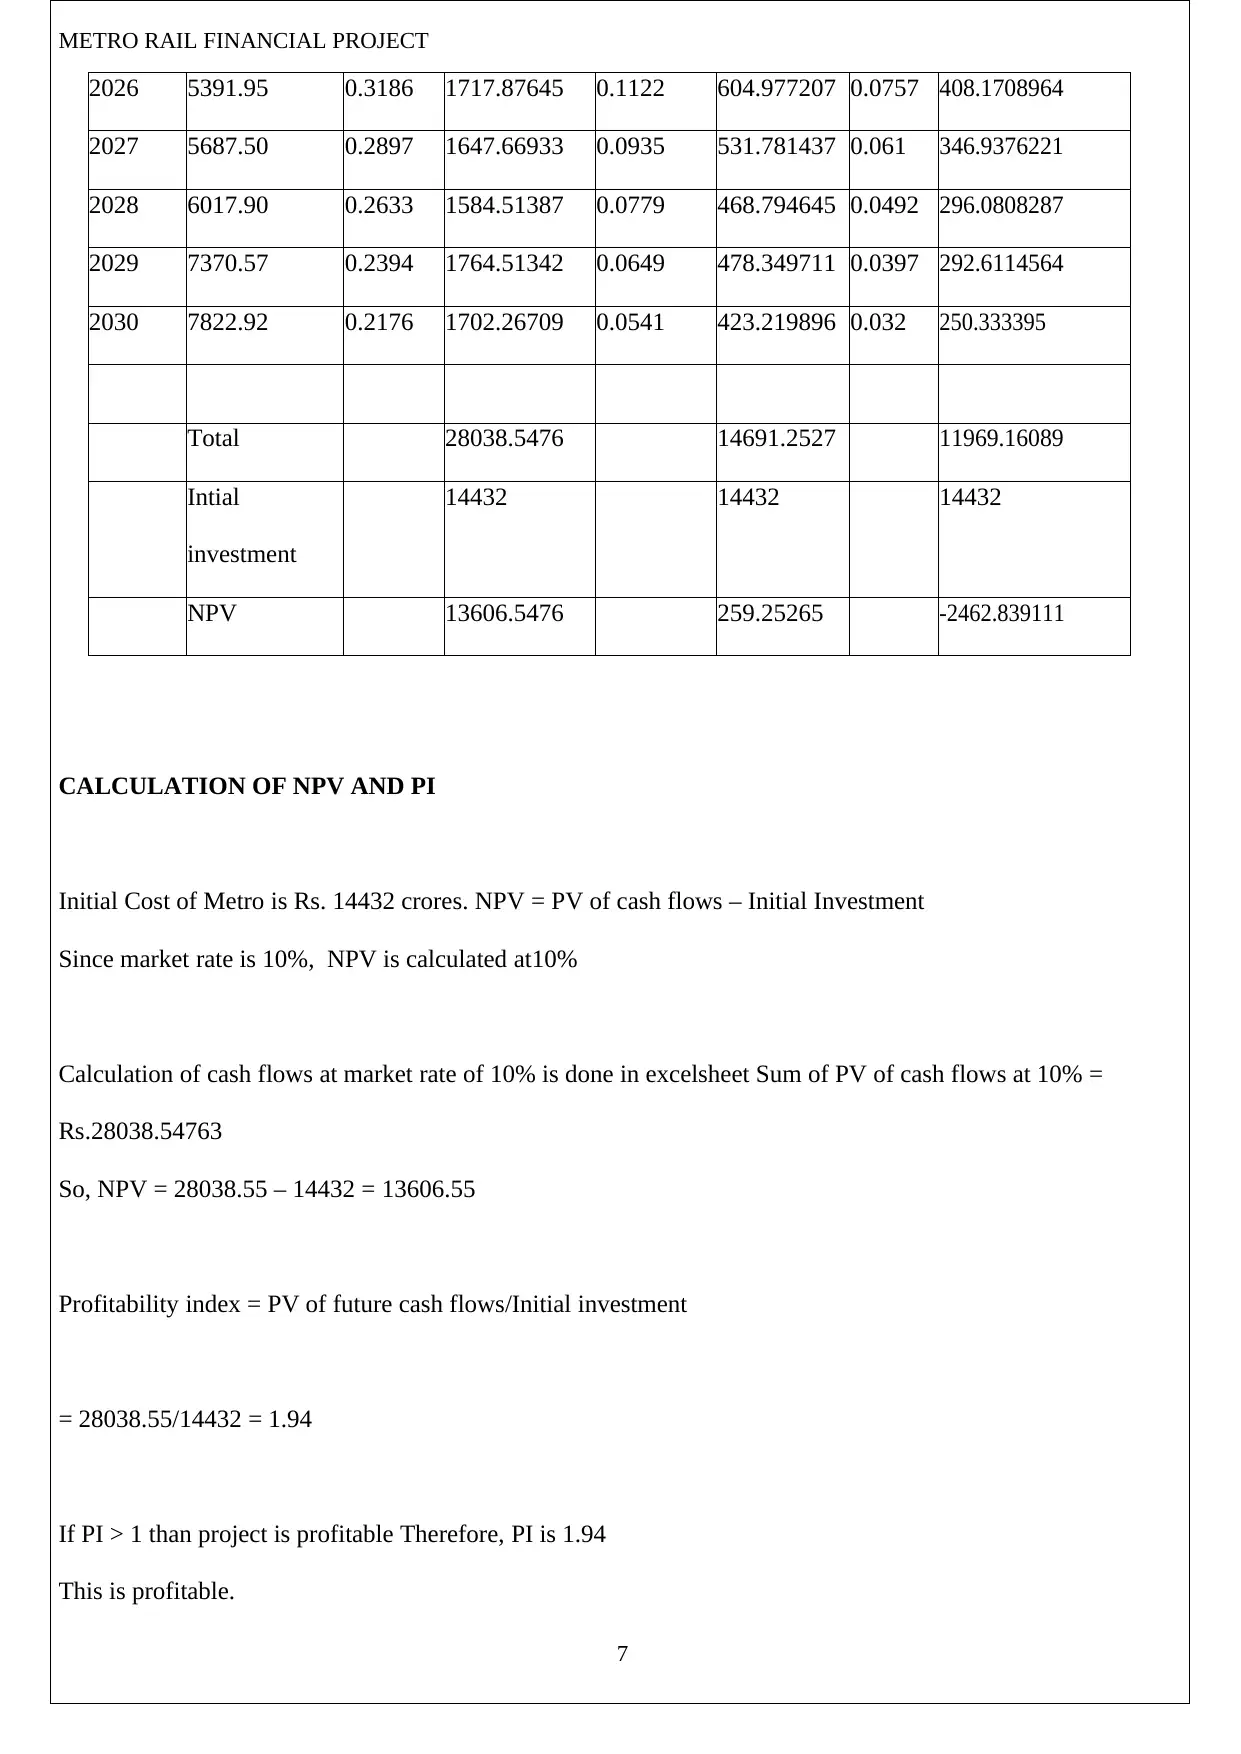
CALCULATION OF NPV AND PI
Initial Cost of Metro is Rs. 14432 crores. NPV = PV of cash flows – Initial Investment
Since market rate is 10%, NPV is calculated at10%
Calculation of cash flows at market rate of 10% is done in excelsheet Sum of PV of cash flows at 10% =
Rs.28038.54763
So, NPV = 28038.55 – 14432 = 13606.55
Profitability index = PV of future cash flows/Initial investment
= 28038.55/14432 = 1.94
If PI > 1 than project is profitable Therefore, PI is 1.94
This is profitable.
7
2026 5391.95 0.3186 1717.87645 0.1122 604.977207 0.0757 408.1708964
2027 5687.50 0.2897 1647.66933 0.0935 531.781437 0.061 346.9376221
2028 6017.90 0.2633 1584.51387 0.0779 468.794645 0.0492 296.0808287
2029 7370.57 0.2394 1764.51342 0.0649 478.349711 0.0397 292.6114564
2030 7822.92 0.2176 1702.26709 0.0541 423.219896 0.032 250.333395
Total 28038.5476 14691.2527 11969.16089
Intial
investment
14432 14432 14432
NPV 13606.5476 259.25265 -2462.839111
CALCULATION OF NPV AND PI
Initial Cost of Metro is Rs. 14432 crores. NPV = PV of cash flows – Initial Investment
Since market rate is 10%, NPV is calculated at10%
Calculation of cash flows at market rate of 10% is done in excelsheet Sum of PV of cash flows at 10% =
Rs.28038.54763
So, NPV = 28038.55 – 14432 = 13606.55
Profitability index = PV of future cash flows/Initial investment
= 28038.55/14432 = 1.94
If PI > 1 than project is profitable Therefore, PI is 1.94
This is profitable.
7
Paraphrase This Document
Need a fresh take? Get an instant paraphrase of this document with our AI Paraphraser
METRO RAIL FINANCIAL PROJECT
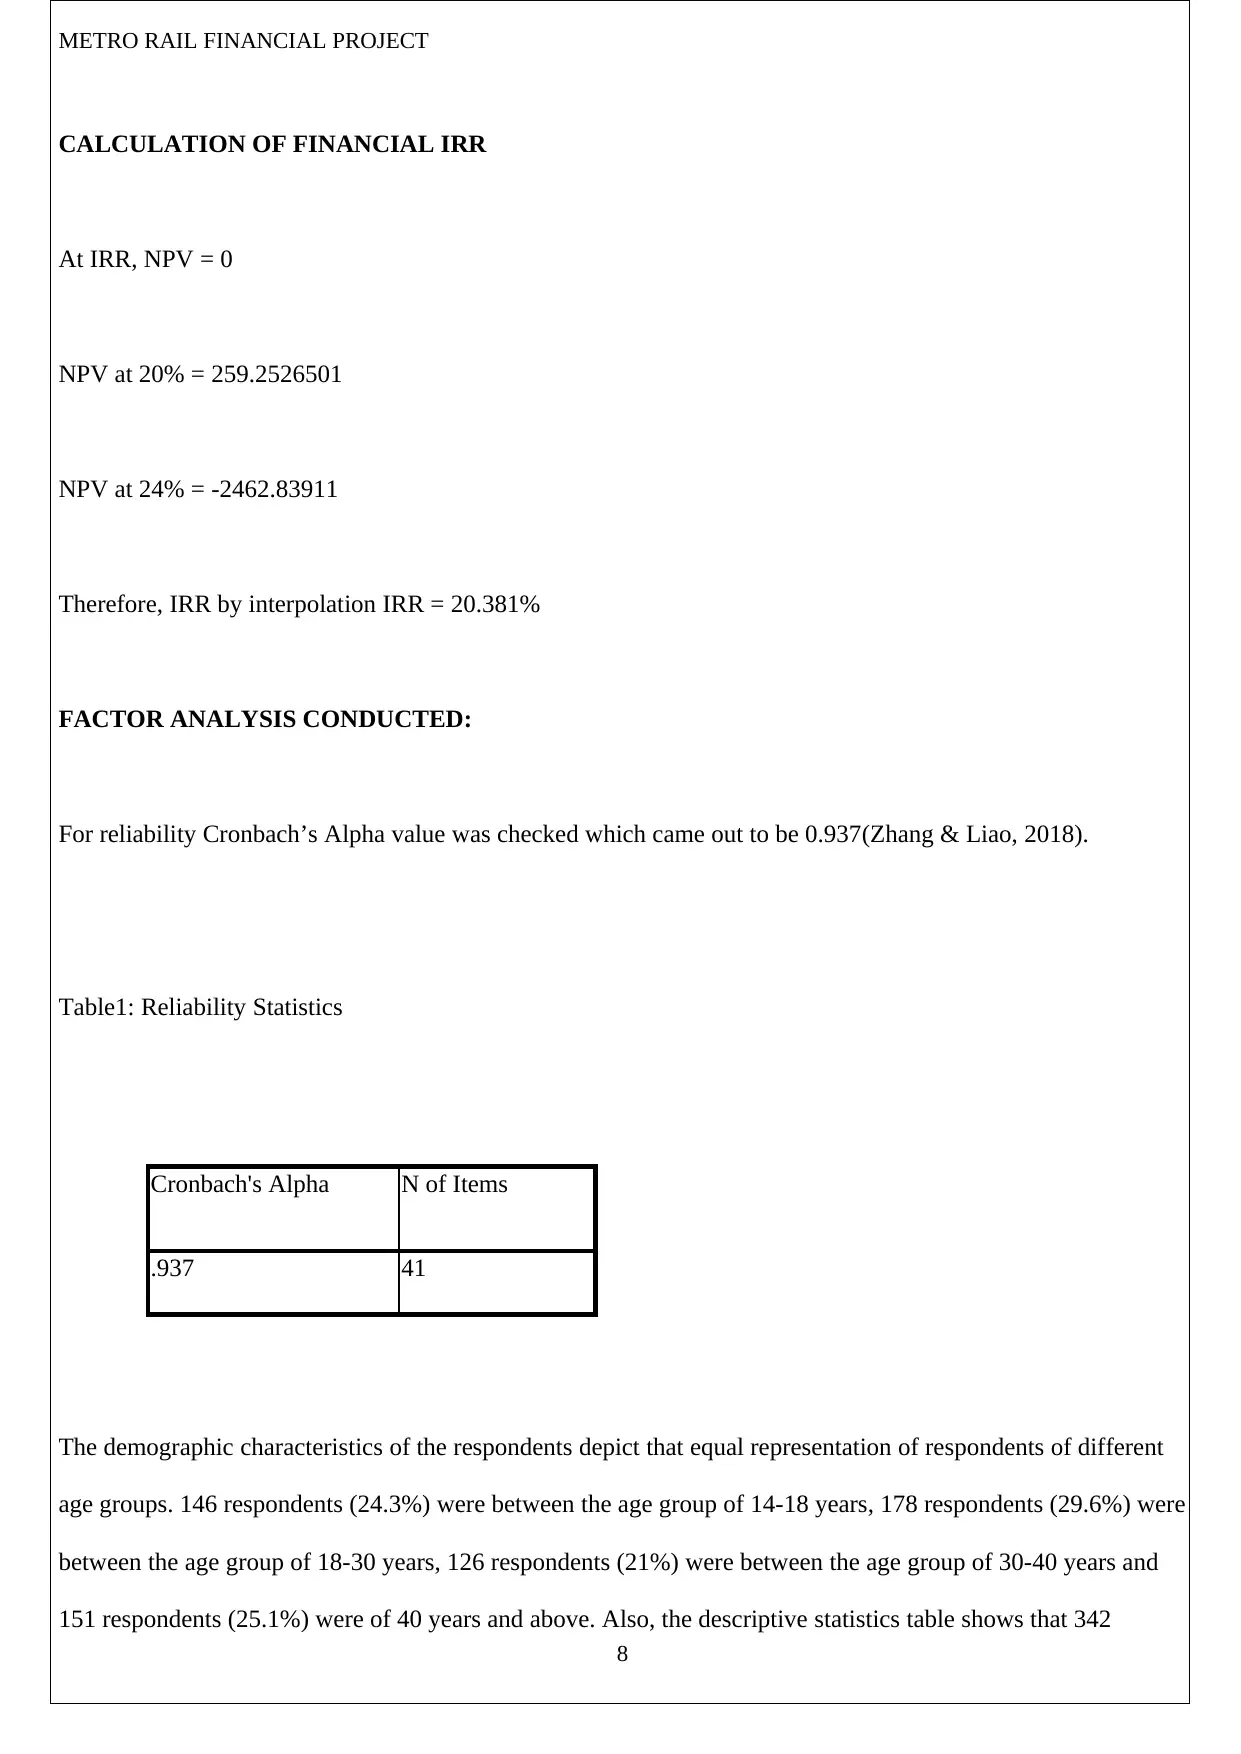
CALCULATION OF FINANCIAL IRR
At IRR, NPV = 0
NPV at 20% = 259.2526501
NPV at 24% = -2462.83911
Therefore, IRR by interpolation IRR = 20.381%
FACTOR ANALYSIS CONDUCTED:
For reliability Cronbach’s Alpha value was checked which came out to be 0.937(Zhang & Liao, 2018).
Table1: Reliability Statistics
Cronbach's Alpha N of Items
.937 41
The demographic characteristics of the respondents depict that equal representation of respondents of different
age groups. 146 respondents (24.3%) were between the age group of 14-18 years, 178 respondents (29.6%) were
between the age group of 18-30 years, 126 respondents (21%) were between the age group of 30-40 years and
151 respondents (25.1%) were of 40 years and above. Also, the descriptive statistics table shows that 342
8

METRO RAIL FINANCIAL PROJECT
respondents (56.9%) were males and 259 respondents (43.1%) were females. Males have a higher representation
in the sample than females(Gulati, 2011).
The study comprise of descriptions and tabular displays to present suitable context for depicting conclusions
from the data collected. Tables prove to be apt method to improvise the method of presentation of the analysis. .
“Factor Analysis” has been used to find out the important factors of preference towards Delhi Metro for the
study by using SPSS Software19.0(Zhang & Liao, 2018).
9
⊘ This is a preview!⊘
Do you want full access?
Subscribe today to unlock all pages.
Trusted by 1+ million students worldwide
METRO RAIL FINANCIAL PROJECT
version. The questionnaire comprised of 6 negative statements and reverse coding was done for negative
statements.
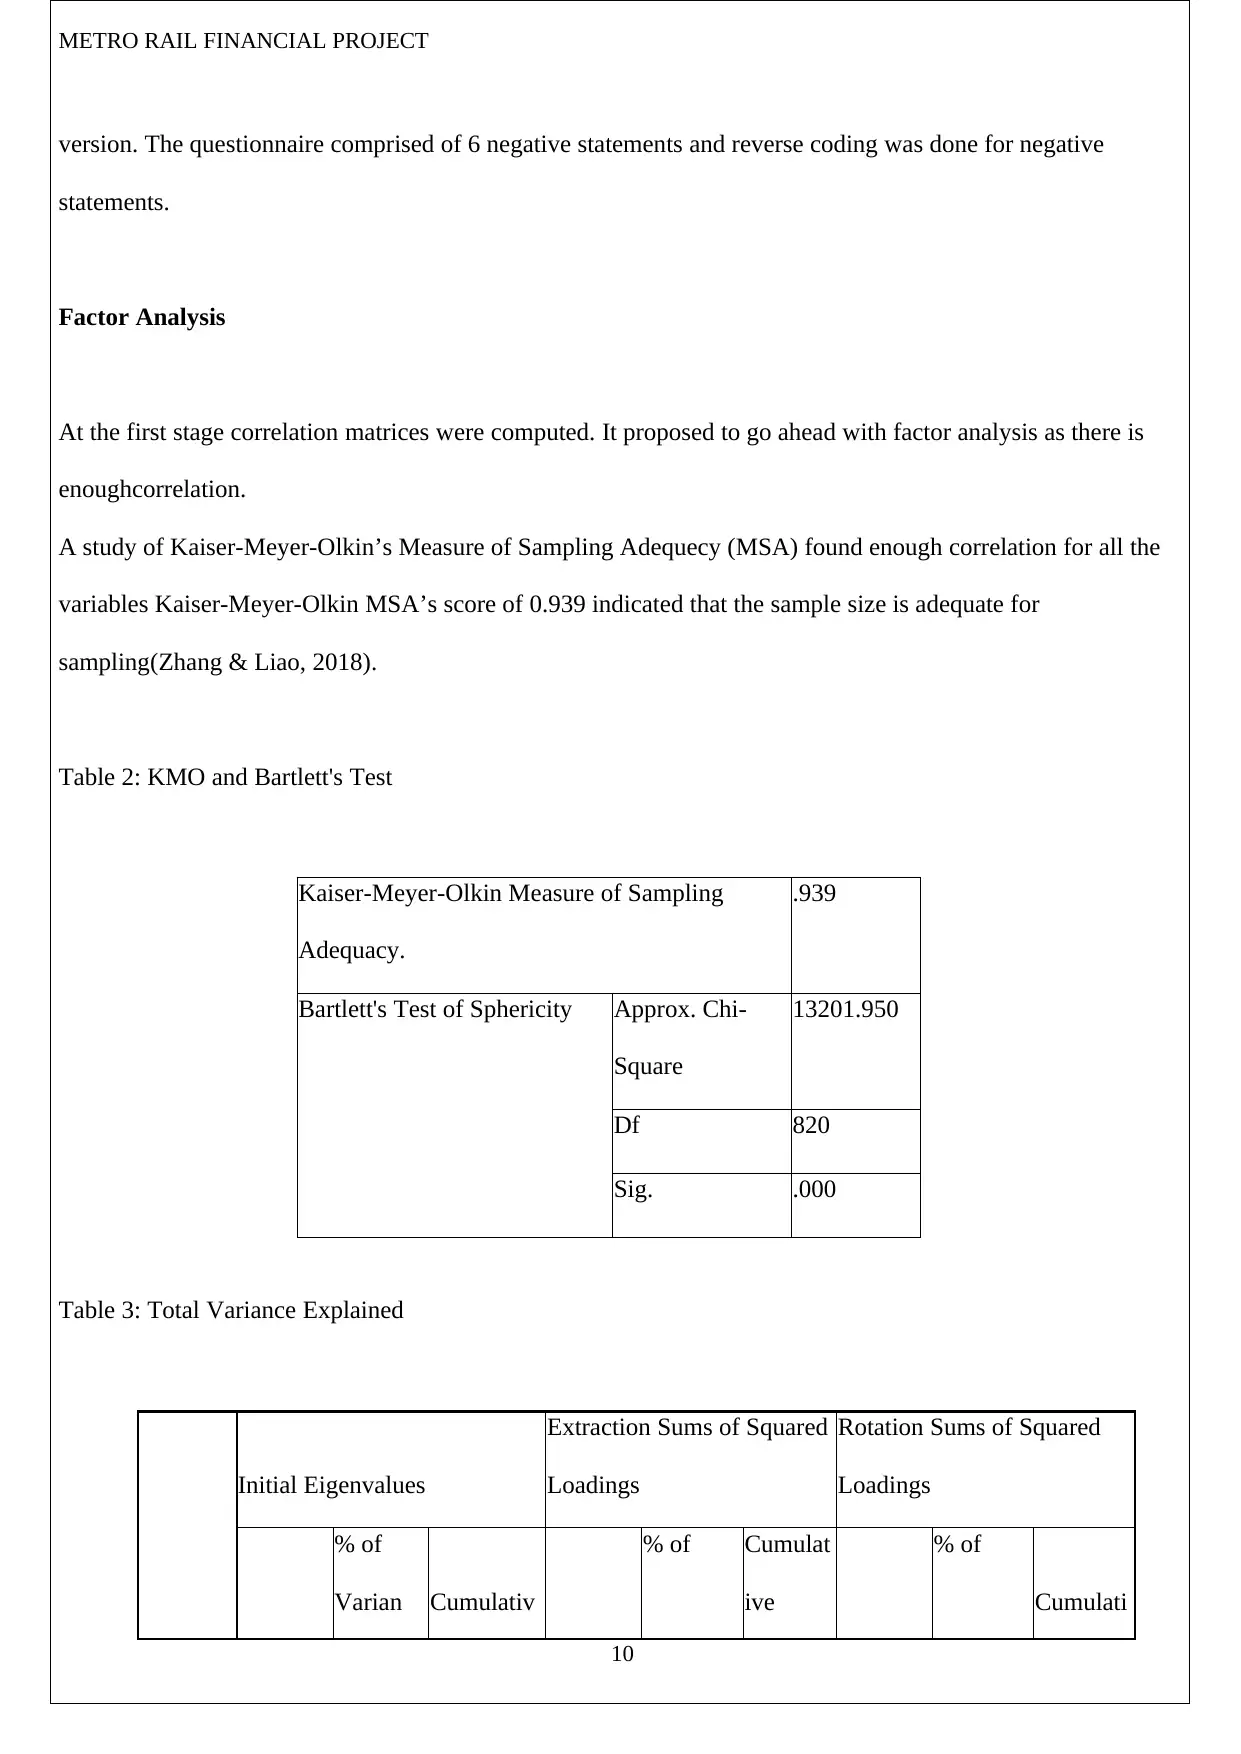
Factor Analysis
At the first stage correlation matrices were computed. It proposed to go ahead with factor analysis as there is
enoughcorrelation.
A study of Kaiser-Meyer-Olkin’s Measure of Sampling Adequecy (MSA) found enough correlation for all the
variables Kaiser-Meyer-Olkin MSA’s score of 0.939 indicated that the sample size is adequate for
sampling(Zhang & Liao, 2018).
Table 2: KMO and Bartlett's Test
Kaiser-Meyer-Olkin Measure of Sampling
Adequacy.
.939
Bartlett's Test of Sphericity Approx. Chi-
Square
13201.950
Df 820
Sig. .000
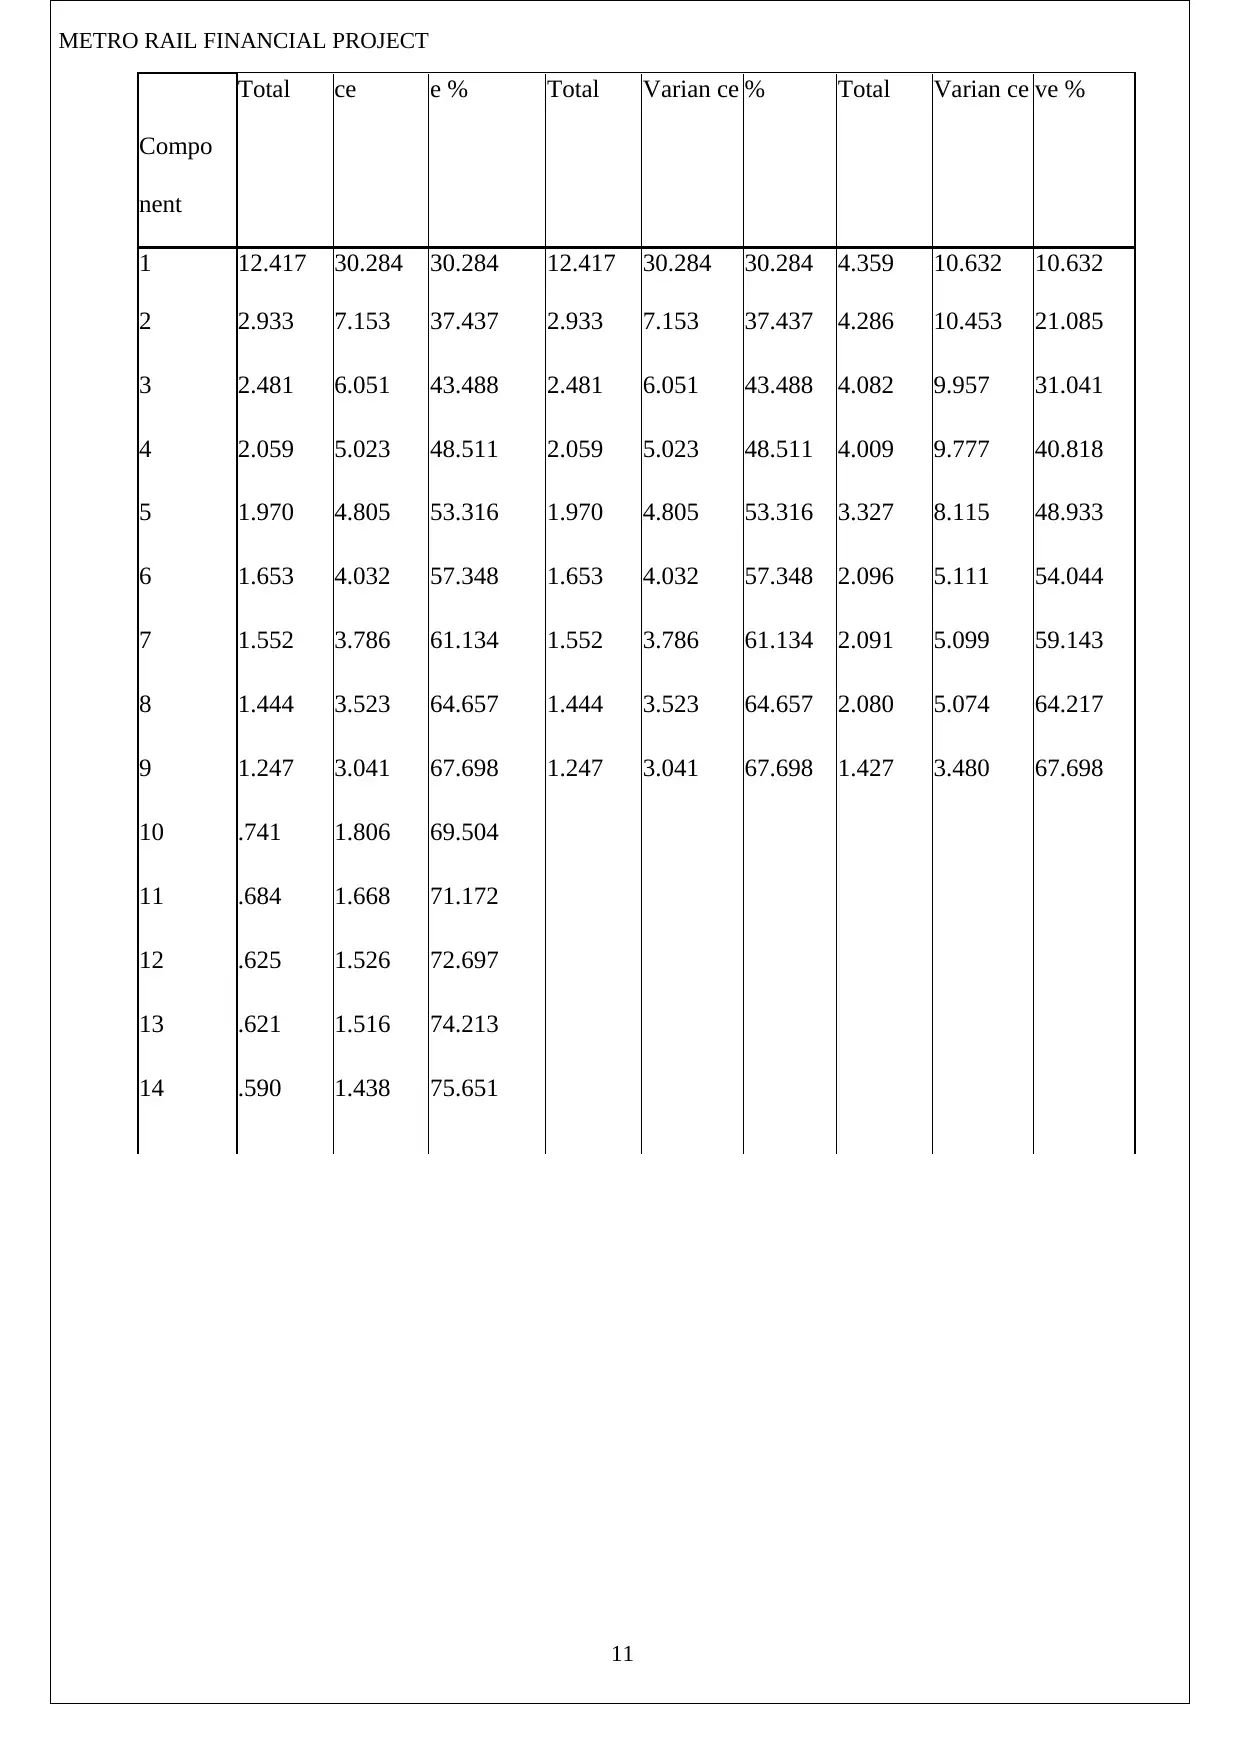
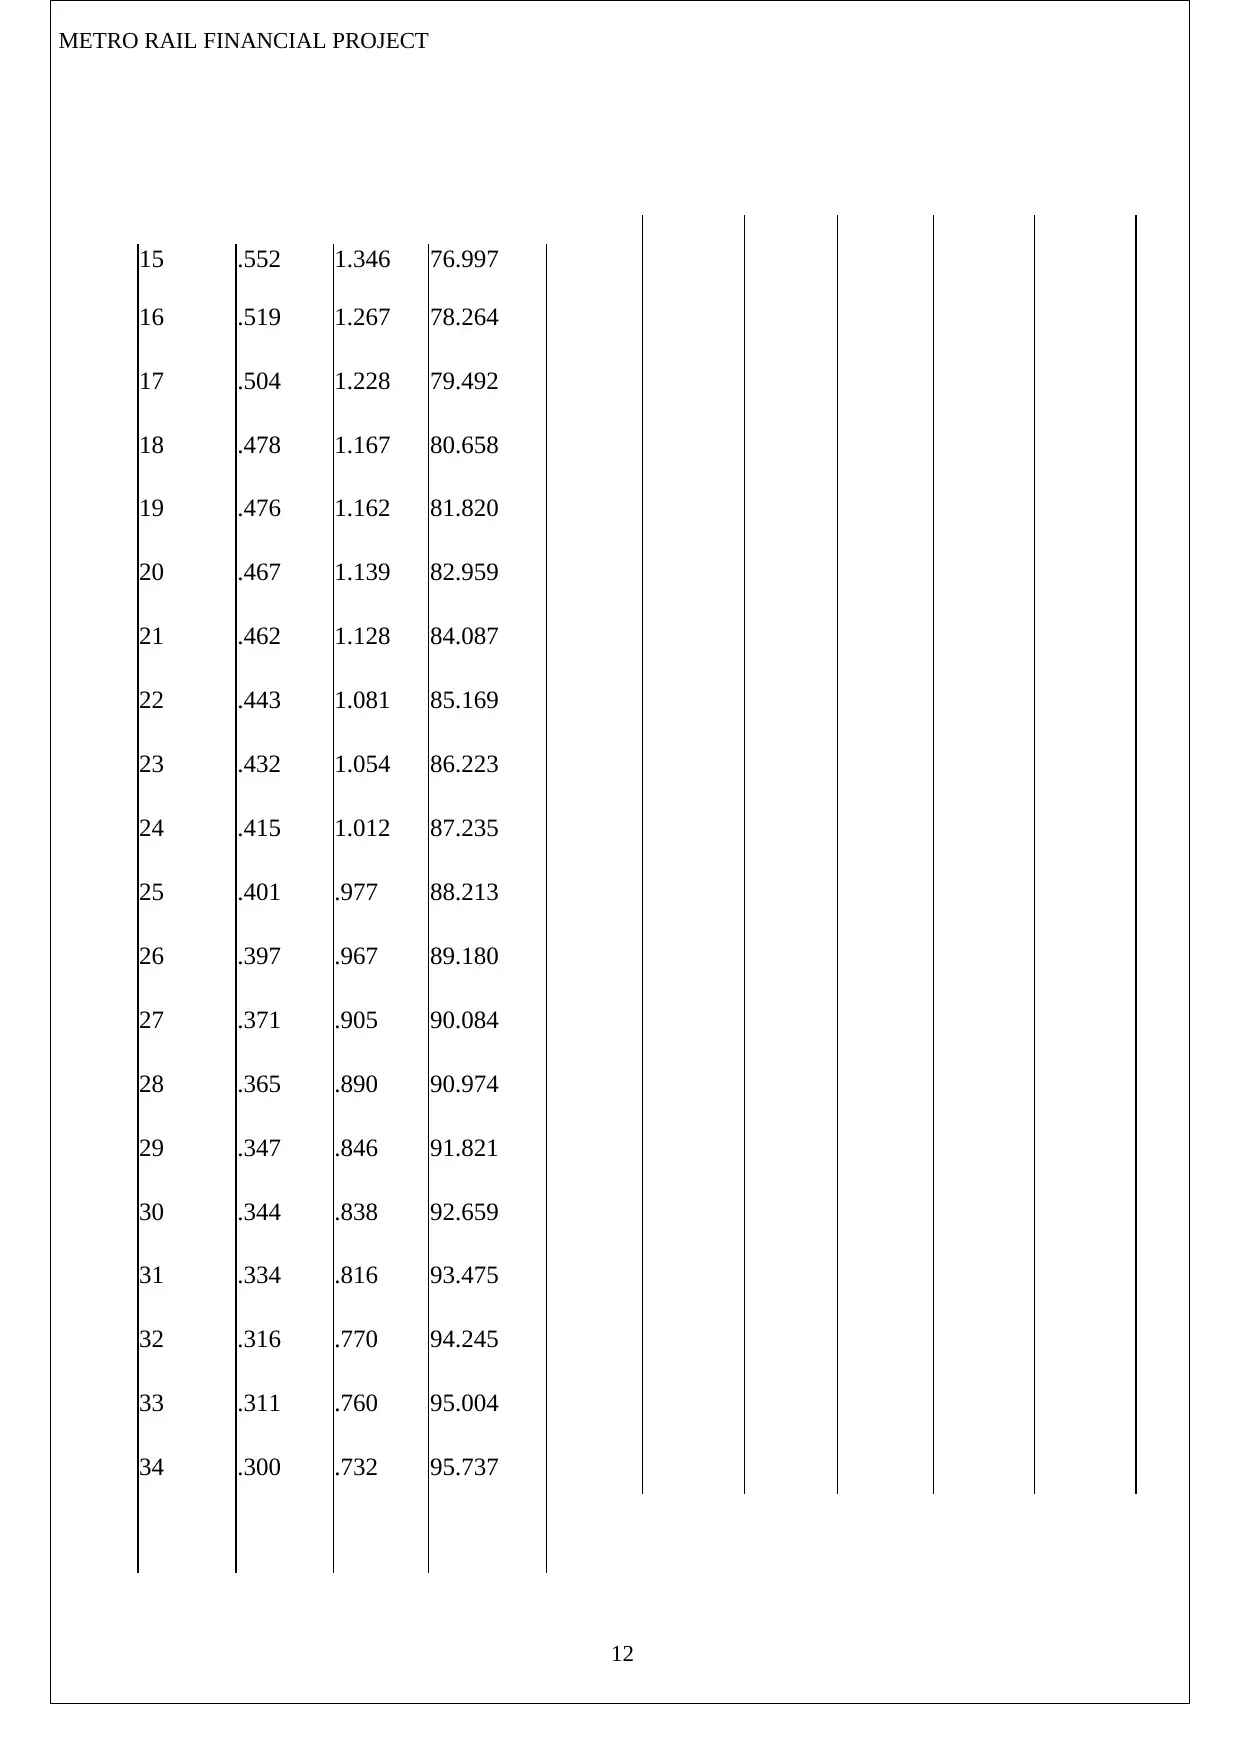
Table 3: Total Variance Explained
Initial Eigenvalues
Extraction Sums of Squared
Loadings
Rotation Sums of Squared
Loadings
% of
Varian Cumulativ
% of Cumulat
ive
% of
Cumulati
10
version. The questionnaire comprised of 6 negative statements and reverse coding was done for negative
statements.
Factor Analysis
At the first stage correlation matrices were computed. It proposed to go ahead with factor analysis as there is
enoughcorrelation.
A study of Kaiser-Meyer-Olkin’s Measure of Sampling Adequecy (MSA) found enough correlation for all the
variables Kaiser-Meyer-Olkin MSA’s score of 0.939 indicated that the sample size is adequate for
sampling(Zhang & Liao, 2018).
Table 2: KMO and Bartlett's Test
Kaiser-Meyer-Olkin Measure of Sampling
Adequacy.
.939
Bartlett's Test of Sphericity Approx. Chi-
Square
13201.950
Df 820
Sig. .000
Table 3: Total Variance Explained
Initial Eigenvalues
Extraction Sums of Squared
Loadings
Rotation Sums of Squared
Loadings
% of
Varian Cumulativ
% of Cumulat
ive
% of
Cumulati
10
Paraphrase This Document
Need a fresh take? Get an instant paraphrase of this document with our AI Paraphraser
METRO RAIL FINANCIAL PROJECT
Compo
nent
Total ce e % Total Varian ce % Total Varian ce ve %
1 12.417 30.284 30.284 12.417 30.284 30.284 4.359 10.632 10.632
2 2.933 7.153 37.437 2.933 7.153 37.437 4.286 10.453 21.085
3 2.481 6.051 43.488 2.481 6.051 43.488 4.082 9.957 31.041
4 2.059 5.023 48.511 2.059 5.023 48.511 4.009 9.777 40.818
5 1.970 4.805 53.316 1.970 4.805 53.316 3.327 8.115 48.933
6 1.653 4.032 57.348 1.653 4.032 57.348 2.096 5.111 54.044
7 1.552 3.786 61.134 1.552 3.786 61.134 2.091 5.099 59.143
8 1.444 3.523 64.657 1.444 3.523 64.657 2.080 5.074 64.217
9 1.247 3.041 67.698 1.247 3.041 67.698 1.427 3.480 67.698
10 .741 1.806 69.504
11 .684 1.668 71.172
12 .625 1.526 72.697
13 .621 1.516 74.213
14 .590 1.438 75.651
11
METRO RAIL FINANCIAL PROJECT
15 .552 1.346 76.997
16 .519 1.267 78.264
17 .504 1.228 79.492
18 .478 1.167 80.658
19 .476 1.162 81.820
20 .467 1.139 82.959
21 .462 1.128 84.087
22 .443 1.081 85.169
23 .432 1.054 86.223
24 .415 1.012 87.235
25 .401 .977 88.213
26 .397 .967 89.180
27 .371 .905 90.084
28 .365 .890 90.974
29 .347 .846 91.821
30 .344 .838 92.659
31 .334 .816 93.475
32 .316 .770 94.245
33 .311 .760 95.004
34 .300 .732 95.737
12
⊘ This is a preview!⊘
Do you want full access?
Subscribe today to unlock all pages.
Trusted by 1+ million students worldwide
1 out of 42
Your All-in-One AI-Powered Toolkit for Academic Success.
+13062052269
info@desklib.com
Available 24*7 on WhatsApp / Email
![[object Object]](/_next/static/media/star-bottom.7253800d.svg)
Unlock your academic potential
Copyright © 2020–2026 A2Z Services. All Rights Reserved. Developed and managed by ZUCOL.