ACCTN101-18B: A Comparative Analysis of MFT & SPK's Financials
VerifiedAdded on 2023/06/07
|18
|3420
|104
Report
AI Summary
This report presents a comprehensive financial and non-financial analysis of Mainfreight Limited (MFT) and Spark New Zealand Limited (SPK) to inform a potential $3 million investment decision. The analysis includes a review of each company's background, followed by a detailed financial analysis using trend analysis of net income and total assets, key profitability ratios (gross profit, operating margin, net margin), and investment ratios (ROA, ROI, ROE) compared to industry averages. Cash flow statements are examined to assess operating, investing, and financing activities. Non-financial aspects are also considered to provide a holistic view of each company's performance and potential. The report concludes with a recommendation based on the findings, intended to guide the investment decision.

Accounting for Management
ACCTN101-18B
ACCTN101-18B
Paraphrase This Document
Need a fresh take? Get an instant paraphrase of this document with our AI Paraphraser
TABLE OF CONTENTS
Introduction................................................................................................................................4
Company Background................................................................................................................4
Mainfreight Limited (MFT)...................................................................................................4
Spark New Zealand Limited (SPK).......................................................................................4
Analysis of company’s performance..........................................................................................5
Financial analysis...................................................................................................................5
Mainfreight Limited (MFT)...............................................................................................5
Spark New Zealand Limited (SPK)...................................................................................9
Non-financial analysis..........................................................................................................14
Mainfreight Limited (MFT).............................................................................................14
Spark New Zealand Limited (SPK).................................................................................15
Conclusion and recommendation.............................................................................................15
References................................................................................................................................16
TABLE OF FIGURES
Figure 1: Trend analysis of net income of Mainfreight Limited (MFT)....................................5
Figure 2: Trend analysis of total assets of Mainfreight Limited (MFT)....................................5
Figure 3: Key Profitability ratios of Mainfreight Limited (MFT) and its comparison with
industry.......................................................................................................................................6
Figure 4: Key investment ratios of Mainfreight Limited (MFT) and its comparison with
industry.......................................................................................................................................7
Figure 5: Trend analysis of net income of Spark New Zealand Limited (SPK)........................9
Figure 6:Trend analysis of total assets of Mainfreight Limited (MFT)...................................10
Figure 7:Keyprofitability ratios of Spark New Zealand Ltdand its comparison with industry11
Figure 8: Key investment ratios of Spark New Zealand Ltd and its comparison with industry
..................................................................................................................................................12
Figure 9MFT Cash Flow Statement.........................................................................................18
Figure 10 SPK Cash Flow Statement.......................................................................................19
⊘ This is a preview!⊘
Do you want full access?
Subscribe today to unlock all pages.
Trusted by 1+ million students worldwide
INTRODUCTION
The present study is based on the analysis of financial as well as non-financial ratios of the
two companies namely; Main Freight Limited and Spark New Zealand Limited in order to
make a viable investment decision for the amount of $3 million received through LOTTO.
The study aims to critically evaluate the financial ratios and interpret the financial progress
and performance by making use of statistical measures while conducting the non-financial
analysis by considering the overall performance of both the companies.
COMPANY BACKGROUND
Mainfreight Limited (MFT)
MainFreight Limited has been listed on the New Zealand Logistics, it is considered as the
leading freight company in New Zealand, US and other main countries. Its headquarters are
located in Auckland. The company’s growth is unstoppable and is continuing to expand
gloablly7. Being an international supply chain business with more than 250 branches
throughout the world, the company is engaged in offering classy logistics solutions across the
most developed economies in the world (MainFreight Limited, 2018). It provides
warehousing, global air and water freight forwarding services and local distribution services.
The company has major business operations in more than 240 branches in more than 20
nations in and around the world.
Spark New Zealand Limited (SPK)
Spark New Zealand is a telecommunication company based in New Zealand offering fixed
line telephonic services, mobile networks, internet services and key ICT provider to New
Zealand businesses. It is said as the leading company in terms of value on the NZX with the
operations as a trading company publicly (Bloomberg, 2018). The company is engaged in
offering telecommunication services and offers data, mobile and internet networking, as well
as wireless networking services. It offers domestic national and global telephone and data
services, and has operations through three key segments namely; Spark Connect, Spark Home
Mobile & Business and Spark Digital.
Paraphrase This Document
Need a fresh take? Get an instant paraphrase of this document with our AI Paraphraser
ANALYSIS OF COMPANY’S PERFORMANCE
Financial analysis
Mainfreight Limited (MFT)
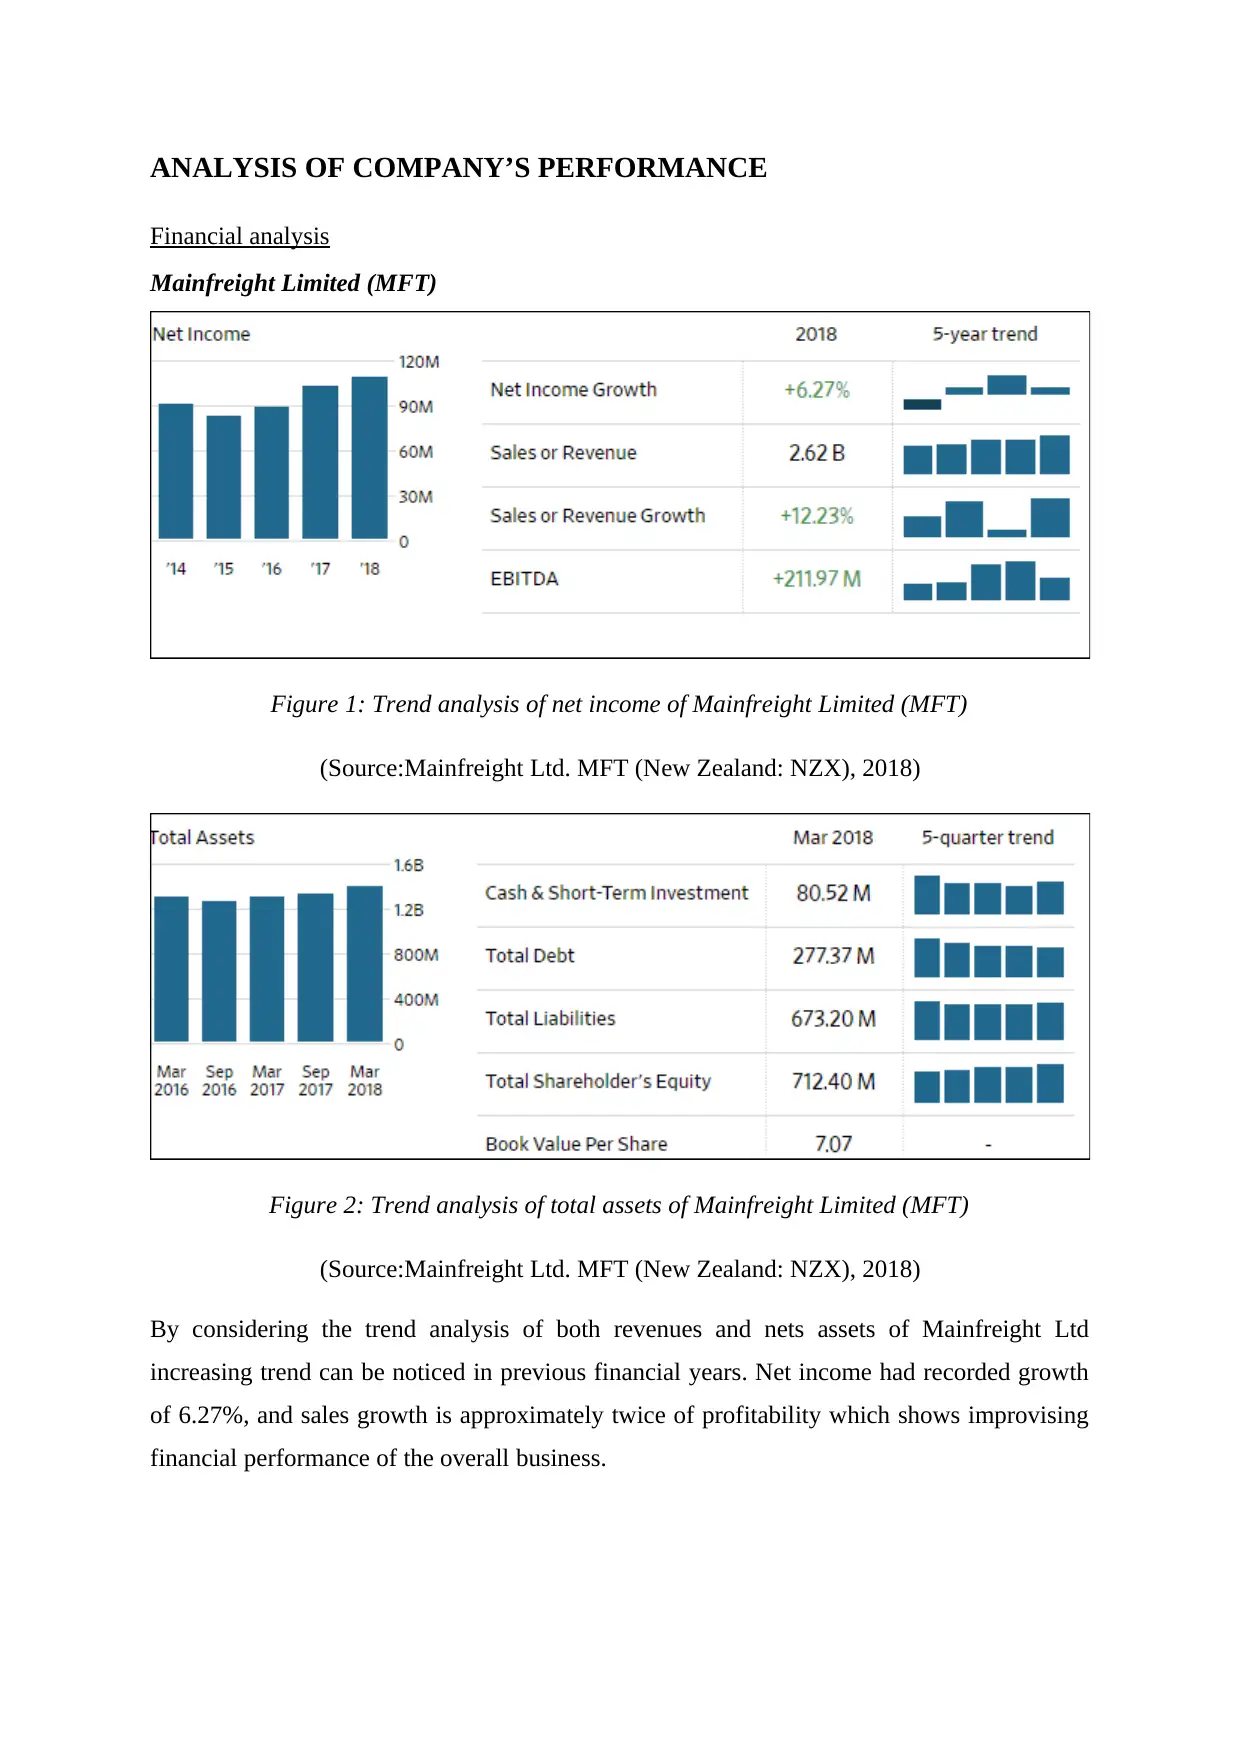
Figure 1: Trend analysis of net income of Mainfreight Limited (MFT)
(Source:Mainfreight Ltd. MFT (New Zealand: NZX), 2018)
Figure 2: Trend analysis of total assets of Mainfreight Limited (MFT)
(Source:Mainfreight Ltd. MFT (New Zealand: NZX), 2018)
By considering the trend analysis of both revenues and nets assets of Mainfreight Ltd
increasing trend can be noticed in previous financial years. Net income had recorded growth
of 6.27%, and sales growth is approximately twice of profitability which shows improvising
financial performance of the overall business.
Financial analysis
Mainfreight Limited (MFT)
Figure 1: Trend analysis of net income of Mainfreight Limited (MFT)
(Source:Mainfreight Ltd. MFT (New Zealand: NZX), 2018)
Figure 2: Trend analysis of total assets of Mainfreight Limited (MFT)
(Source:Mainfreight Ltd. MFT (New Zealand: NZX), 2018)
By considering the trend analysis of both revenues and nets assets of Mainfreight Ltd
increasing trend can be noticed in previous financial years. Net income had recorded growth
of 6.27%, and sales growth is approximately twice of profitability which shows improvising
financial performance of the overall business.
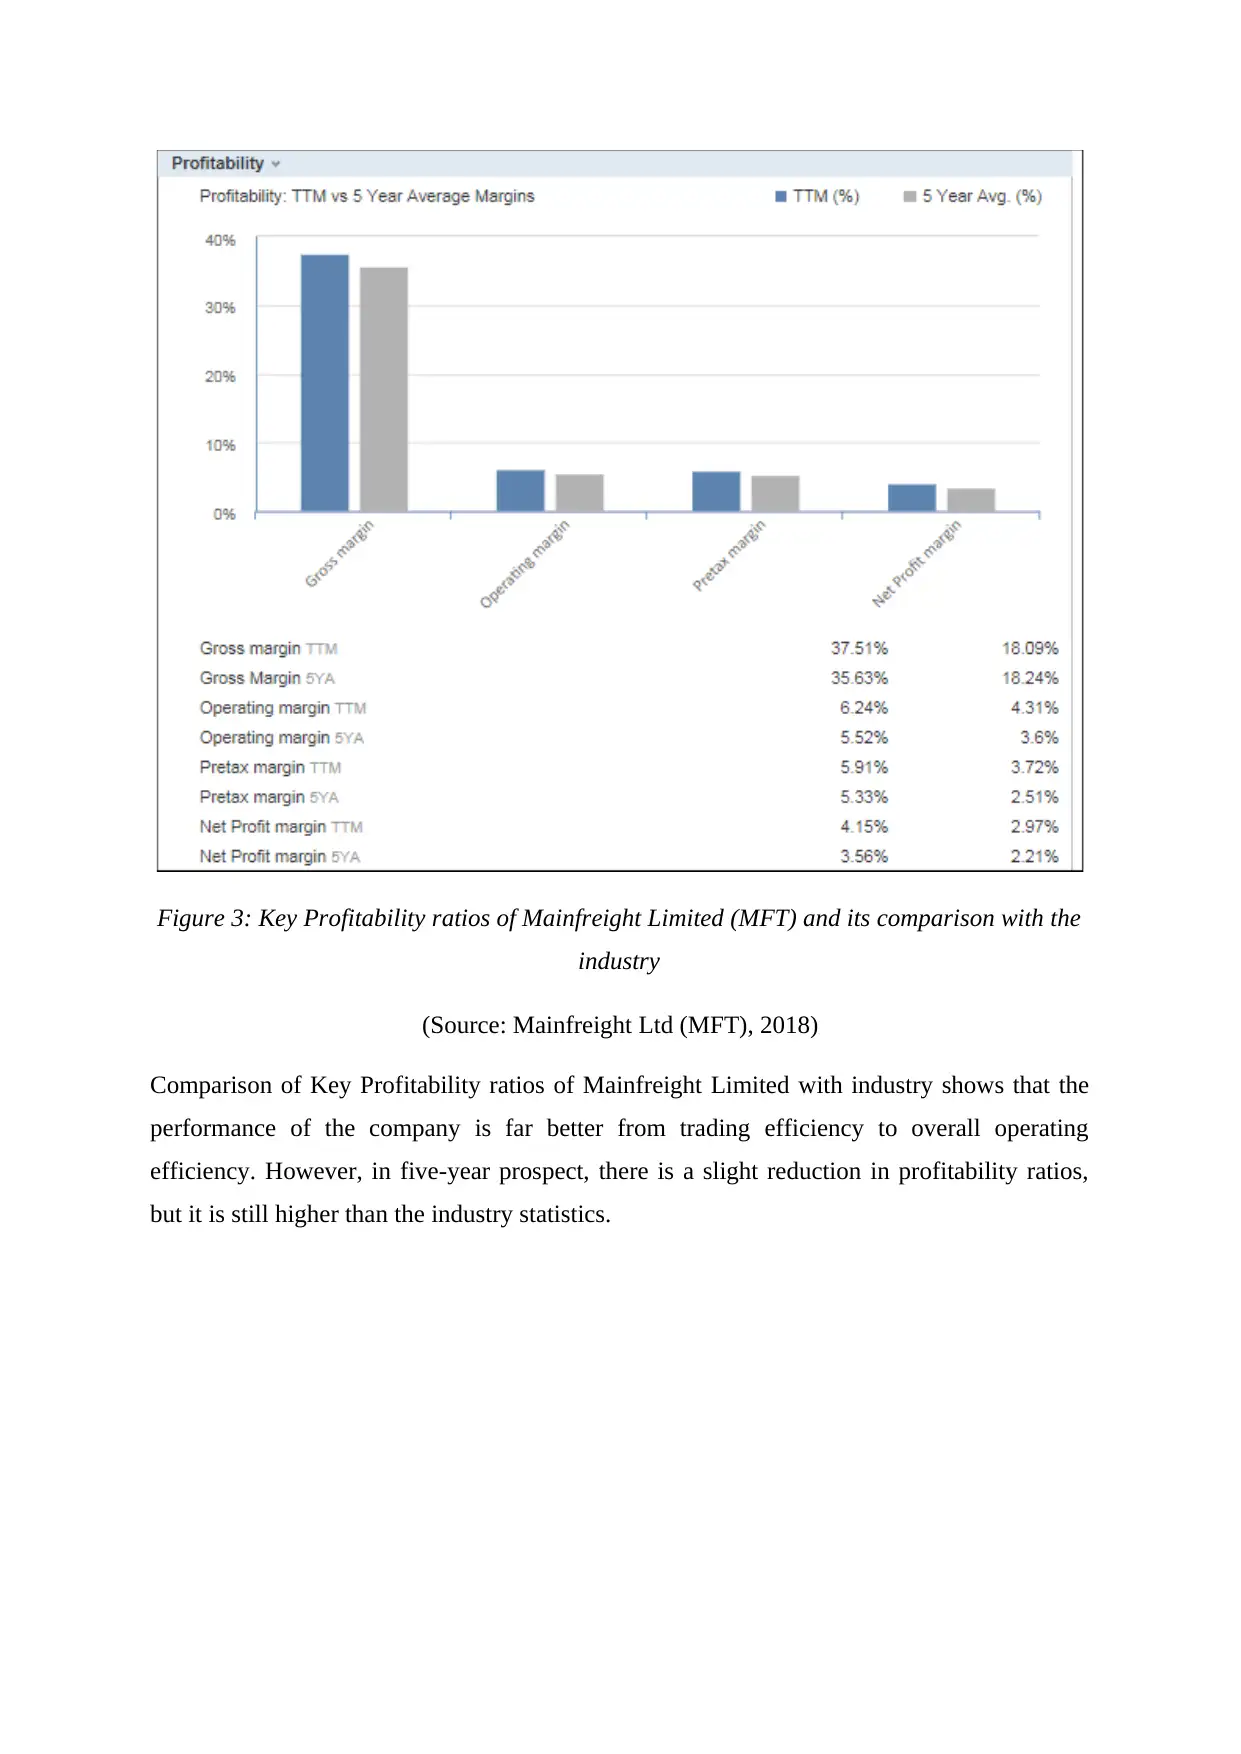
Figure 3: Key Profitability ratios of Mainfreight Limited (MFT) and its comparison with the
industry
(Source: Mainfreight Ltd (MFT), 2018)
Comparison of Key Profitability ratios of Mainfreight Limited with industry shows that the
performance of the company is far better from trading efficiency to overall operating
efficiency. However, in five-year prospect, there is a slight reduction in profitability ratios,
but it is still higher than the industry statistics.
⊘ This is a preview!⊘
Do you want full access?
Subscribe today to unlock all pages.
Trusted by 1+ million students worldwide
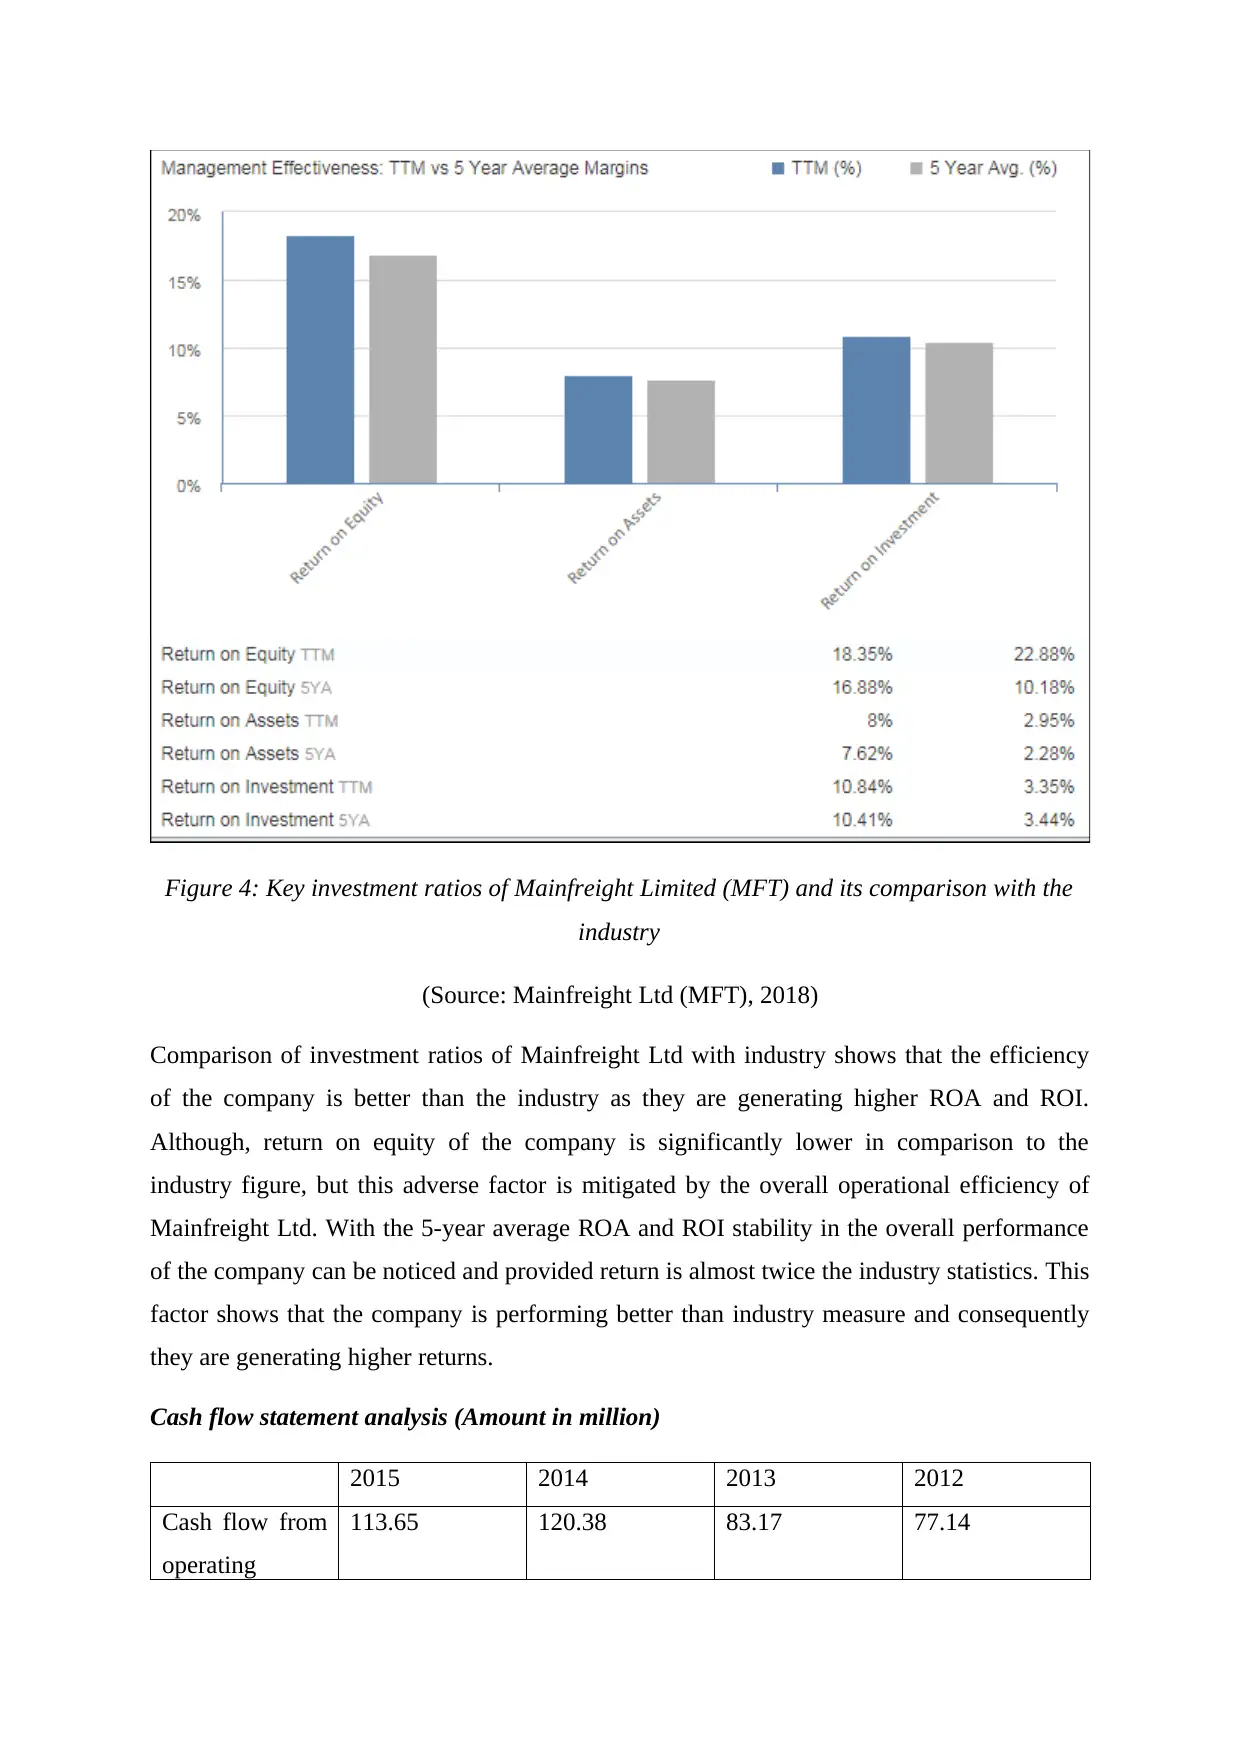
Figure 4: Key investment ratios of Mainfreight Limited (MFT) and its comparison with the
industry
(Source: Mainfreight Ltd (MFT), 2018)
Comparison of investment ratios of Mainfreight Ltd with industry shows that the efficiency
of the company is better than the industry as they are generating higher ROA and ROI.
Although, return on equity of the company is significantly lower in comparison to the
industry figure, but this adverse factor is mitigated by the overall operational efficiency of
Mainfreight Ltd. With the 5-year average ROA and ROI stability in the overall performance
of the company can be noticed and provided return is almost twice the industry statistics. This
factor shows that the company is performing better than industry measure and consequently
they are generating higher returns.
Cash flow statement analysis (Amount in million)
2015 2014 2013 2012
Cash flow from
operating
113.65 120.38 83.17 77.14
Paraphrase This Document
Need a fresh take? Get an instant paraphrase of this document with our AI Paraphraser
activities
Cash flow from
investing
activities
-132.5 -62.28 -58.74 -280.44
Cash flow from
financing
activities
27.56 -43.98 -17.59 193.43
Foreign
exchange
effects
1.16 -2.65 -0.72 -3.22
Net change in
cash
9.87 11.46 6.12 -13.09
Cash flow statement reflects the changes held in income and accounts of the balance sheet
that impact the cash and cash equivalent and conducts the breaking of analysis into
operational, investment and financial activities.
The above cash flow statement of MainFrieght shows that cash generated from operating
activities are effective, and the company payments are showing an increasing trend which
means the company is seeking to make its payments on a timely basis so as to strengthen its
position and be free of payments. The table shows that the cash receipts of the company are
also increasing, which means the company is generating higher revenue and is accounting the
same strategically (Mainfreight Ltd (MFT), 2018). The cash tax of the company is
showcasing fluctuations but is increasing anyway, stating that the company is good on paying
tax on the generated revenues. On the other hand, the interest paid on cash is not stable but is
performing effectively which shows that the company is providing interest on bank loans to
reduce its outer debts while solidifying its financial position.
The investing activities of the company are showing a negative trend, asserting that the
company is making more and more of investment in fixed assets for improving its financial
performance and keeping the base of asset strong simultaneously. The company is investing
in PPE higher to smoothen the operations and functions of management. The investing
activities of the company show that the company is investing in long terms as fixed assets,
indicating managed credit and optimal fund management.
Cash flow from
investing
activities
-132.5 -62.28 -58.74 -280.44
Cash flow from
financing
activities
27.56 -43.98 -17.59 193.43
Foreign
exchange
effects
1.16 -2.65 -0.72 -3.22
Net change in
cash
9.87 11.46 6.12 -13.09
Cash flow statement reflects the changes held in income and accounts of the balance sheet
that impact the cash and cash equivalent and conducts the breaking of analysis into
operational, investment and financial activities.
The above cash flow statement of MainFrieght shows that cash generated from operating
activities are effective, and the company payments are showing an increasing trend which
means the company is seeking to make its payments on a timely basis so as to strengthen its
position and be free of payments. The table shows that the cash receipts of the company are
also increasing, which means the company is generating higher revenue and is accounting the
same strategically (Mainfreight Ltd (MFT), 2018). The cash tax of the company is
showcasing fluctuations but is increasing anyway, stating that the company is good on paying
tax on the generated revenues. On the other hand, the interest paid on cash is not stable but is
performing effectively which shows that the company is providing interest on bank loans to
reduce its outer debts while solidifying its financial position.
The investing activities of the company are showing a negative trend, asserting that the
company is making more and more of investment in fixed assets for improving its financial
performance and keeping the base of asset strong simultaneously. The company is investing
in PPE higher to smoothen the operations and functions of management. The investing
activities of the company show that the company is investing in long terms as fixed assets,
indicating managed credit and optimal fund management.
However, the financing activities of the cash flow statement are also showing a negative
pattern, as the company is making investments in the dividend factor, so as to appeal
shareholders and keep them loyal with more of returns. In addition, the liability of the
company is also decreasing stating that the company is making optimal payments on external
debts for maintaining the strong financial base. The financing activities of the company are
reflecting the minus trend, because the company is spending to repurchase the issued ones,
and pay off the debt and interest as well as making a dividend payment to attract
shareholders.
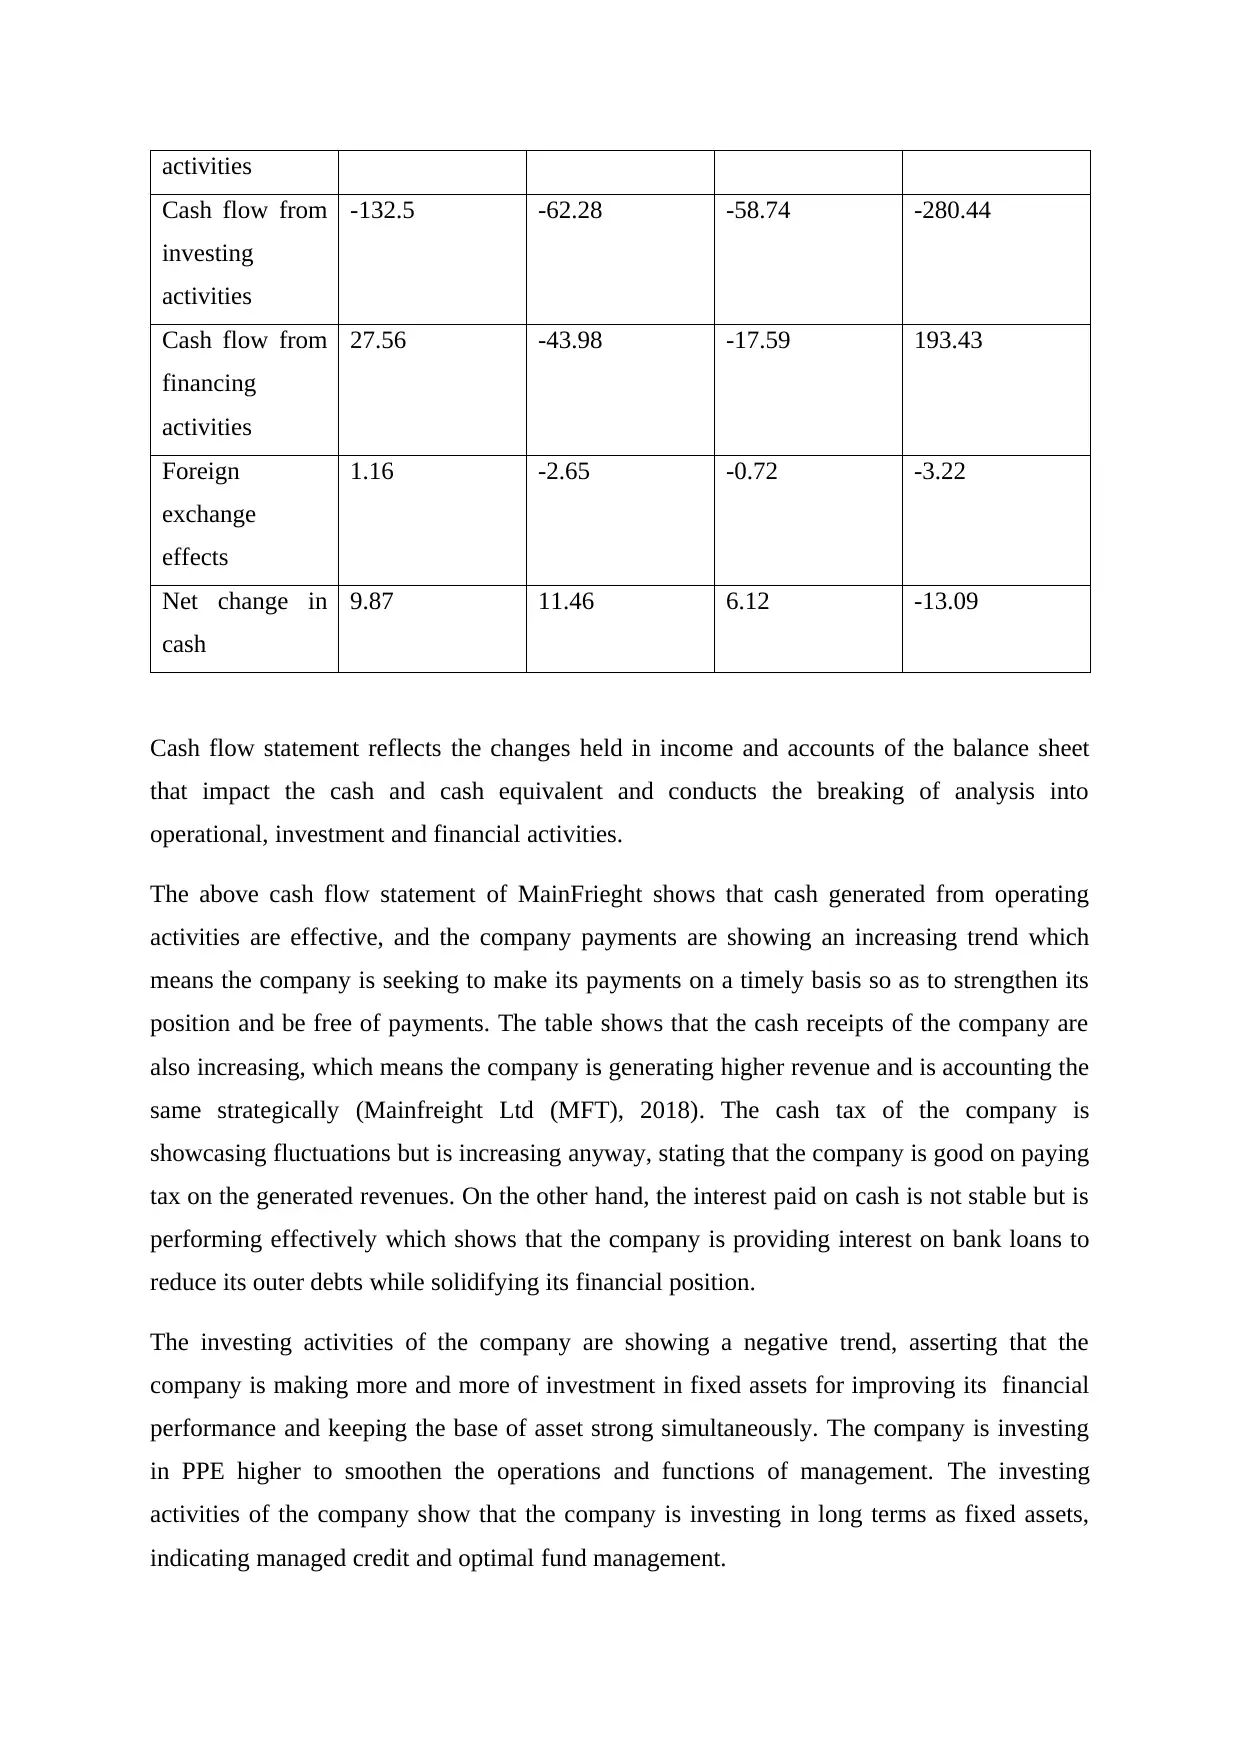
Spark New Zealand Limited (SPK)
Figure 5: Trend analysis of net income of Spark New Zealand Limited (SPK)
(Source:Spark New Zealand Ltd. SPK (Australia: Sydney), 2018)
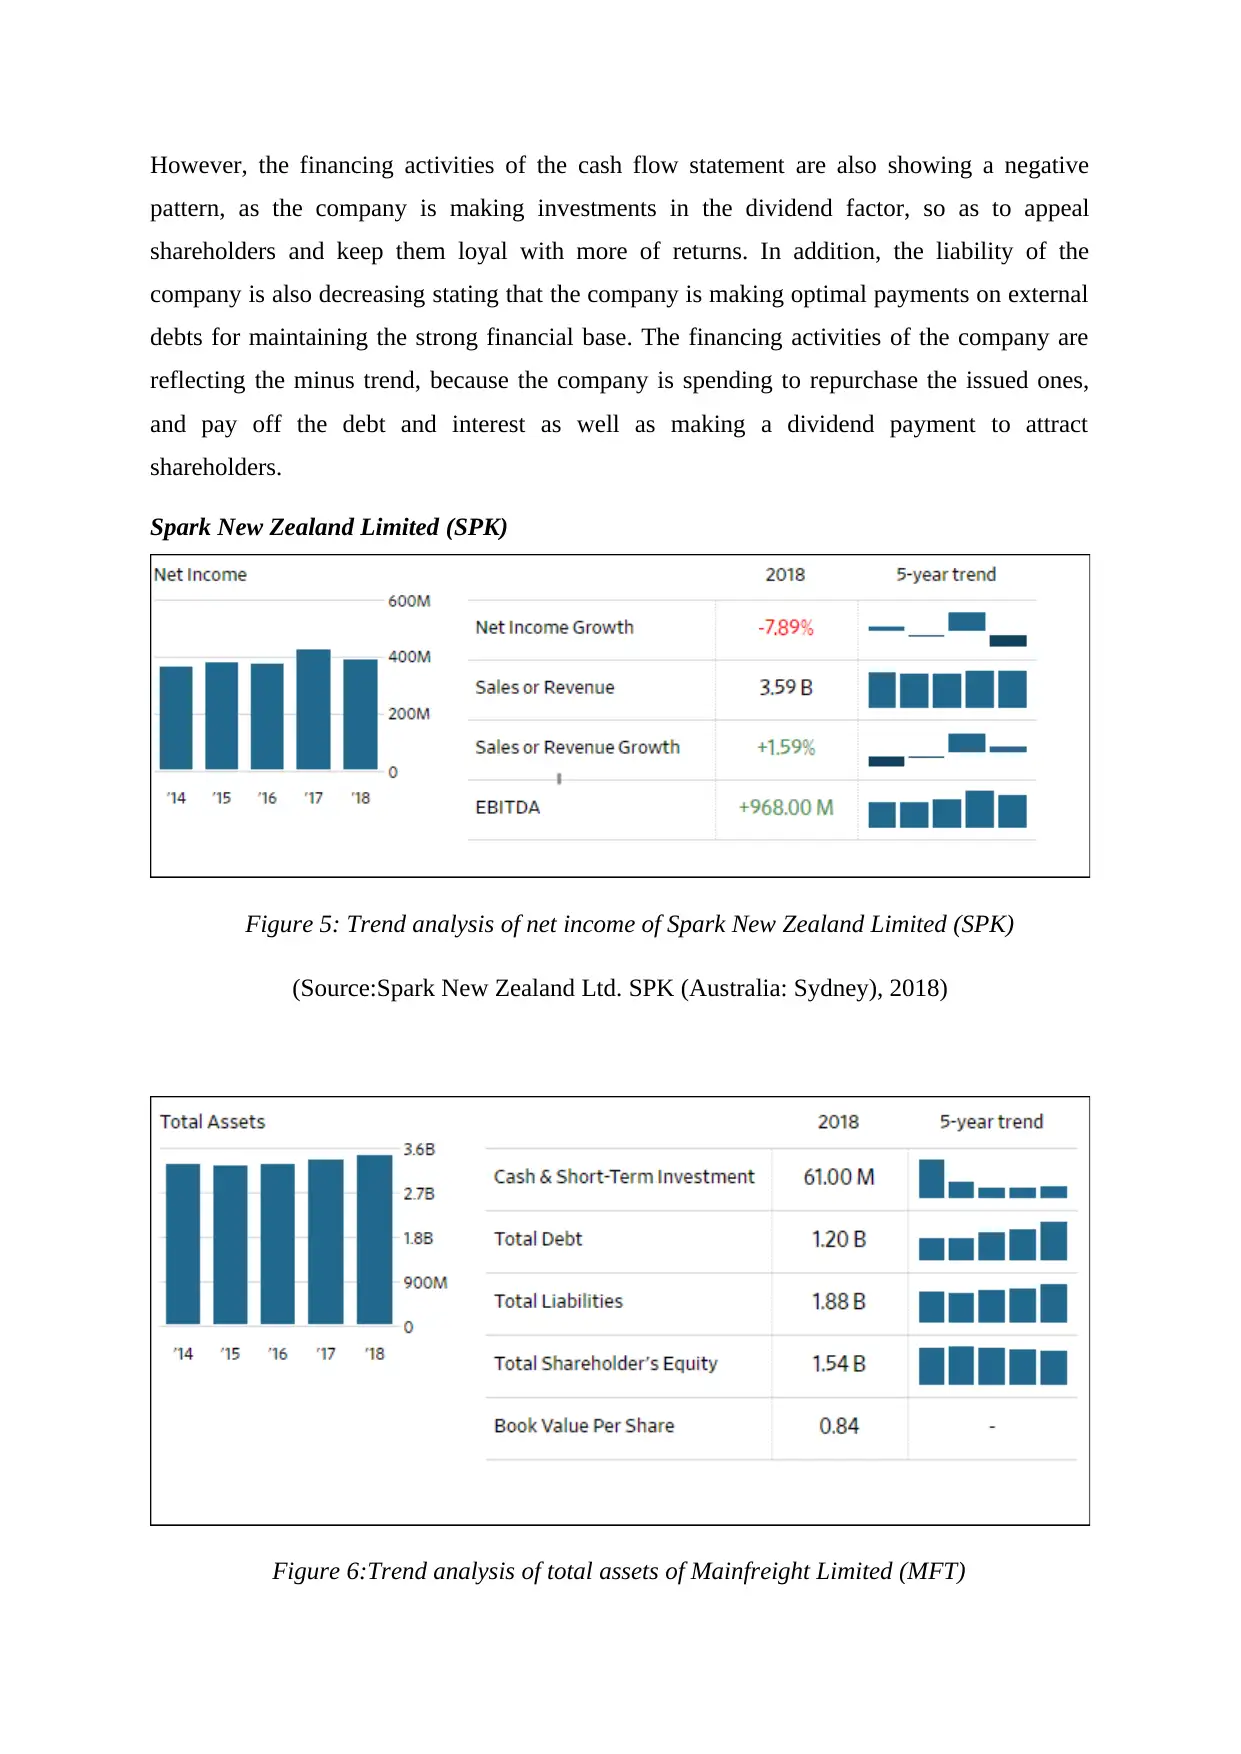
Figure 6:Trend analysis of total assets of Mainfreight Limited (MFT)
pattern, as the company is making investments in the dividend factor, so as to appeal
shareholders and keep them loyal with more of returns. In addition, the liability of the
company is also decreasing stating that the company is making optimal payments on external
debts for maintaining the strong financial base. The financing activities of the company are
reflecting the minus trend, because the company is spending to repurchase the issued ones,
and pay off the debt and interest as well as making a dividend payment to attract
shareholders.
Spark New Zealand Limited (SPK)
Figure 5: Trend analysis of net income of Spark New Zealand Limited (SPK)
(Source:Spark New Zealand Ltd. SPK (Australia: Sydney), 2018)
Figure 6:Trend analysis of total assets of Mainfreight Limited (MFT)
⊘ This is a preview!⊘
Do you want full access?
Subscribe today to unlock all pages.
Trusted by 1+ million students worldwide
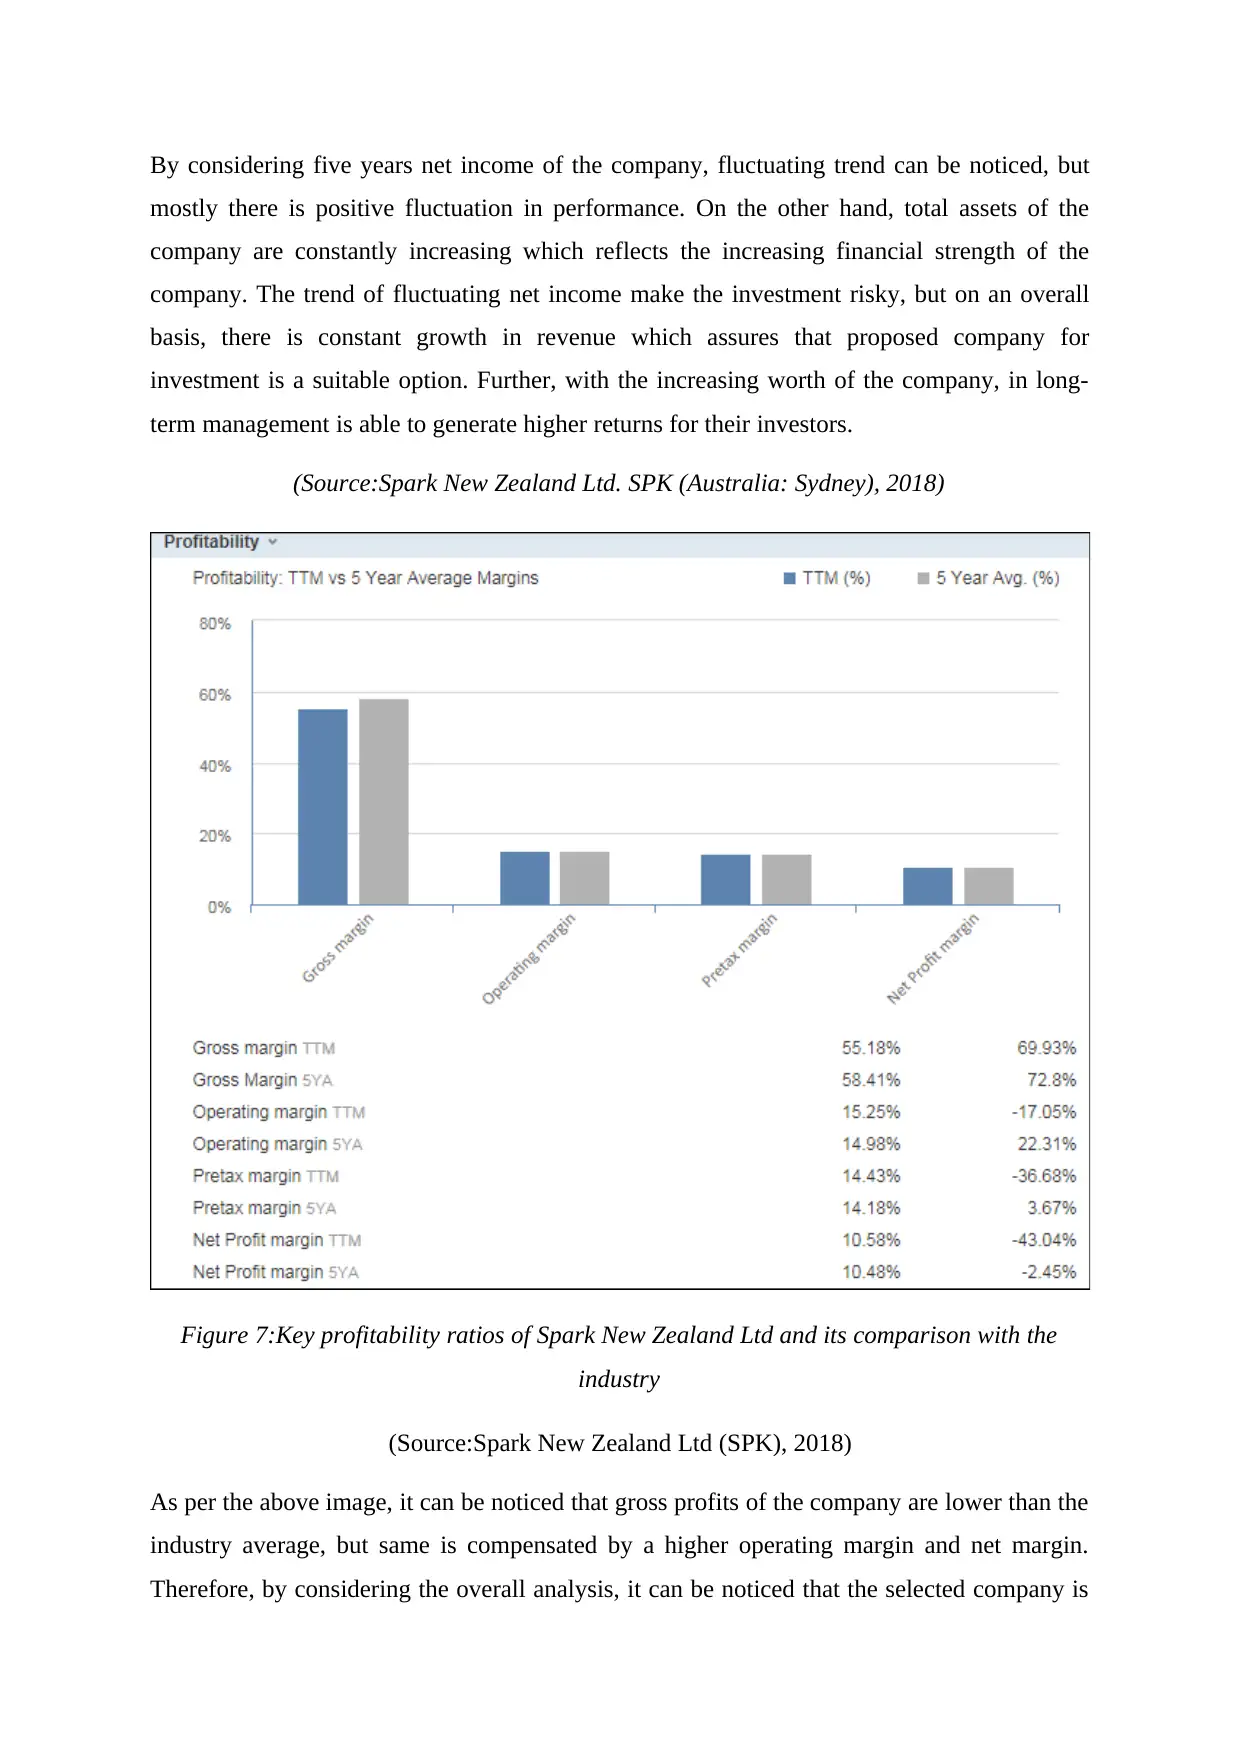
By considering five years net income of the company, fluctuating trend can be noticed, but
mostly there is positive fluctuation in performance. On the other hand, total assets of the
company are constantly increasing which reflects the increasing financial strength of the
company. The trend of fluctuating net income make the investment risky, but on an overall
basis, there is constant growth in revenue which assures that proposed company for
investment is a suitable option. Further, with the increasing worth of the company, in long-
term management is able to generate higher returns for their investors.
(Source:Spark New Zealand Ltd. SPK (Australia: Sydney), 2018)
Figure 7:Key profitability ratios of Spark New Zealand Ltd and its comparison with the
industry
(Source:Spark New Zealand Ltd (SPK), 2018)
As per the above image, it can be noticed that gross profits of the company are lower than the
industry average, but same is compensated by a higher operating margin and net margin.
Therefore, by considering the overall analysis, it can be noticed that the selected company is
Paraphrase This Document
Need a fresh take? Get an instant paraphrase of this document with our AI Paraphraser
performing better in comparison to industry standards as their net profit margin is 10.48%
while industry in generating negative returns. This factor shows that the company is able to
provide returns to the shareholders even in a situation where there is the downfall for the
industry. Further, the similarity of annual returns with the 5-year average shows the
consistency of performance of company which ensures regular revenue returns.
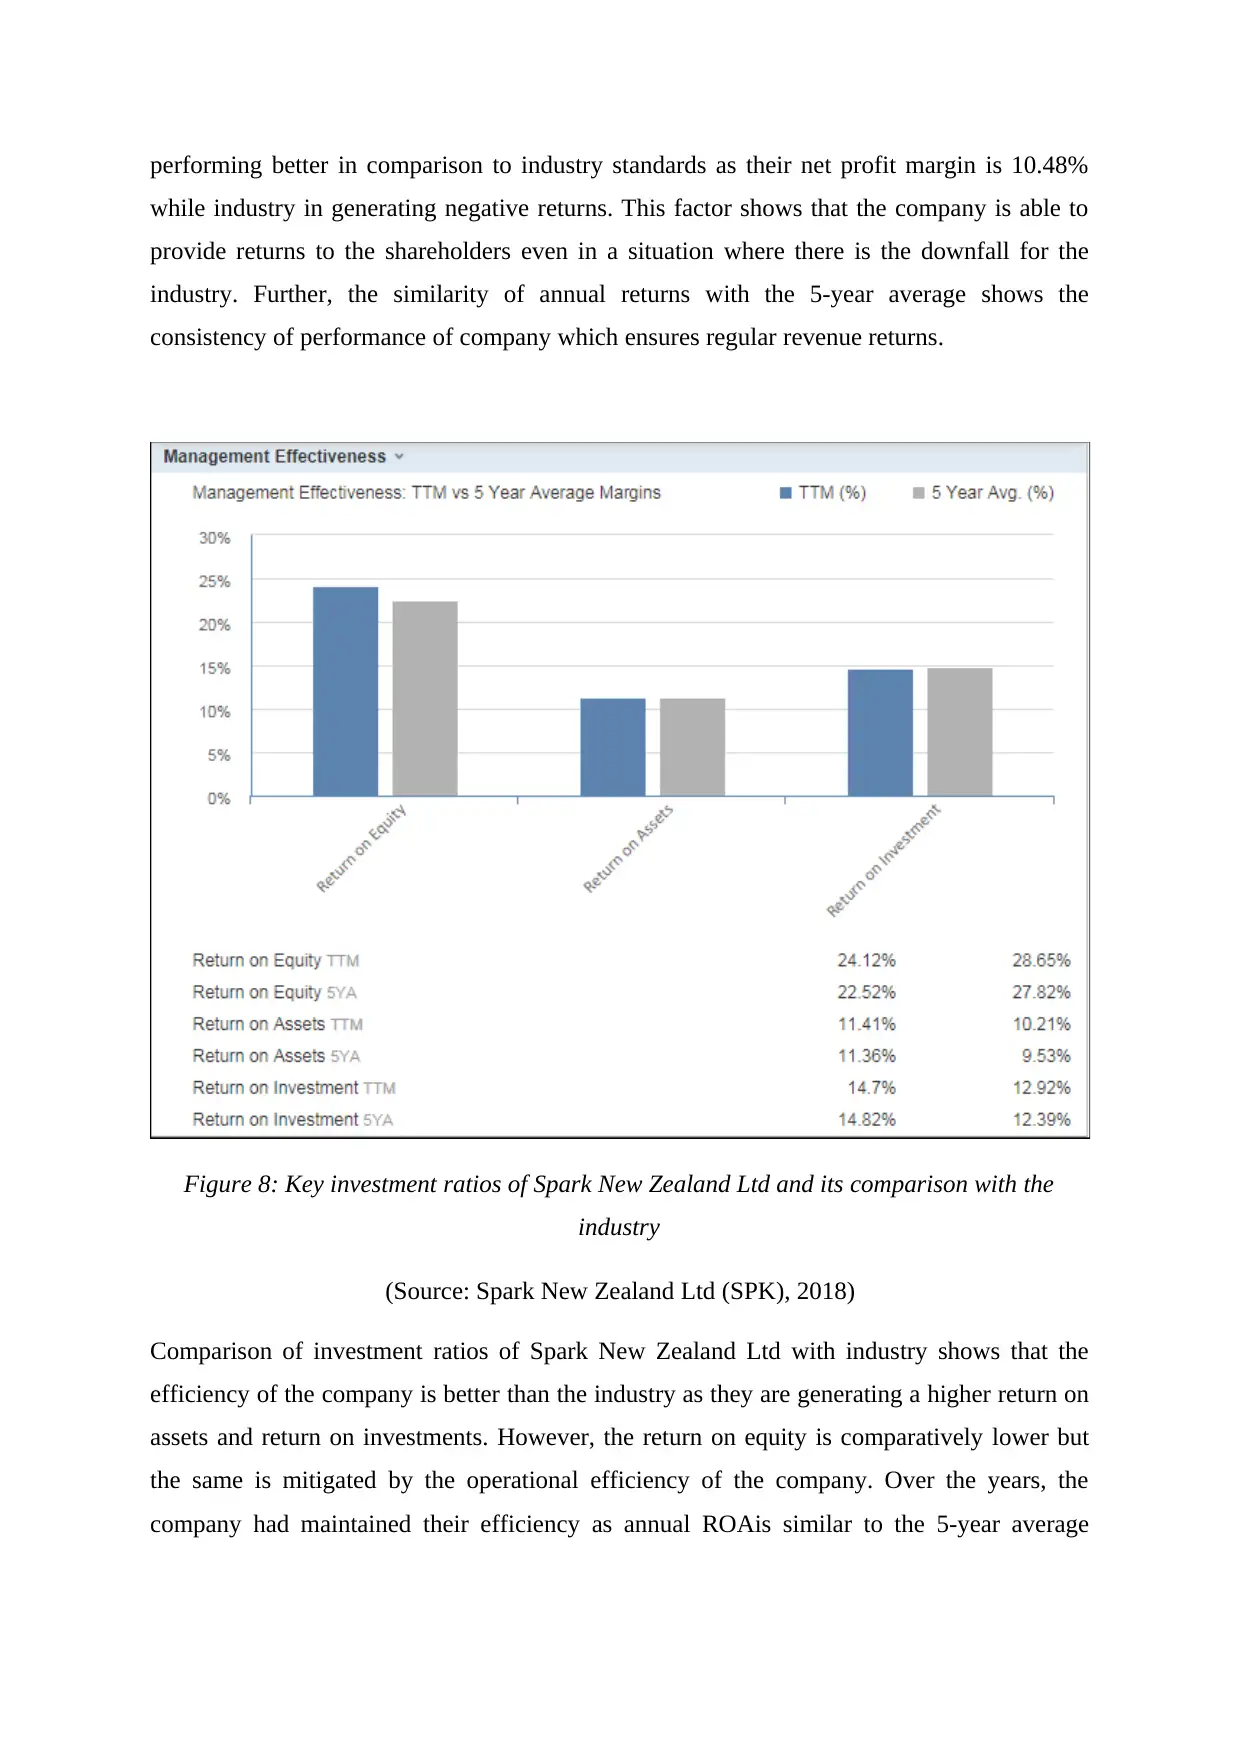
Figure 8: Key investment ratios of Spark New Zealand Ltd and its comparison with the
industry
(Source: Spark New Zealand Ltd (SPK), 2018)
Comparison of investment ratios of Spark New Zealand Ltd with industry shows that the
efficiency of the company is better than the industry as they are generating a higher return on
assets and return on investments. However, the return on equity is comparatively lower but
the same is mitigated by the operational efficiency of the company. Over the years, the
company had maintained their efficiency as annual ROAis similar to the 5-year average
while industry in generating negative returns. This factor shows that the company is able to
provide returns to the shareholders even in a situation where there is the downfall for the
industry. Further, the similarity of annual returns with the 5-year average shows the
consistency of performance of company which ensures regular revenue returns.
Figure 8: Key investment ratios of Spark New Zealand Ltd and its comparison with the
industry
(Source: Spark New Zealand Ltd (SPK), 2018)
Comparison of investment ratios of Spark New Zealand Ltd with industry shows that the
efficiency of the company is better than the industry as they are generating a higher return on
assets and return on investments. However, the return on equity is comparatively lower but
the same is mitigated by the operational efficiency of the company. Over the years, the
company had maintained their efficiency as annual ROAis similar to the 5-year average
ROA. Further, return on investment is also showing a similar trend but over the years average
ROI of the industry is reduced, but the average ROI of the company has been increased.
Cash flow statement analysis (Amount in million)
2018 2017 2016 2015
Cash flow from
operating
activities
777 717 716 630
Cash flow from
investing
activities
-484 -380 -488 -456
Cash flow from
financing
activities
290 -337 -256 -304
Foreign
exchange
effects
- - - 2
Net change in
cash
3 - -28 -128
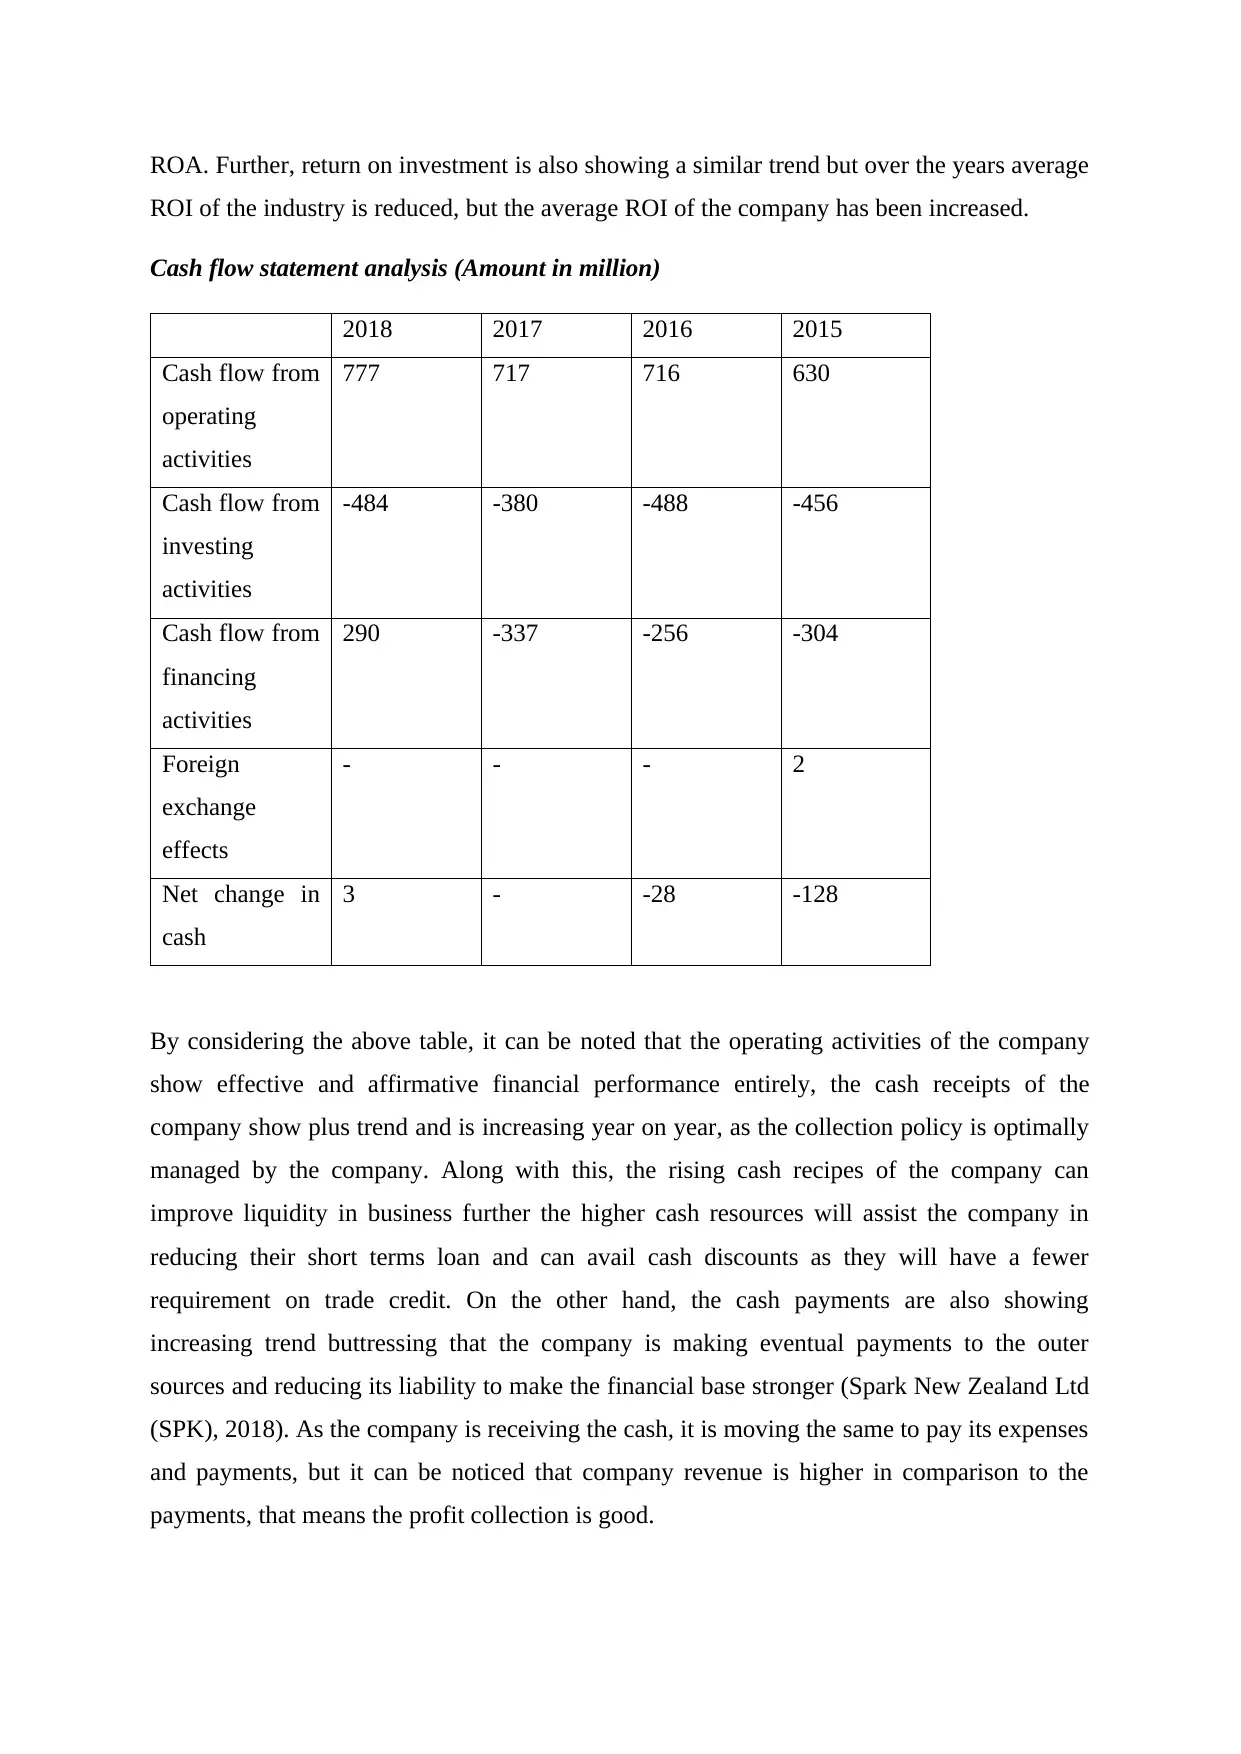
By considering the above table, it can be noted that the operating activities of the company
show effective and affirmative financial performance entirely, the cash receipts of the
company show plus trend and is increasing year on year, as the collection policy is optimally
managed by the company. Along with this, the rising cash recipes of the company can
improve liquidity in business further the higher cash resources will assist the company in
reducing their short terms loan and can avail cash discounts as they will have a fewer
requirement on trade credit. On the other hand, the cash payments are also showing
increasing trend buttressing that the company is making eventual payments to the outer
sources and reducing its liability to make the financial base stronger (Spark New Zealand Ltd
(SPK), 2018). As the company is receiving the cash, it is moving the same to pay its expenses
and payments, but it can be noticed that company revenue is higher in comparison to the
payments, that means the profit collection is good.
ROI of the industry is reduced, but the average ROI of the company has been increased.
Cash flow statement analysis (Amount in million)
2018 2017 2016 2015
Cash flow from
operating
activities
777 717 716 630
Cash flow from
investing
activities
-484 -380 -488 -456
Cash flow from
financing
activities
290 -337 -256 -304
Foreign
exchange
effects
- - - 2
Net change in
cash
3 - -28 -128
By considering the above table, it can be noted that the operating activities of the company
show effective and affirmative financial performance entirely, the cash receipts of the
company show plus trend and is increasing year on year, as the collection policy is optimally
managed by the company. Along with this, the rising cash recipes of the company can
improve liquidity in business further the higher cash resources will assist the company in
reducing their short terms loan and can avail cash discounts as they will have a fewer
requirement on trade credit. On the other hand, the cash payments are also showing
increasing trend buttressing that the company is making eventual payments to the outer
sources and reducing its liability to make the financial base stronger (Spark New Zealand Ltd
(SPK), 2018). As the company is receiving the cash, it is moving the same to pay its expenses
and payments, but it can be noticed that company revenue is higher in comparison to the
payments, that means the profit collection is good.
⊘ This is a preview!⊘
Do you want full access?
Subscribe today to unlock all pages.
Trusted by 1+ million students worldwide
1 out of 18
Related Documents


Your All-in-One AI-Powered Toolkit for Academic Success.
+13062052269
info@desklib.com
Available 24*7 on WhatsApp / Email
![[object Object]](/_next/static/media/star-bottom.7253800d.svg)
Unlock your academic potential
Copyright © 2020–2026 A2Z Services. All Rights Reserved. Developed and managed by ZUCOL.