MGT2320 Assignment 4: ERP, MRP, Lean, JIT, and Kanban Analysis
VerifiedAdded on 2022/10/03
|13
|2253
|360
Homework Assignment
AI Summary
This document presents a comprehensive solution to MGT2320 Assignment 4, focusing on key operations management concepts. The assignment begins with an analysis of Enterprise Resource Planning (ERP) and its benefits, using Pladis Global as a case study. It then delves into Materials Requirement Planning (MRP), including product structure trees, bill of materials, and MRP schedules. The solution further explores Lean Operations, comparing its application in service and product companies. Additionally, it provides a Just-In-Time (JIT) inventory example using McDonald's, followed by Kanban calculations, standard time determination, sample size estimation, and a discussion of utilization, efficiency, and productivity. The document provides detailed explanations, calculations, and relevant references to support the analysis.
MGT2320 Online – Assignment 4
Course Name:
ALGONQUIN COLLEGE
Centre for Continuing & Online Learning
Student Name:
Student ID:
Submission Date:
Course Name:
ALGONQUIN COLLEGE
Centre for Continuing & Online Learning
Student Name:
Student ID:
Submission Date:
Paraphrase This Document
Need a fresh take? Get an instant paraphrase of this document with our AI Paraphraser
Table of Contents
Q1. Enterprise Resource Planning.............................................................................................3
Q1 (i) Company background..................................................................................................3
Q1 (ii) Company operations...................................................................................................3
Q1 (iii) Benefits of ERP at the company...............................................................................4
Q2 Materials Requirement Planning (MRP)..............................................................................5
Product Structure Tree...........................................................................................................5
Bill of Material.......................................................................................................................5
Inventory Information File.....................................................................................................5
MRP Schedule........................................................................................................................5
Summarized MRP Report......................................................................................................6
Q3 Lean Operations...................................................................................................................7
Q4 Just-In-Time Inventory Example.........................................................................................7
Q5 Kanban.................................................................................................................................7
Q6 Standard time........................................................................................................................8
Q7 Sample size estimation.........................................................................................................9
Q8 Utilization, efficiency, and productivity............................................................................10
References................................................................................................................................11
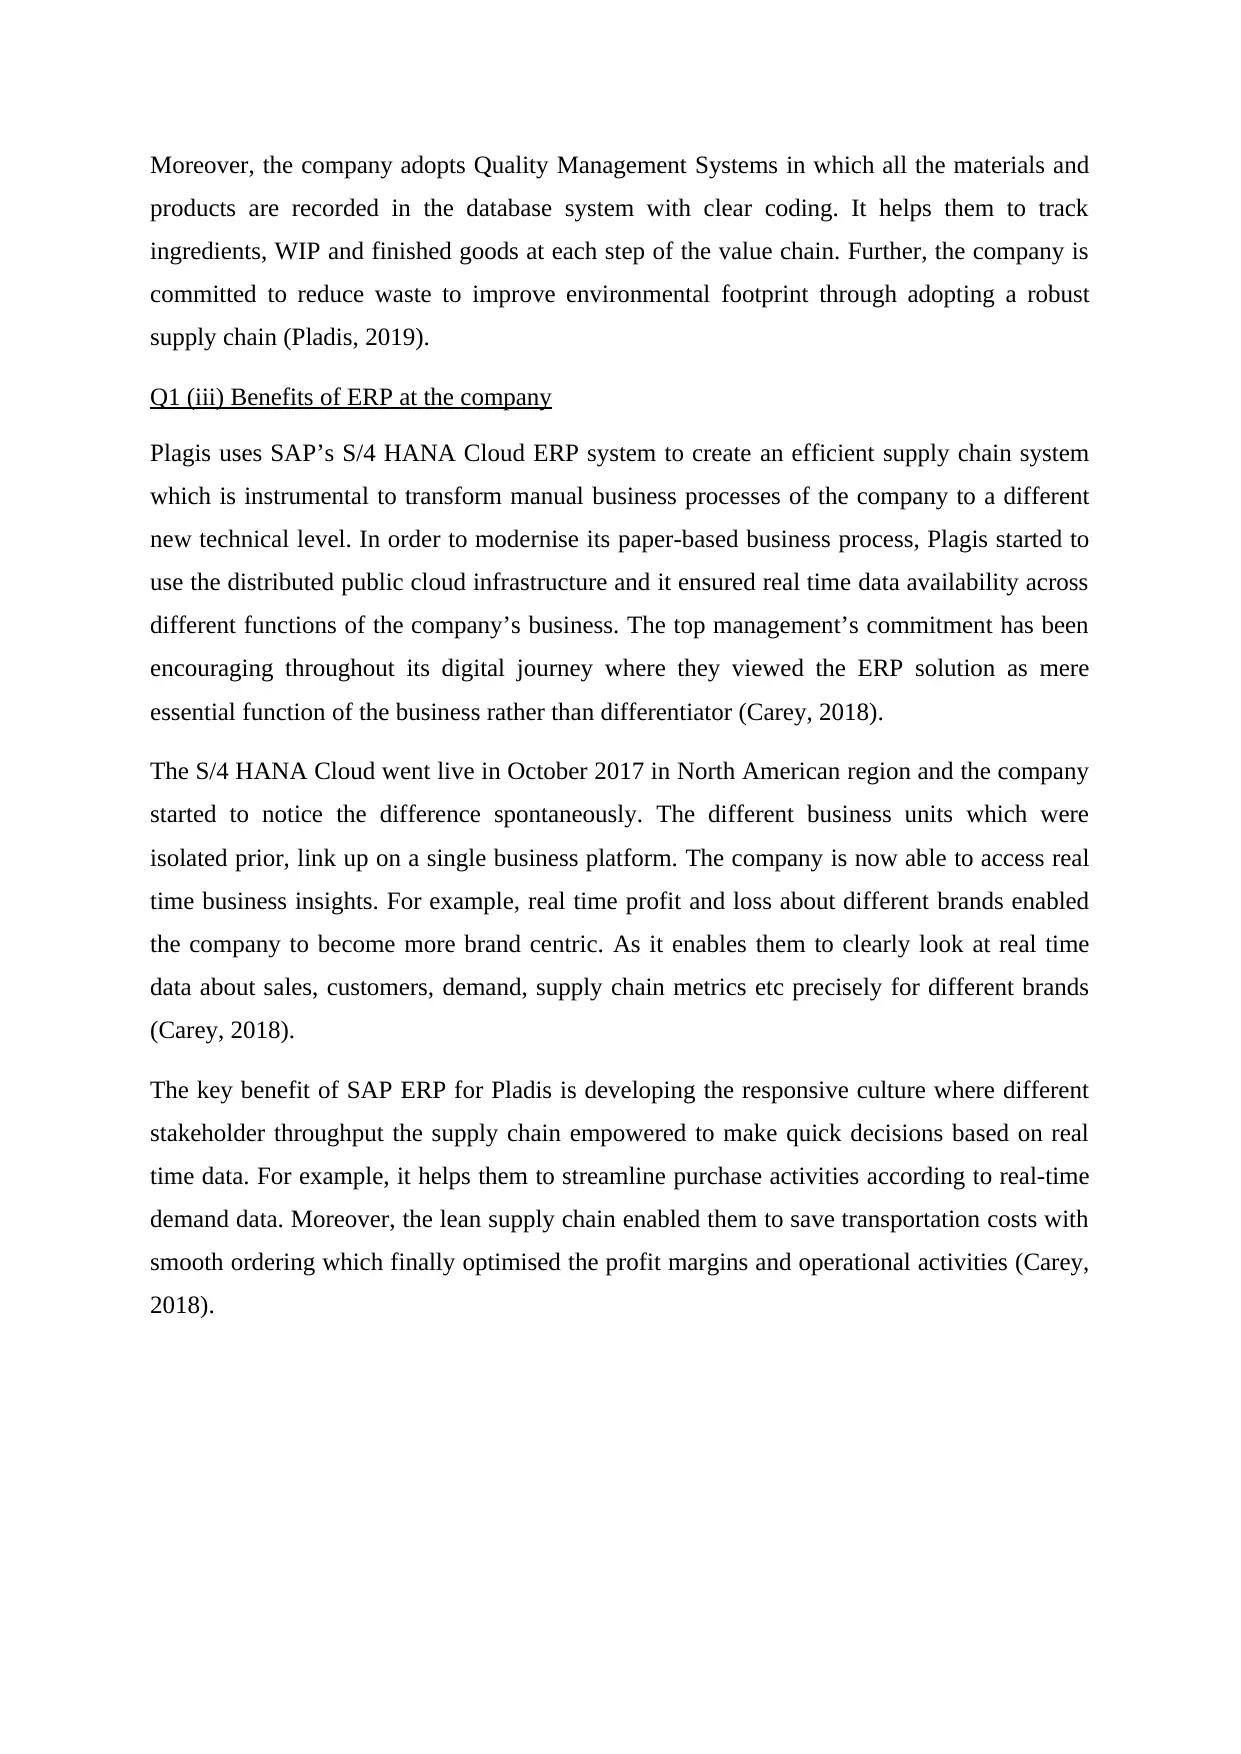
Q1. Enterprise Resource Planning
Q1 (i) Company background
Pladis Global is a budding snacking company and was established in January 2016. The
company is selected for the study because there is a need for an ERP solution in a response to
the company’s recent growth. The company was doing fine earlier as a single business unit
however, as they grow by merging with other business, the existing system was not enough to
meet the new requirements. In this case, Yildiz Holding integrated United Biscuits, Godiva
Chocolatier, DeMet’s Candy Company and Ulker to form a single global business entity. The
three core brands of the company are Ulker, GODIVA and McVitie’s. The product line of the
company includes sweet biscuits, wafers, chocolate, cake, candy and gum. The global
company have operations across Europe, Africa, Asia, the Middle East, and the United States
(Pladis, 2019).
Q1 (ii) Company operations
Pladis’ operational activities can be assessed through their core identity as bakers and
chocolatiers. The company has proven technical ability and strength which provide it
competitive edge in the highly competitive snacks industry. Their manufacturing facilities are
located in 34 factories across 13 countries where about 17,000 people passionately work.
Agility, collaboration and resilience are the core strength of their manufacturing competence.
The company is known to quickly adapt to consumer’s demand and changing taste which
provides it key competitive advantage over rivals. It means that the fastest growing company
successfully recorded £3.5 billion revenues in 2017 within two years of the establishment
(Pladis, 2019).
The company aims to expand into new markets while using the existing global presence to
develop its brands in innovative ways. Therefore, it has invested significantly in high-tech
specialist R&D centres in the UK (Bakery), Turkey (multi-skilled) and Belgium
(Confectionery). The strong R&D organisation also has partnership with universities and
other research companies which help to improvise recipes, introduce new products and
formats to match consumers’ changing demand and lifestyles. Also, it enables the company
to convert products from concept to shelf quicker than others in the market (Pladis, 2019).
The operations process type of the company is agile at the global level in the way that the
firm can respond new market conditions quickly and adapt its operational activity if requires.
⊘ This is a preview!⊘
Do you want full access?
Subscribe today to unlock all pages.
Trusted by 1+ million students worldwide
Moreover, the company adopts Quality Management Systems in which all the materials and
products are recorded in the database system with clear coding. It helps them to track
ingredients, WIP and finished goods at each step of the value chain. Further, the company is
committed to reduce waste to improve environmental footprint through adopting a robust
supply chain (Pladis, 2019).
Q1 (iii) Benefits of ERP at the company
Plagis uses SAP’s S/4 HANA Cloud ERP system to create an efficient supply chain system
which is instrumental to transform manual business processes of the company to a different
new technical level. In order to modernise its paper-based business process, Plagis started to
use the distributed public cloud infrastructure and it ensured real time data availability across
different functions of the company’s business. The top management’s commitment has been
encouraging throughout its digital journey where they viewed the ERP solution as mere
essential function of the business rather than differentiator (Carey, 2018).
The S/4 HANA Cloud went live in October 2017 in North American region and the company
started to notice the difference spontaneously. The different business units which were
isolated prior, link up on a single business platform. The company is now able to access real
time business insights. For example, real time profit and loss about different brands enabled
the company to become more brand centric. As it enables them to clearly look at real time
data about sales, customers, demand, supply chain metrics etc precisely for different brands
(Carey, 2018).
The key benefit of SAP ERP for Pladis is developing the responsive culture where different
stakeholder throughput the supply chain empowered to make quick decisions based on real
time data. For example, it helps them to streamline purchase activities according to real-time
demand data. Moreover, the lean supply chain enabled them to save transportation costs with
smooth ordering which finally optimised the profit margins and operational activities (Carey,
2018).
Paraphrase This Document
Need a fresh take? Get an instant paraphrase of this document with our AI Paraphraser
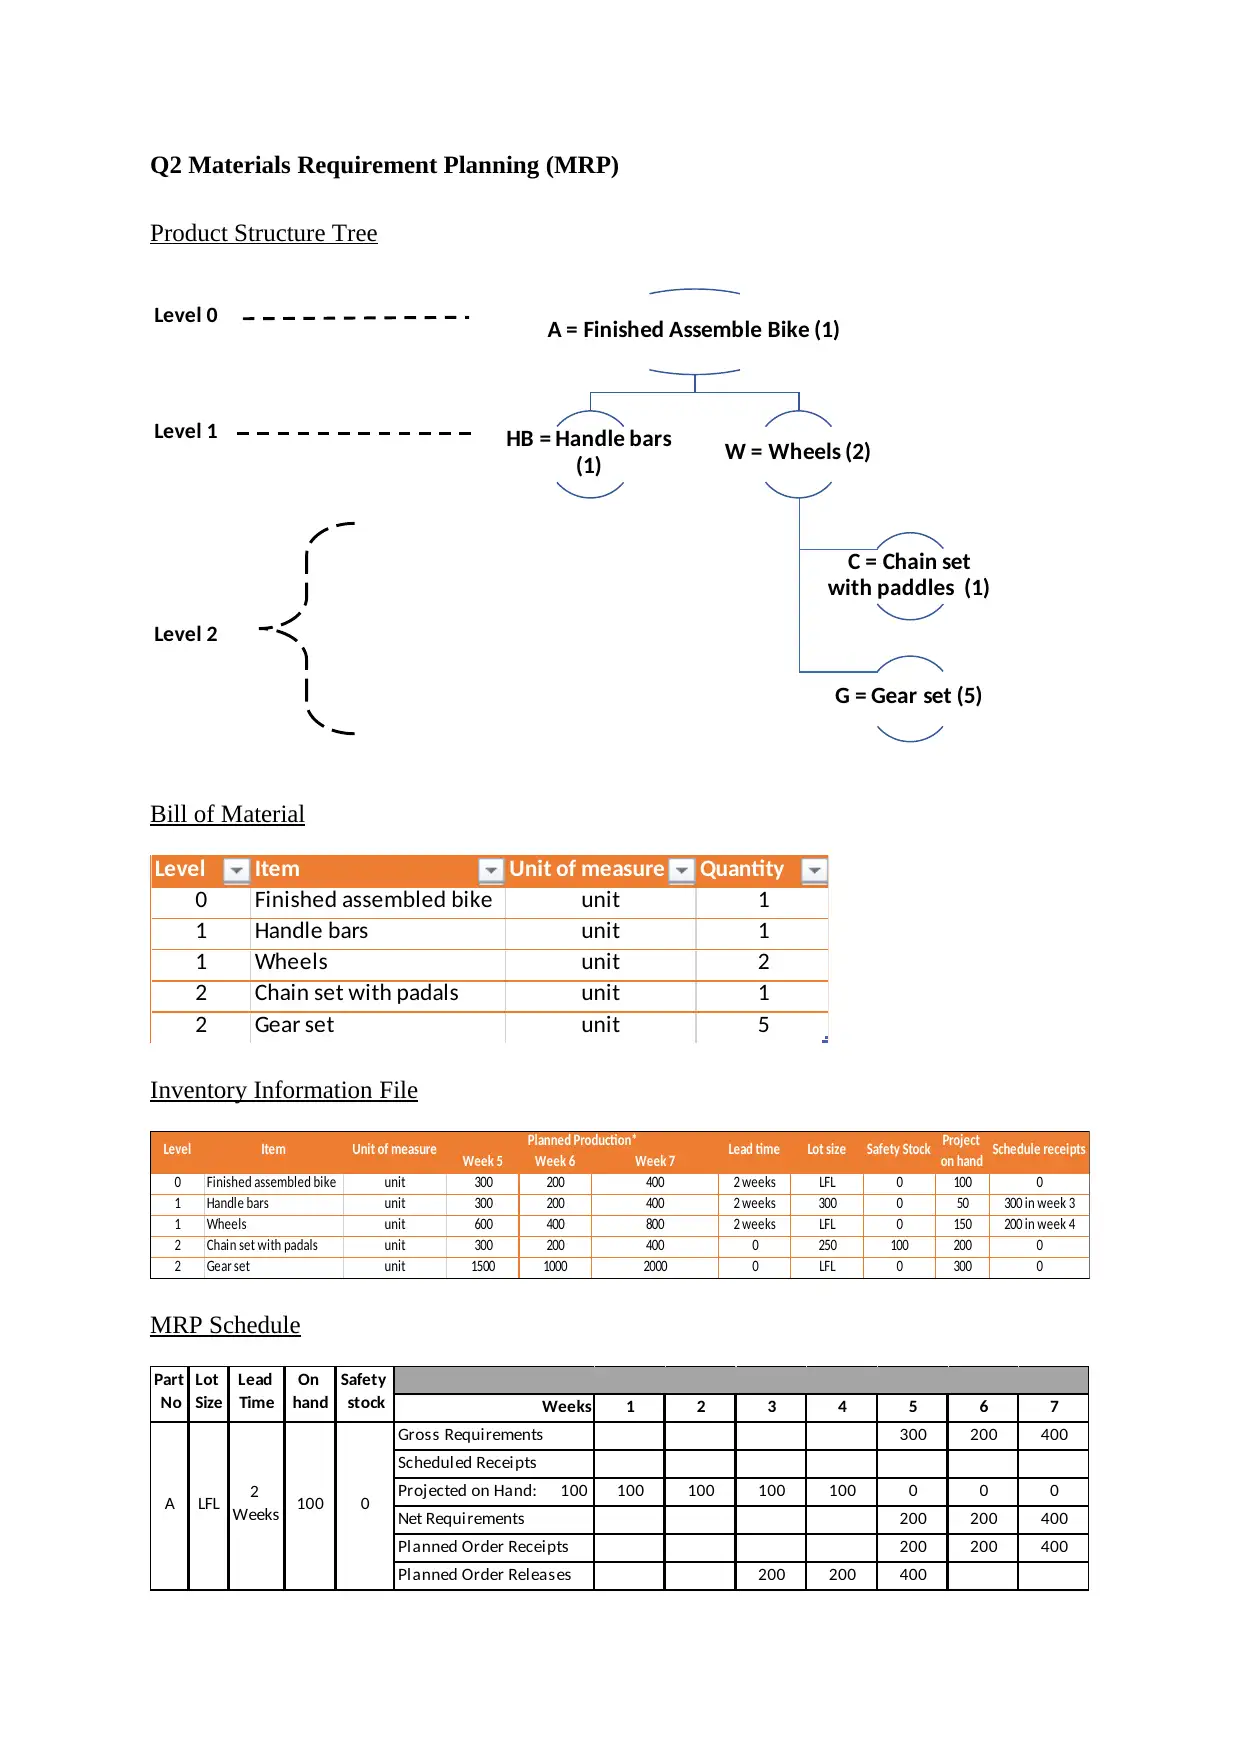
Q2 Materials Requirement Planning (MRP)
Product Structure Tree
Level 0
Level 1
Level 2
A = Finished Assemble Bike (1)
HB = Handle bars
(1) W = Wheels (2)
C = Chain set
with paddles (1)
G = Gear set (5)
Bill of Material
Level Item Unit of measure Quantity
0 Finished assembled bike unit 1
1 Handle bars unit 1
1 Wheels unit 2
2 Chain set with padals unit 1
2 Gear set unit 5
Inventory Information File
Week 5 Week 6 Week 7
0 Finished assembled bike unit 300 200 400 2 weeks LFL 0 100 0
1 Handle bars unit 300 200 400 2 weeks 300 0 50 300 in week 3
1 Wheels unit 600 400 800 2 weeks LFL 0 150 200 in week 4
2 Chain set with padals unit 300 200 400 0 250 100 200 0
2 Gear set unit 1500 1000 2000 0 LFL 0 300 0
Safety Stock Project
on hand Schedule receiptsLevel Item Unit of measure Planned Production* Lead time Lot size
MRP Schedule
Weeks 1 2 3 4 5 6 7
Gross Requirements 300 200 400
Scheduled Receipts
Projected on Hand: 100 100 100 100 100 0 0 0
Net Requirements 200 200 400
Planned Order Receipts 200 200 400
Planned Order Releases 200 200 400
Part
No
Lot
Size
Lead
Time
On
hand
Safety
stock
A LFL 2
Weeks 100 0
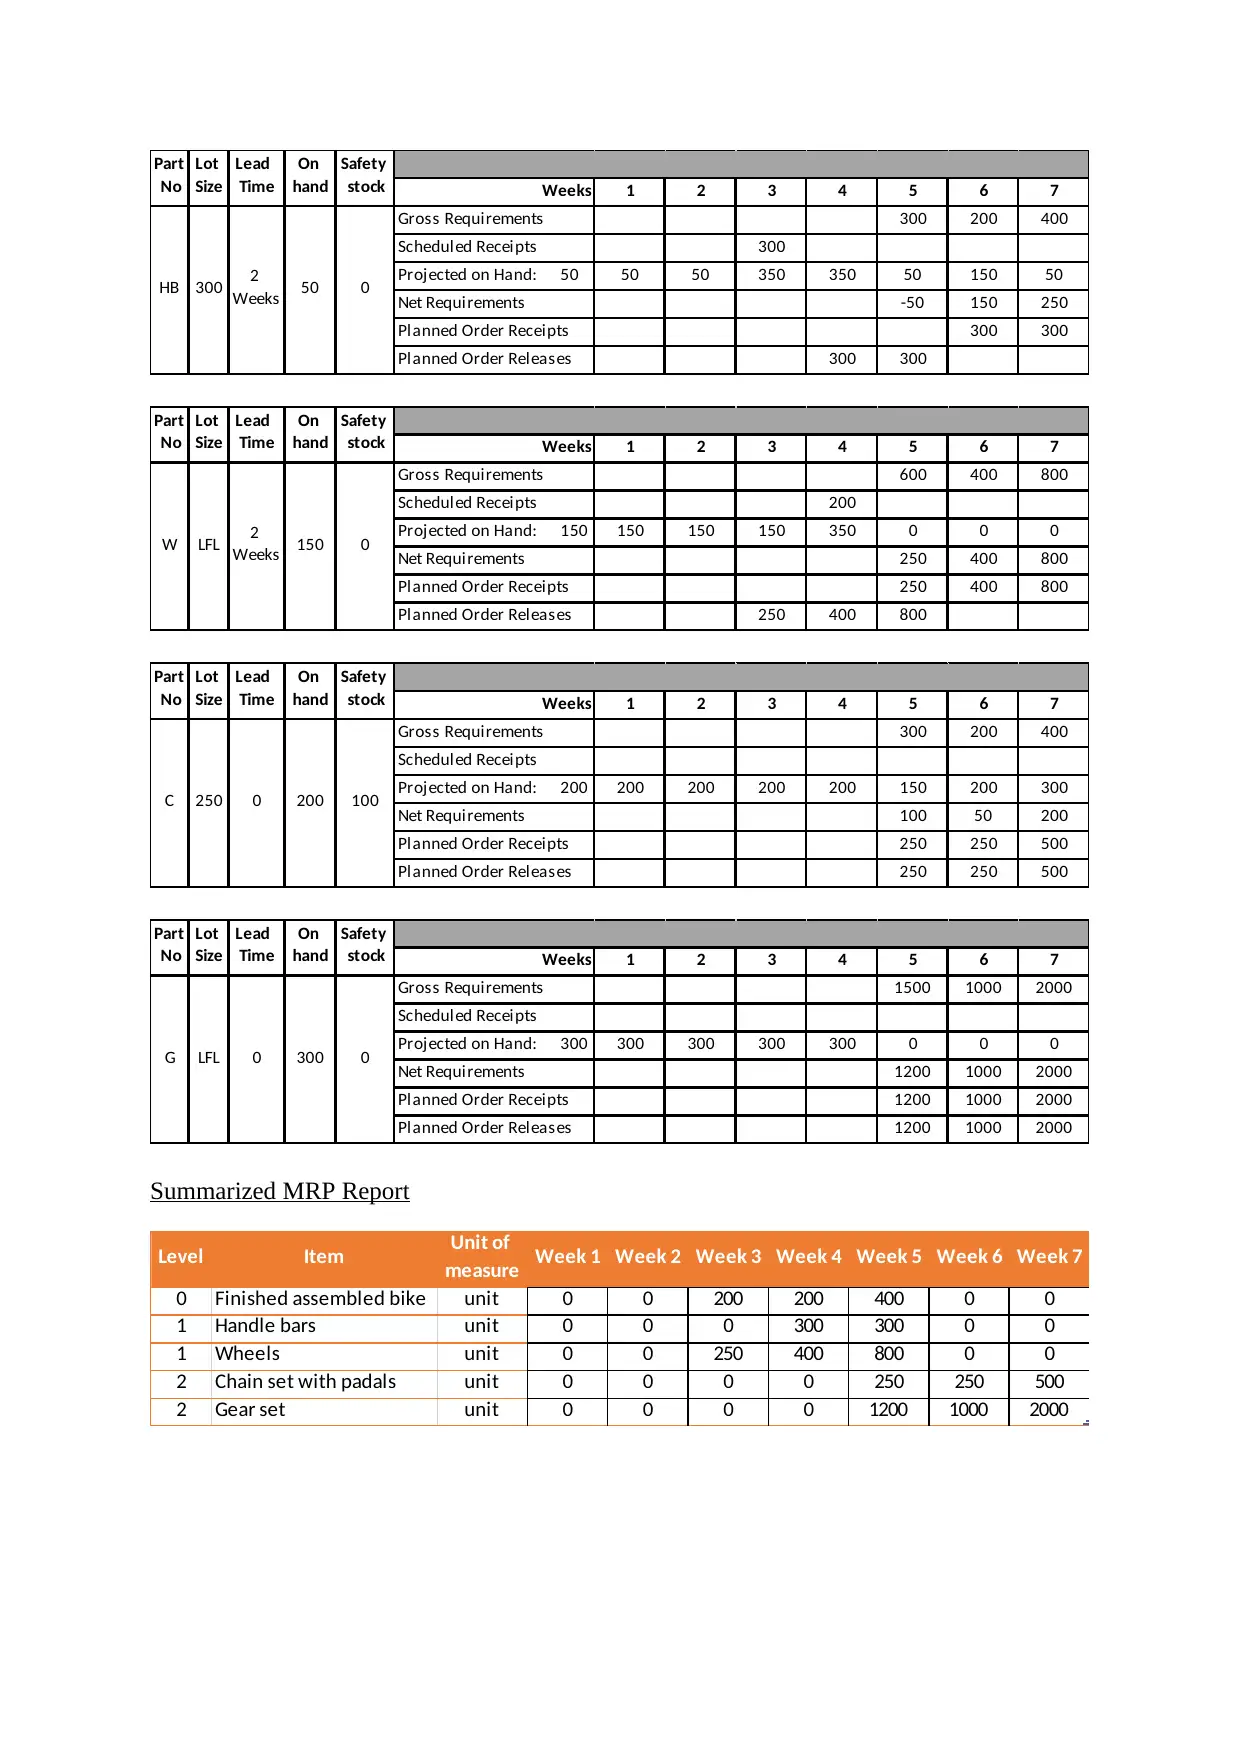
Weeks 1 2 3 4 5 6 7
Gross Requirements 300 200 400
Scheduled Receipts 300
Projected on Hand: 50 50 50 350 350 50 150 50
Net Requirements -50 150 250
Planned Order Receipts 300 300
Planned Order Releases 300 300
2
Weeks 50 0
Part
No
Lot
Size
Lead
Time
On
hand
Safety
stock
HB 300
Weeks 1 2 3 4 5 6 7
Gross Requirements 600 400 800
Scheduled Receipts 200
Projected on Hand: 150 150 150 150 350 0 0 0
Net Requirements 250 400 800
Planned Order Receipts 250 400 800
Planned Order Releases 250 400 800
W LFL 2
Weeks 150 0
Part
No
Lot
Size
Lead
Time
On
hand
Safety
stock
Weeks 1 2 3 4 5 6 7
Gross Requirements 300 200 400
Scheduled Receipts
Projected on Hand: 200 200 200 200 200 150 200 300
Net Requirements 100 50 200
Planned Order Receipts 250 250 500
Planned Order Releases 250 250 500
Lead
Time
On
hand
Safety
stock
C 250 0 200 100
Part
No
Lot
Size
Weeks 1 2 3 4 5 6 7
Gross Requirements 1500 1000 2000
Scheduled Receipts
Projected on Hand: 300 300 300 300 300 0 0 0
Net Requirements 1200 1000 2000
Planned Order Receipts 1200 1000 2000
Planned Order Releases 1200 1000 2000
Lead
Time
On
hand
Safety
stock
G LFL 0 300 0
Part
No
Lot
Size
Summarized MRP Report
Level Item Unit of
measure Week 1 Week 2 Week 3 Week 4 Week 5 Week 6 Week 7
0 Finished assembled bike unit 0 0 200 200 400 0 0
1 Handle bars unit 0 0 0 300 300 0 0
1 Wheels unit 0 0 250 400 800 0 0
2 Chain set with padals unit 0 0 0 0 250 250 500
2 Gear set unit 0 0 0 0 1200 1000 2000
Gross Requirements 300 200 400
Scheduled Receipts 300
Projected on Hand: 50 50 50 350 350 50 150 50
Net Requirements -50 150 250
Planned Order Receipts 300 300
Planned Order Releases 300 300
2
Weeks 50 0
Part
No
Lot
Size
Lead
Time
On
hand
Safety
stock
HB 300
Weeks 1 2 3 4 5 6 7
Gross Requirements 600 400 800
Scheduled Receipts 200
Projected on Hand: 150 150 150 150 350 0 0 0
Net Requirements 250 400 800
Planned Order Receipts 250 400 800
Planned Order Releases 250 400 800
W LFL 2
Weeks 150 0
Part
No
Lot
Size
Lead
Time
On
hand
Safety
stock
Weeks 1 2 3 4 5 6 7
Gross Requirements 300 200 400
Scheduled Receipts
Projected on Hand: 200 200 200 200 200 150 200 300
Net Requirements 100 50 200
Planned Order Receipts 250 250 500
Planned Order Releases 250 250 500
Lead
Time
On
hand
Safety
stock
C 250 0 200 100
Part
No
Lot
Size
Weeks 1 2 3 4 5 6 7
Gross Requirements 1500 1000 2000
Scheduled Receipts
Projected on Hand: 300 300 300 300 300 0 0 0
Net Requirements 1200 1000 2000
Planned Order Receipts 1200 1000 2000
Planned Order Releases 1200 1000 2000
Lead
Time
On
hand
Safety
stock
G LFL 0 300 0
Part
No
Lot
Size
Summarized MRP Report
Level Item Unit of
measure Week 1 Week 2 Week 3 Week 4 Week 5 Week 6 Week 7
0 Finished assembled bike unit 0 0 200 200 400 0 0
1 Handle bars unit 0 0 0 300 300 0 0
1 Wheels unit 0 0 250 400 800 0 0
2 Chain set with padals unit 0 0 0 0 250 250 500
2 Gear set unit 0 0 0 0 1200 1000 2000
⊘ This is a preview!⊘
Do you want full access?
Subscribe today to unlock all pages.
Trusted by 1+ million students worldwide
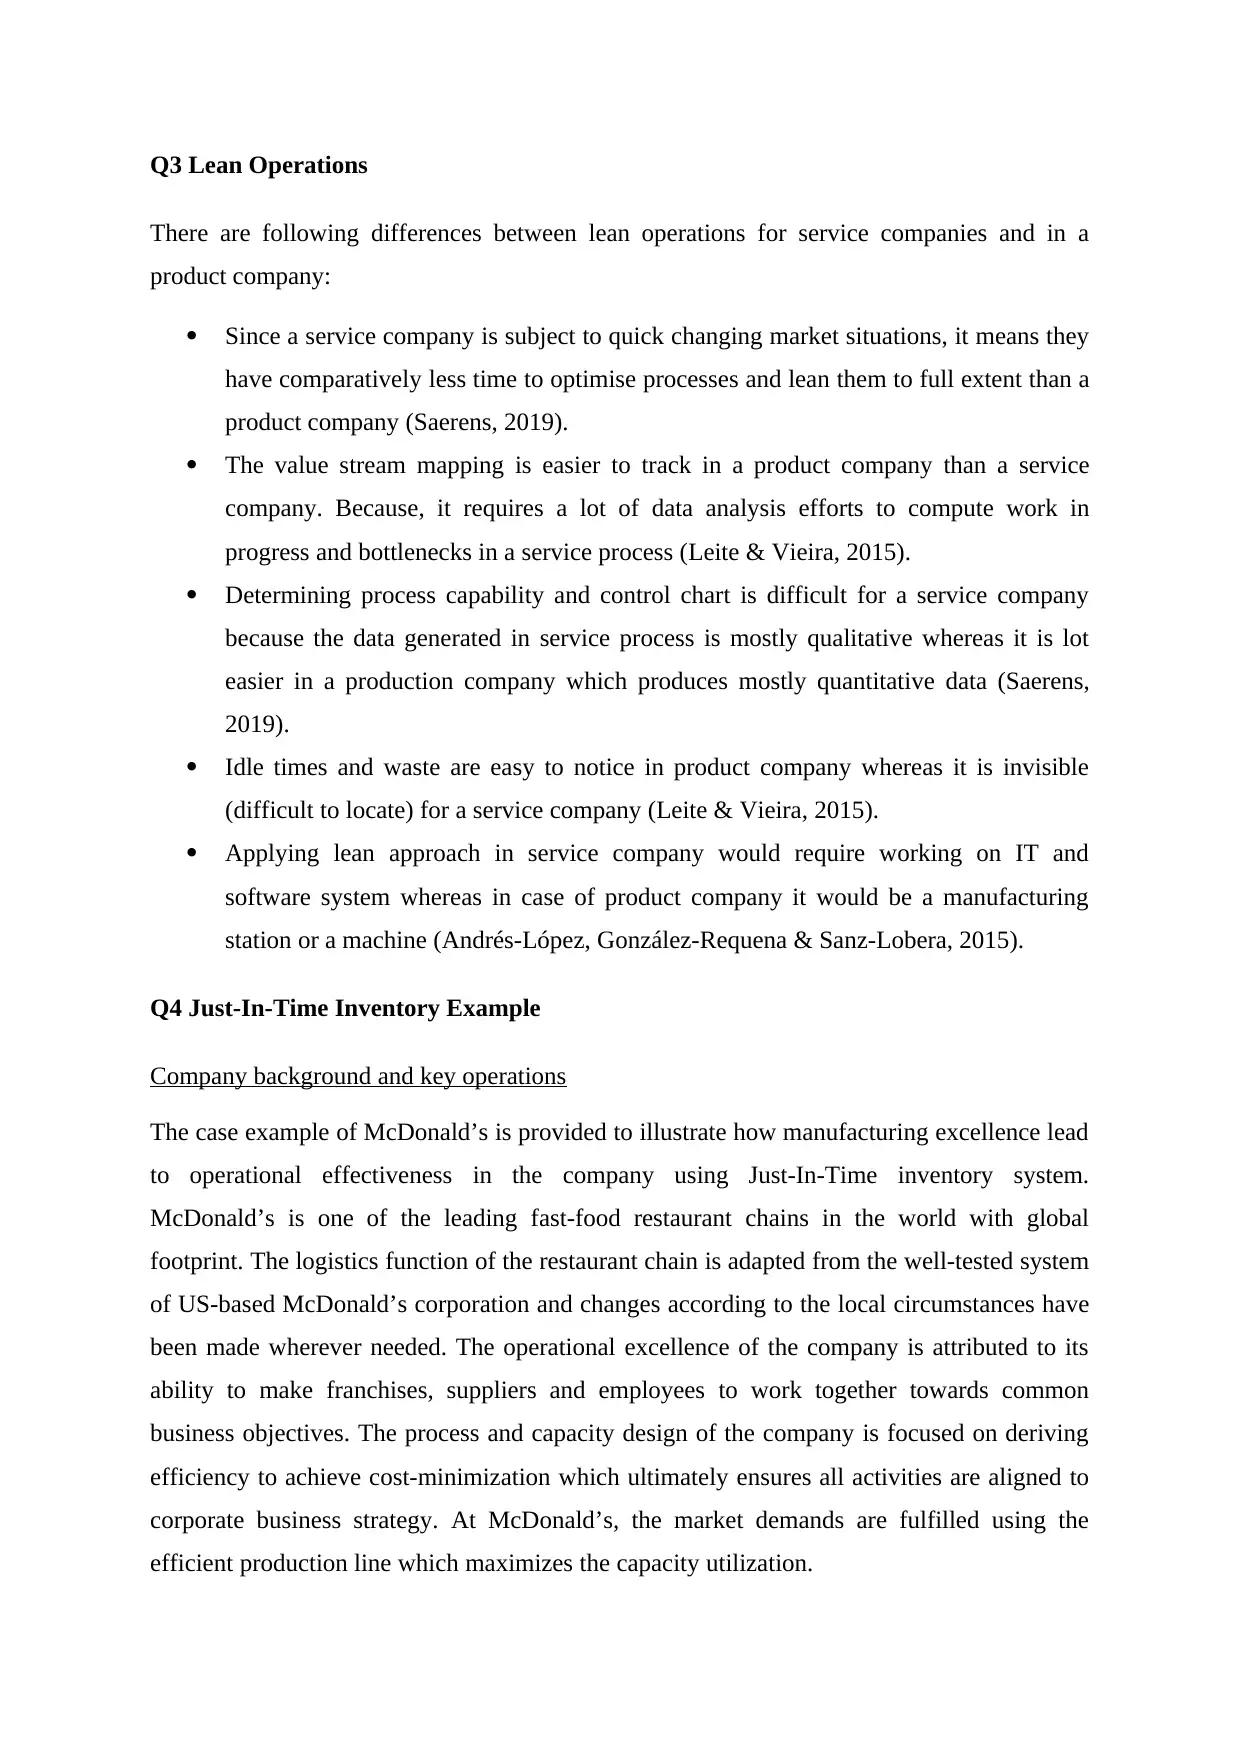
Q3 Lean Operations
There are following differences between lean operations for service companies and in a
product company:
Since a service company is subject to quick changing market situations, it means they
have comparatively less time to optimise processes and lean them to full extent than a
product company (Saerens, 2019).
The value stream mapping is easier to track in a product company than a service
company. Because, it requires a lot of data analysis efforts to compute work in
progress and bottlenecks in a service process (Leite & Vieira, 2015).
Determining process capability and control chart is difficult for a service company
because the data generated in service process is mostly qualitative whereas it is lot
easier in a production company which produces mostly quantitative data (Saerens,
2019).
Idle times and waste are easy to notice in product company whereas it is invisible
(difficult to locate) for a service company (Leite & Vieira, 2015).
Applying lean approach in service company would require working on IT and
software system whereas in case of product company it would be a manufacturing
station or a machine (Andrés-López, González-Requena & Sanz-Lobera, 2015).
Q4 Just-In-Time Inventory Example
Company background and key operations
The case example of McDonald’s is provided to illustrate how manufacturing excellence lead
to operational effectiveness in the company using Just-In-Time inventory system.
McDonald’s is one of the leading fast‐food restaurant chains in the world with global
footprint. The logistics function of the restaurant chain is adapted from the well-tested system
of US-based McDonald’s corporation and changes according to the local circumstances have
been made wherever needed. The operational excellence of the company is attributed to its
ability to make franchises, suppliers and employees to work together towards common
business objectives. The process and capacity design of the company is focused on deriving
efficiency to achieve cost-minimization which ultimately ensures all activities are aligned to
corporate business strategy. At McDonald’s, the market demands are fulfilled using the
efficient production line which maximizes the capacity utilization.
Paraphrase This Document
Need a fresh take? Get an instant paraphrase of this document with our AI Paraphraser
Benefits of using JI in McDonald
The leading fast food restaurant McDonald’s utilizes Just-In-Time inventory mechanism to
ensure optimum availability of raw materials and other ingredients at the time of preparing
burgers and other products. It also enables them to don’t put any unnecessary efforts until the
order has been taken, which minimises waste and reduce costs. Furthermore, it increases the
standardization of the process which ensures same quality experience at every time a
customer visits the joint (Heizer, Render & Munson, 2016).
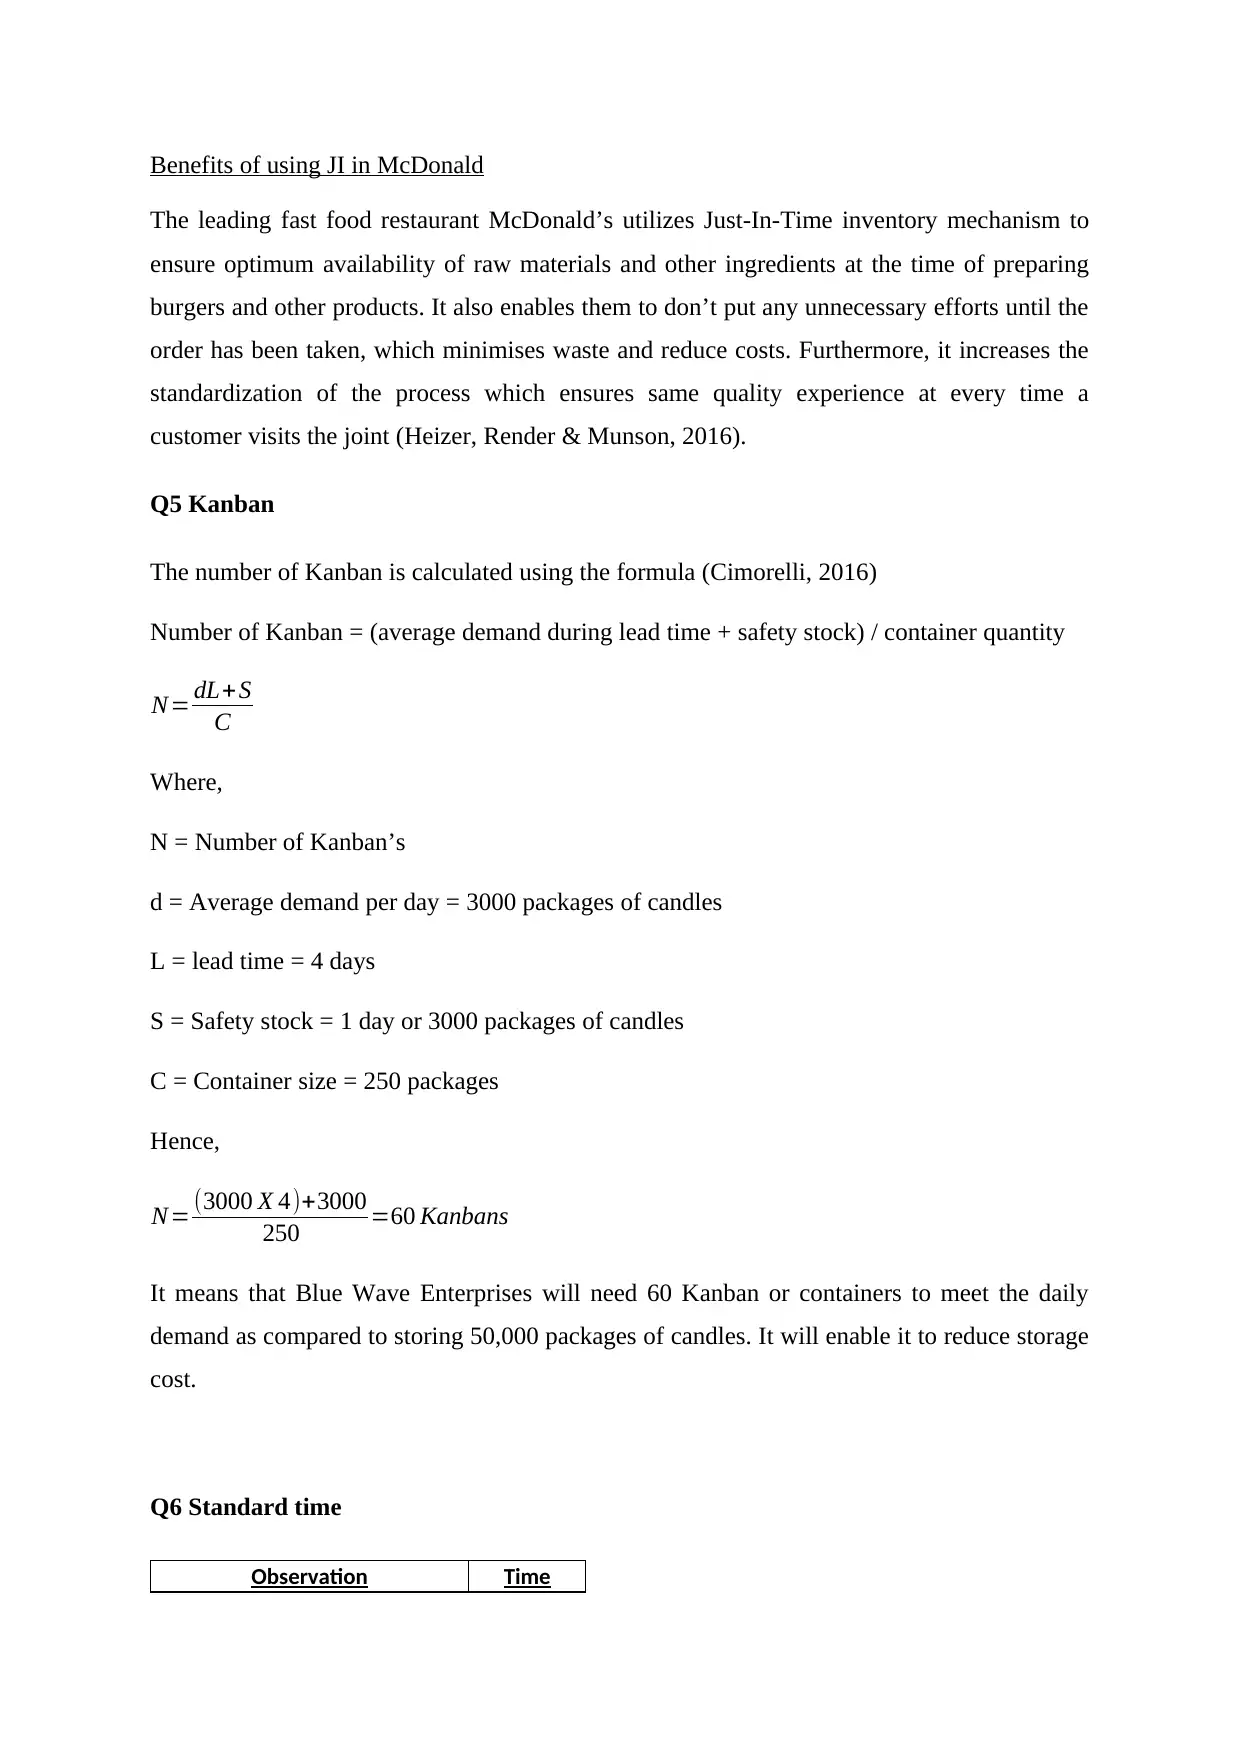
Q5 Kanban
The number of Kanban is calculated using the formula (Cimorelli, 2016)
Number of Kanban = (average demand during lead time + safety stock) / container quantity
N= dL+S
C
Where,
N = Number of Kanban’s
d = Average demand per day = 3000 packages of candles
L = lead time = 4 days
S = Safety stock = 1 day or 3000 packages of candles
C = Container size = 250 packages
Hence,
N= (3000 X 4)+3000
250 =60 Kanbans
It means that Blue Wave Enterprises will need 60 Kanban or containers to meet the daily
demand as compared to storing 50,000 packages of candles. It will enable it to reduce storage
cost.
Q6 Standard time
Observation Time
The leading fast food restaurant McDonald’s utilizes Just-In-Time inventory mechanism to
ensure optimum availability of raw materials and other ingredients at the time of preparing
burgers and other products. It also enables them to don’t put any unnecessary efforts until the
order has been taken, which minimises waste and reduce costs. Furthermore, it increases the
standardization of the process which ensures same quality experience at every time a
customer visits the joint (Heizer, Render & Munson, 2016).
Q5 Kanban
The number of Kanban is calculated using the formula (Cimorelli, 2016)
Number of Kanban = (average demand during lead time + safety stock) / container quantity
N= dL+S
C
Where,
N = Number of Kanban’s
d = Average demand per day = 3000 packages of candles
L = lead time = 4 days
S = Safety stock = 1 day or 3000 packages of candles
C = Container size = 250 packages
Hence,
N= (3000 X 4)+3000
250 =60 Kanbans
It means that Blue Wave Enterprises will need 60 Kanban or containers to meet the daily
demand as compared to storing 50,000 packages of candles. It will enable it to reduce storage
cost.
Q6 Standard time
Observation Time
(min)
1 7.17
2 7.23
3 6.98
4 7.05
5 7.54
6 7.33
7 7.11
8 7.27
9 7.09
10 6.99
Average Observation Time: 7.18
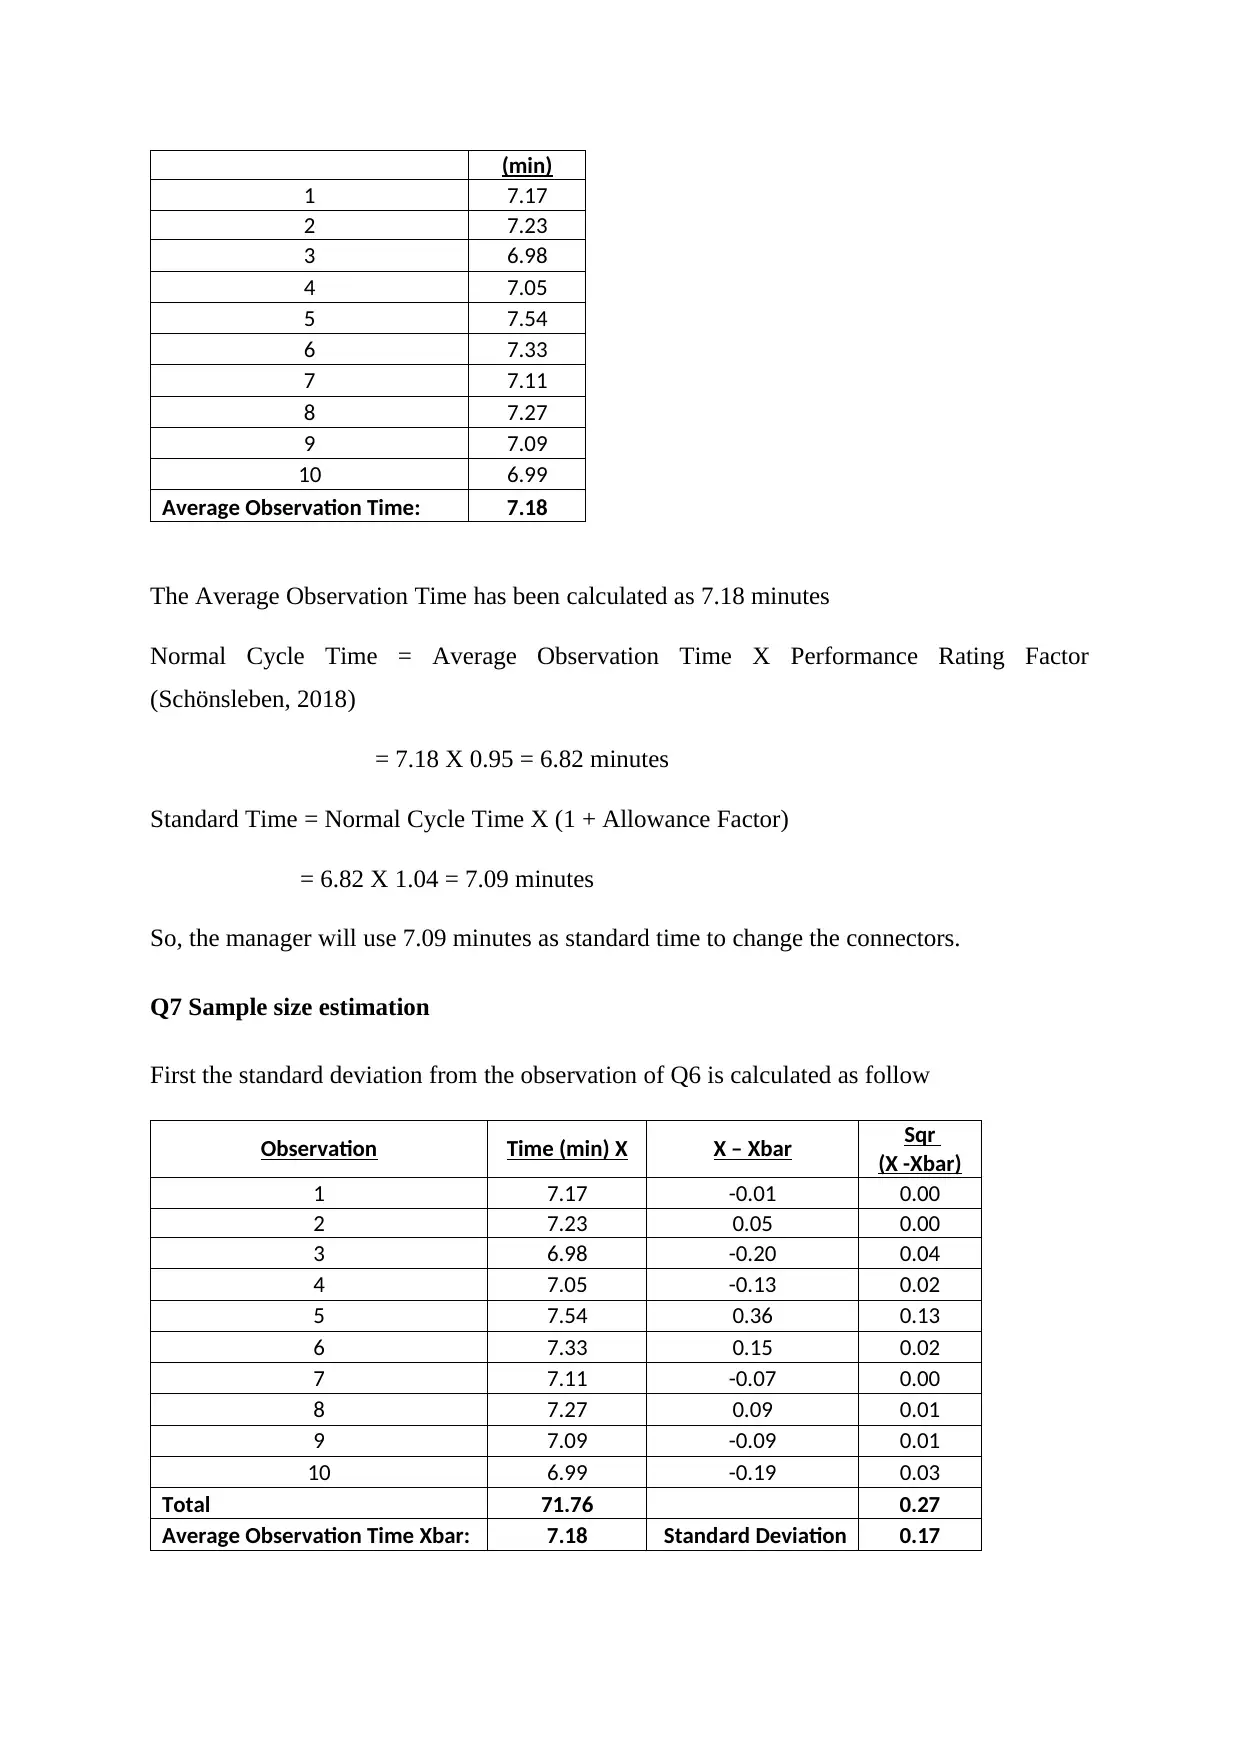
The Average Observation Time has been calculated as 7.18 minutes
Normal Cycle Time = Average Observation Time X Performance Rating Factor
(Schönsleben, 2018)
= 7.18 X 0.95 = 6.82 minutes
Standard Time = Normal Cycle Time X (1 + Allowance Factor)
= 6.82 X 1.04 = 7.09 minutes
So, the manager will use 7.09 minutes as standard time to change the connectors.
Q7 Sample size estimation
First the standard deviation from the observation of Q6 is calculated as follow
Observation Time (min) X X – Xbar Sqr
(X -Xbar)
1 7.17 -0.01 0.00
2 7.23 0.05 0.00
3 6.98 -0.20 0.04
4 7.05 -0.13 0.02
5 7.54 0.36 0.13
6 7.33 0.15 0.02
7 7.11 -0.07 0.00
8 7.27 0.09 0.01
9 7.09 -0.09 0.01
10 6.99 -0.19 0.03
Total 71.76 0.27
Average Observation Time Xbar: 7.18 Standard Deviation 0.17
1 7.17
2 7.23
3 6.98
4 7.05
5 7.54
6 7.33
7 7.11
8 7.27
9 7.09
10 6.99
Average Observation Time: 7.18
The Average Observation Time has been calculated as 7.18 minutes
Normal Cycle Time = Average Observation Time X Performance Rating Factor
(Schönsleben, 2018)
= 7.18 X 0.95 = 6.82 minutes
Standard Time = Normal Cycle Time X (1 + Allowance Factor)
= 6.82 X 1.04 = 7.09 minutes
So, the manager will use 7.09 minutes as standard time to change the connectors.
Q7 Sample size estimation
First the standard deviation from the observation of Q6 is calculated as follow
Observation Time (min) X X – Xbar Sqr
(X -Xbar)
1 7.17 -0.01 0.00
2 7.23 0.05 0.00
3 6.98 -0.20 0.04
4 7.05 -0.13 0.02
5 7.54 0.36 0.13
6 7.33 0.15 0.02
7 7.11 -0.07 0.00
8 7.27 0.09 0.01
9 7.09 -0.09 0.01
10 6.99 -0.19 0.03
Total 71.76 0.27
Average Observation Time Xbar: 7.18 Standard Deviation 0.17
⊘ This is a preview!⊘
Do you want full access?
Subscribe today to unlock all pages.
Trusted by 1+ million students worldwide
=
√ ∑ ( X −Xbar )2
n−1
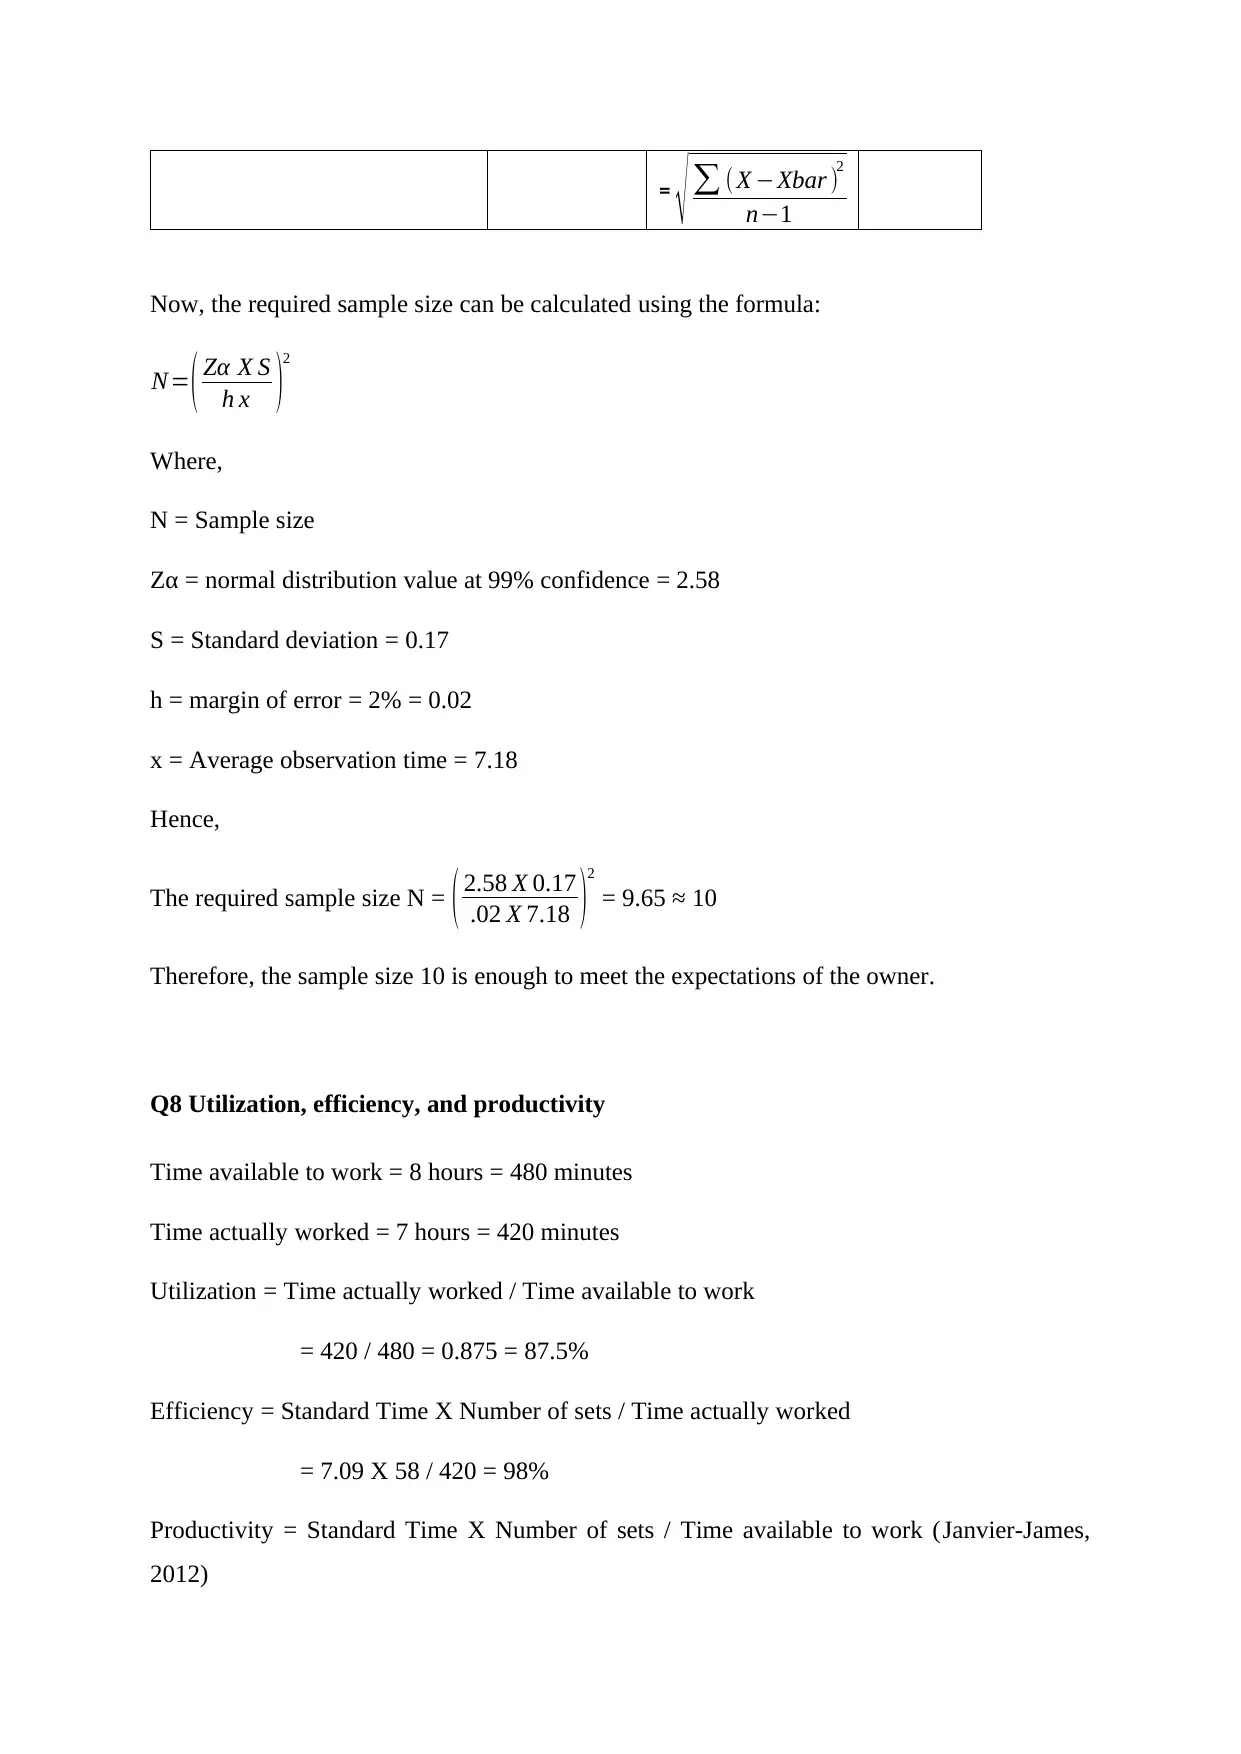
Now, the required sample size can be calculated using the formula:
N= ( Zα X S
h x )
2
Where,
N = Sample size
Zα = normal distribution value at 99% confidence = 2.58
S = Standard deviation = 0.17
h = margin of error = 2% = 0.02
x = Average observation time = 7.18
Hence,
The required sample size N = ( 2.58 X 0.17
.02 X 7.18 )2
= 9.65 ≈ 10
Therefore, the sample size 10 is enough to meet the expectations of the owner.
Q8 Utilization, efficiency, and productivity
Time available to work = 8 hours = 480 minutes
Time actually worked = 7 hours = 420 minutes
Utilization = Time actually worked / Time available to work
= 420 / 480 = 0.875 = 87.5%
Efficiency = Standard Time X Number of sets / Time actually worked
= 7.09 X 58 / 420 = 98%
Productivity = Standard Time X Number of sets / Time available to work (Janvier-James,
2012)
√ ∑ ( X −Xbar )2
n−1
Now, the required sample size can be calculated using the formula:
N= ( Zα X S
h x )
2
Where,
N = Sample size
Zα = normal distribution value at 99% confidence = 2.58
S = Standard deviation = 0.17
h = margin of error = 2% = 0.02
x = Average observation time = 7.18
Hence,
The required sample size N = ( 2.58 X 0.17
.02 X 7.18 )2
= 9.65 ≈ 10
Therefore, the sample size 10 is enough to meet the expectations of the owner.
Q8 Utilization, efficiency, and productivity
Time available to work = 8 hours = 480 minutes
Time actually worked = 7 hours = 420 minutes
Utilization = Time actually worked / Time available to work
= 420 / 480 = 0.875 = 87.5%
Efficiency = Standard Time X Number of sets / Time actually worked
= 7.09 X 58 / 420 = 98%
Productivity = Standard Time X Number of sets / Time available to work (Janvier-James,
2012)
Paraphrase This Document
Need a fresh take? Get an instant paraphrase of this document with our AI Paraphraser
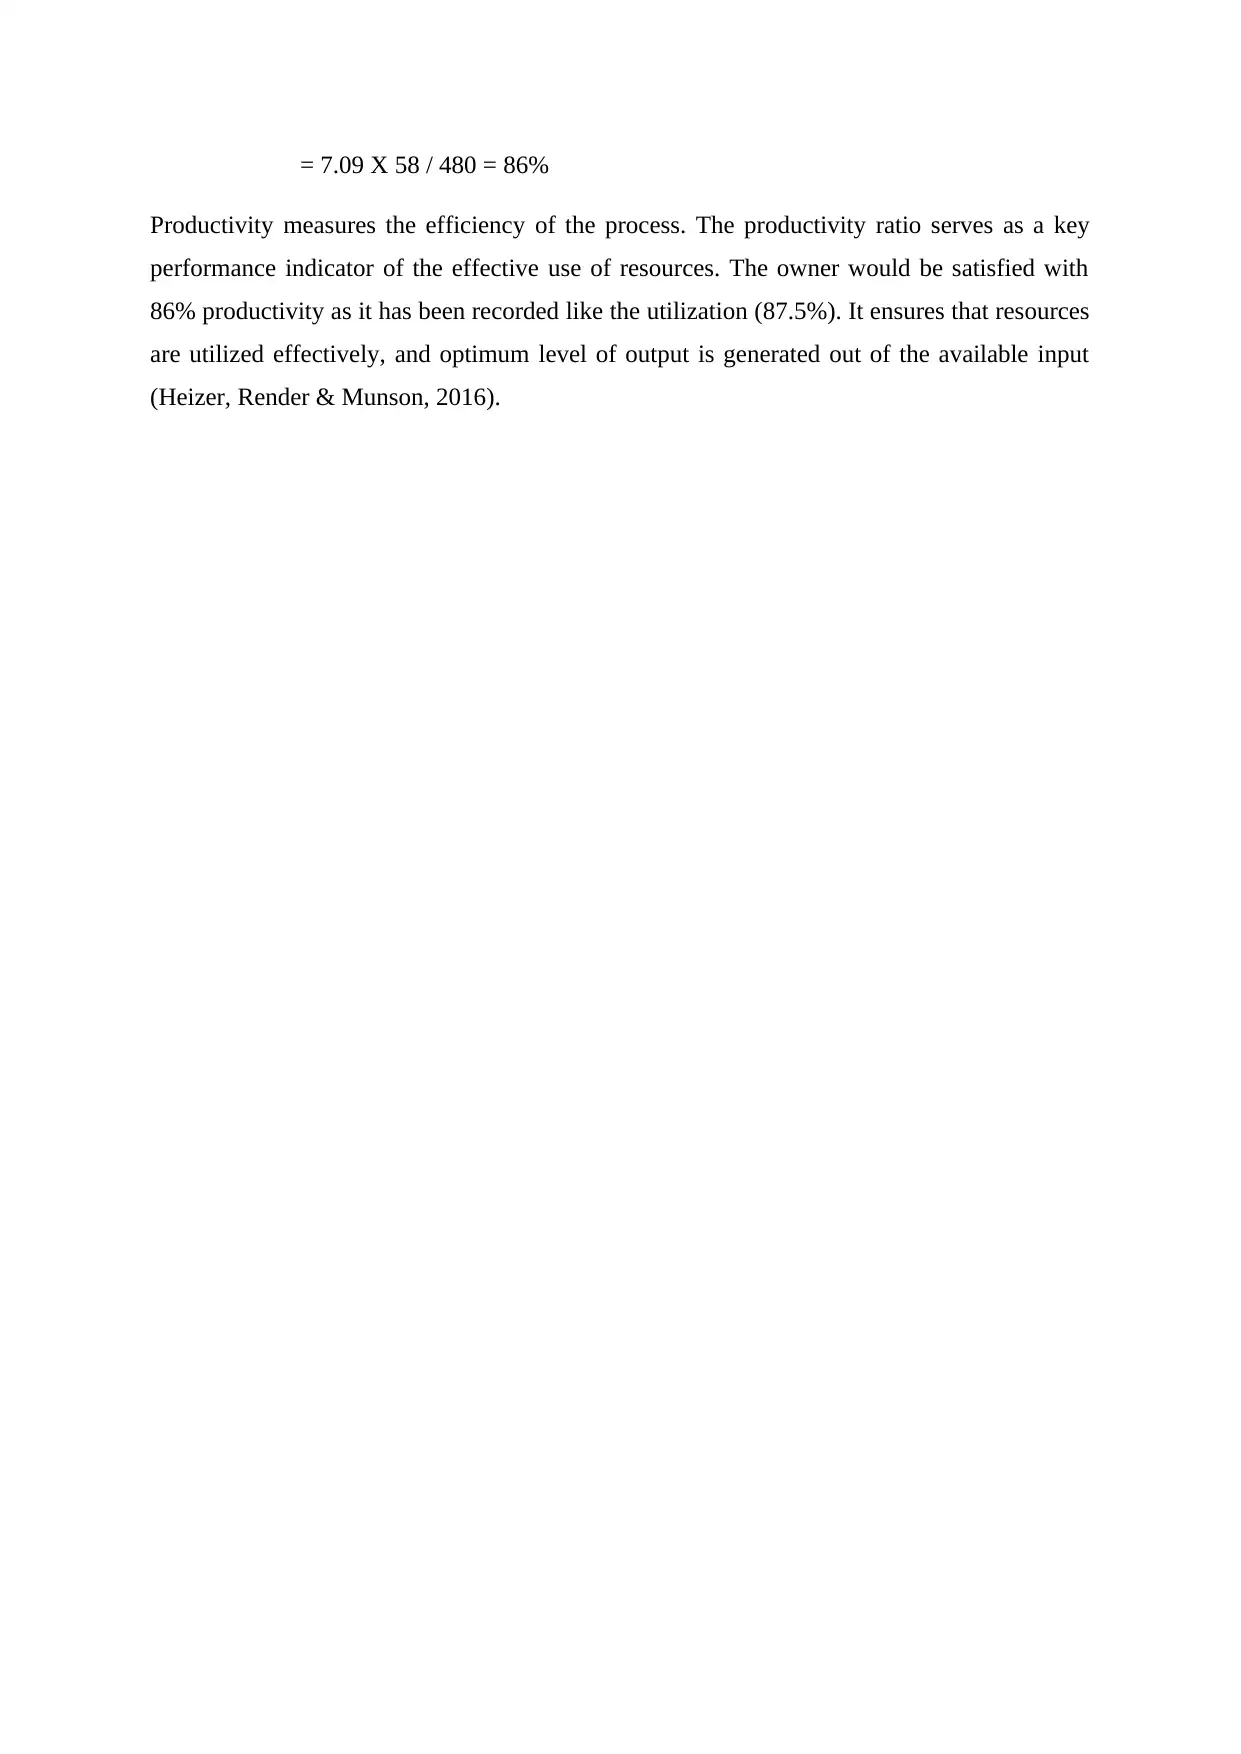
= 7.09 X 58 / 480 = 86%
Productivity measures the efficiency of the process. The productivity ratio serves as a key
performance indicator of the effective use of resources. The owner would be satisfied with
86% productivity as it has been recorded like the utilization (87.5%). It ensures that resources
are utilized effectively, and optimum level of output is generated out of the available input
(Heizer, Render & Munson, 2016).
References
Andrés-López, E., González-Requena, I., & Sanz-Lobera, A. (2015). Lean service:
reassessment of lean manufacturing for service activities. Procedia engineering, 132,
23-30.
Carey, S. (2018). SAP S/4HANA public cloud takes the biscuit for Pladis. Available at:
https://www.computerworld.com/article/3427788/sap-s-4hana-public-cloud-takes-the-
biscuit-for-pladis.html (Accessed: 14 August 2019).
Cimorelli, S. (2016). Kanban for the supply chain: fundamental practices for manufacturing
management. Productivity Press.
Heizer, J., Render, B., & Munson, C. (2016). Principles of operations management:
sustainability and supply chain management. Pearson Higher Ed.
Janvier-James, A. M. (2012). A new introduction to supply chains and supply chain
management: Definitions and theories perspective. International Business
Research, 5(1), 194-207.
Leite, H. D. R., & Vieira, G. E. (2015). Lean philosophy and its applications in the service
industry: a review of the current knowledge. Production, 25(3), 529-541.
Pladis. (2019). We promise happiness to the world with every bite. Available at:
https://www.pladisglobal.com/ (Accessed: 14 August 2019).
Saerens, S. (2019). Lean and six sigma in service and manufacturing industries. Available at:
https://www.isixsigma.com/methodology/lean-and-six-sigma-service-and-
manufacturing-industries/ (Accessed: 14 August 2019).
Schönsleben, P. (2018). Integral logistics management: operations and supply chain
management within and across companies. CRC Press.
⊘ This is a preview!⊘
Do you want full access?
Subscribe today to unlock all pages.
Trusted by 1+ million students worldwide
1 out of 13

Your All-in-One AI-Powered Toolkit for Academic Success.
+13062052269
info@desklib.com
Available 24*7 on WhatsApp / Email
![[object Object]](/_next/static/media/star-bottom.7253800d.svg)
Unlock your academic potential
Copyright © 2020–2026 A2Z Services. All Rights Reserved. Developed and managed by ZUCOL.