MGT723 Research Project: Data Analysis of Carbon Emission Reduction
VerifiedAdded on 2023/06/03
|21
|4957
|461
Project
AI Summary
This research project investigates the influence of management's responsibility on carbon emission reduction within organizations, focusing on the top five polluting countries: China, India, Japan, Russia, and the USA. The study uses descriptive and inferential statistics to analyze data from 2012, examining the relationship between board responsibility, management incentives, and carbon emission reduction. The findings reveal insights into the frequency of carbon emissions across different countries, the central tendency and dispersion of board responsibility, and the impact of management incentives on reducing carbon emissions. Statistical tests, including ANOVA and normality tests, are conducted to validate the hypothesis that higher board responsibility leads to greater carbon emission reduction. The project also explores the role of management incentives as a moderating variable in achieving carbon emission reduction targets. Desklib provides a platform for students to access similar solved assignments and past papers for further research and study.

MGT723 Research Project
Assessment Task 2: Data Collection
Student Name: Diksha Gautam
Title: Carbon Emission Reduction
Submission Date: 14/09/2018
Assessment Task 2: Data Collection
Student Name: Diksha Gautam
Title: Carbon Emission Reduction
Submission Date: 14/09/2018
Paraphrase This Document
Need a fresh take? Get an instant paraphrase of this document with our AI Paraphraser
Acknowledgement:
I certify that I have carefully reviewed the university’s academic misconduct policy. I
understand that the source of ideas must be referenced and that quotation marks and a
reference are required when directly quoting anyone else’s words.
Note that you are permitted to change your research question and hypothesis as your
research project develops over the semester. If you make changes you should note,
however, that you will need to update your conceptual model, hypothesis, theoretical
constructs and proxy measures accordingly. Although these not assessed directly, your
submission in Task 2 and Task 3 will be evaluated in the context of your stated conceptual
model etc.
2 | P a g e
Introduction
This paper talks about does higher influence of Management’s Responsibility for climate
change within an Organization helps to reduce carbon emission. Management are ones who
handle organizations. Managers and Board of Director (BOD) are expected to reduce
emission in the organization and provide awareness of the physical, political and social risks
originate from the impacts of climate change (Wittneben and Kiyar, 2018)
Literature Review – Summary
Carbon emissions are increasing rapidly in developing countries because of the international
climate change mitigation treaty of Kyoto Protocol. There is increase from 33% to 40% in
1990 and 1997 respectively. Kyoto Protocol is negotiated in 1997 and it commits signatories
to achieve specific greenhouse gas (GHG) or carbon emission reduction targets (Kalu, Buang
and Aliagha, 2016). The four-determinant factor such as Social factor, economic factor, the
financial market factor and the institutional factor are included for carbon emissions
reduction. Because of the attendant implication of climate disasters developing countries
like India, China, Colombia, Malaysia and others must face increasing rate of carbon
emissions which can be move up to 70%. Due to this, developing country should make
contribution in any form of mitigation program for the achievement of success (Kalu, Buang
and Aliagha, 2016).
Management responsibilities are one due to which there will be reduction in carbon
emission. Due to the proper management actions it helps to reduce carbon emission and
helps to observe how company can respond pressures in a global organization (Lane, 2010).
If there will be explore of management actions by the Board of Director or by the manager
of the organization related with air travel of employees, by drawing how managerial
practice can affect organization’s environmental impact (Fraser, 2012). In London,
management introduce an internal EMCS to reduce carbon emission for Beta’s Company. In
that analysis they also compare that whether management incentives influence travellers or
not due to which there will be reduction in carbon emission. When management actions
were taken in the Beta’s company by following the steps like understanding the significant
clients, identifying travellers in terms of carbon impact, producing carbon impact statement
3 | P a g e
⊘ This is a preview!⊘
Do you want full access?
Subscribe today to unlock all pages.
Trusted by 1+ million students worldwide
with individual traveller, identifying significant travel routes in terms of carbon impact, to
reduce journey work with top travellers, by introducing incentive scheme to encourage
travellers, increasing the awareness as well as use of technology and lastly improving use of
communication channels there was reduction in carbon emission. Therefore, due to
management responsibility in an organization by following management incentive there will
be reduction in carbon emission (Giacomo, Guthrie and Farneti, 2017).
Stakeholders are the individuals who can affect the firm or who the actions of the
corporation can affect. Stakeholders comprise the workers, clients, competitors, and
creditors. The stakeholder theory posits that the corporations are responsible to not only
shareholders but to a group of stakeholders, which is broad (Bridoux and Stoelhorst, 2014).
According to Bridoux and Stoelhorst (2014), Edward Freeman is the one who proposed the
stakeholder theory. Edward Freeman acknowledged the theory as an essential component
of Corporate Social Responsibility. Corporate social responsibility (CSR) identifies the
companies’ responsibilities, which are philanthropic, ethical, and economic. The stakeholder
theory posits that the managers of the companies are supposed to take care of all the
stakeholders of the firm when making governance decisions. The managers should reduce
conflict that exists between the interests of the stakeholders (Kuo, Yah and Yu, 2012)
Therefore, from this review we can conclude that there is relation between management
responsibilities for climate change in an organization, relation with stakeholder to reduce
carbon emission.
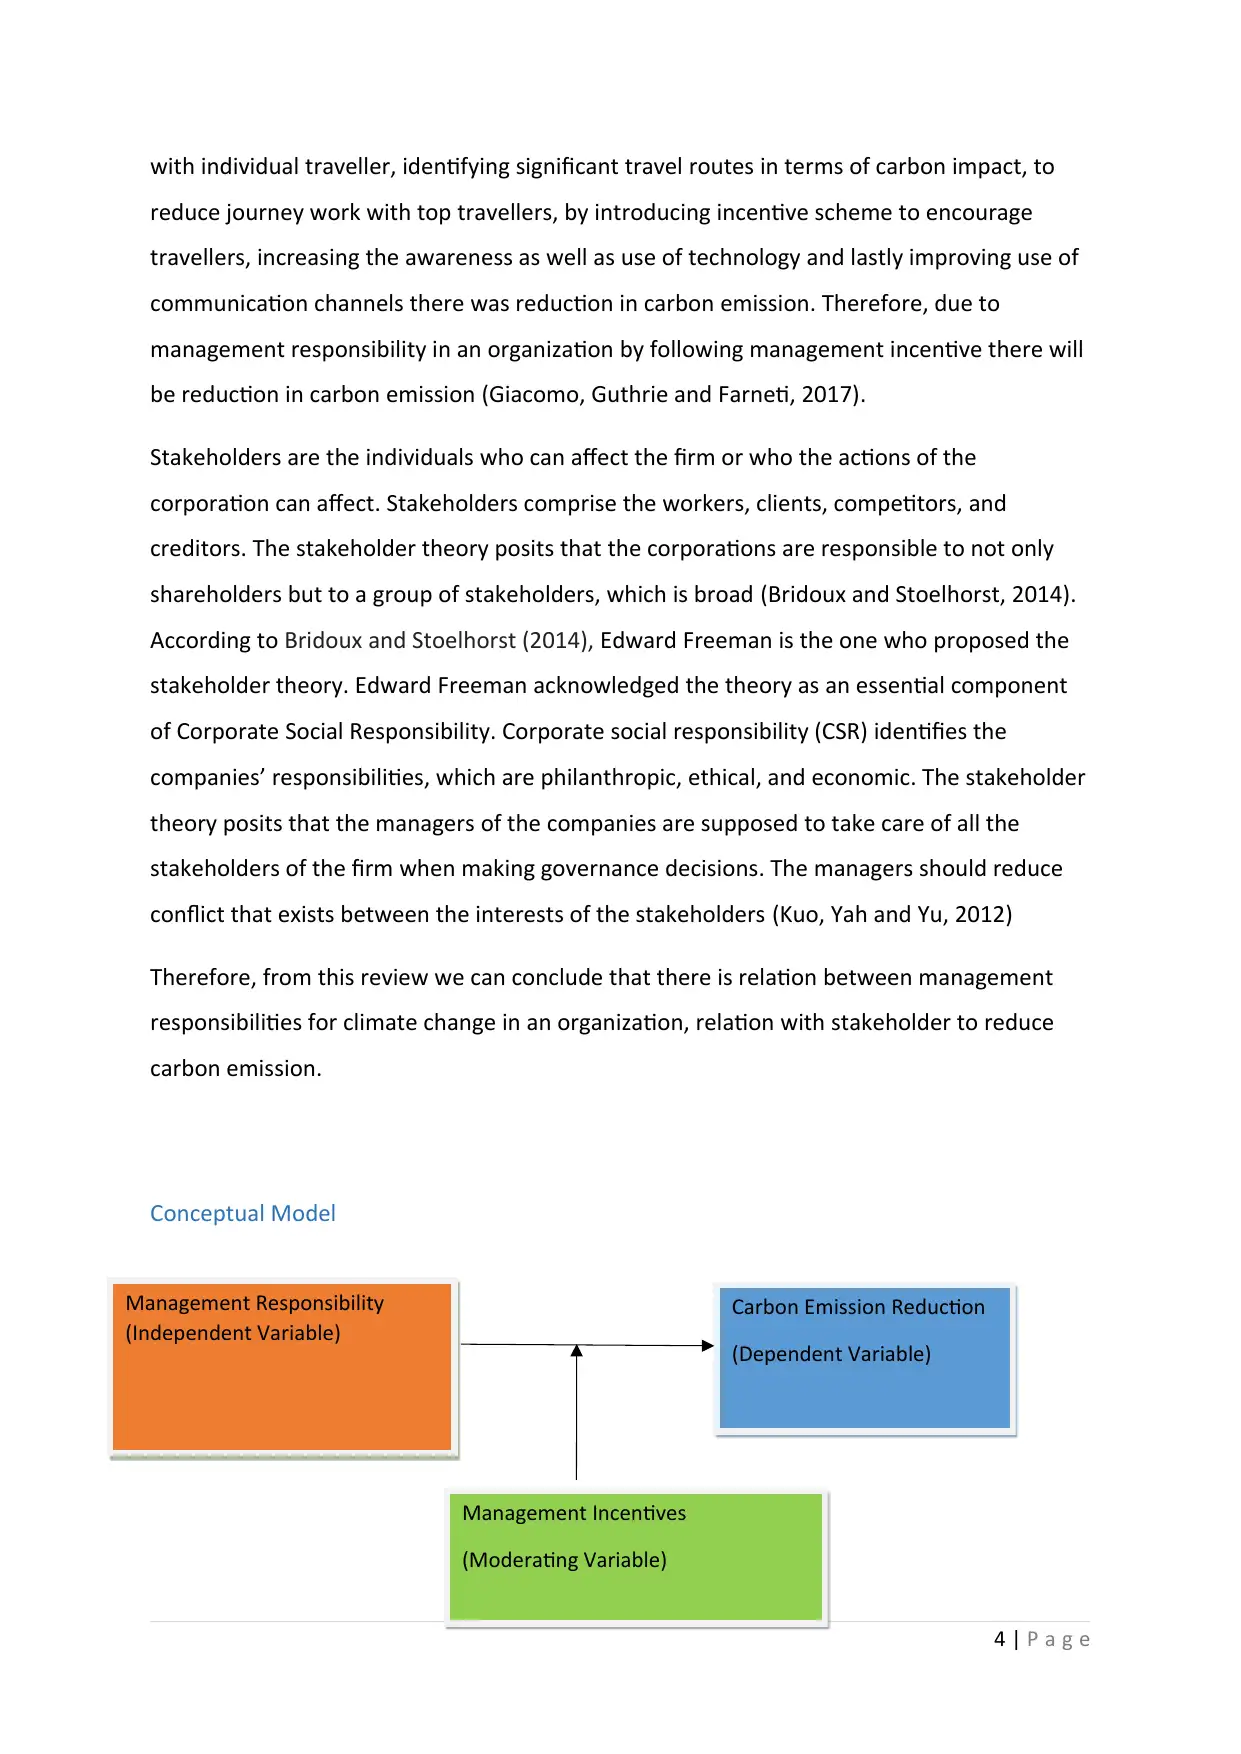
Conceptual Model
4 | P a g e
Management Responsibility
(Independent Variable)
Carbon Emission Reduction
(Dependent Variable)
Management Incentives
(Moderating Variable)
reduce journey work with top travellers, by introducing incentive scheme to encourage
travellers, increasing the awareness as well as use of technology and lastly improving use of
communication channels there was reduction in carbon emission. Therefore, due to
management responsibility in an organization by following management incentive there will
be reduction in carbon emission (Giacomo, Guthrie and Farneti, 2017).
Stakeholders are the individuals who can affect the firm or who the actions of the
corporation can affect. Stakeholders comprise the workers, clients, competitors, and
creditors. The stakeholder theory posits that the corporations are responsible to not only
shareholders but to a group of stakeholders, which is broad (Bridoux and Stoelhorst, 2014).
According to Bridoux and Stoelhorst (2014), Edward Freeman is the one who proposed the
stakeholder theory. Edward Freeman acknowledged the theory as an essential component
of Corporate Social Responsibility. Corporate social responsibility (CSR) identifies the
companies’ responsibilities, which are philanthropic, ethical, and economic. The stakeholder
theory posits that the managers of the companies are supposed to take care of all the
stakeholders of the firm when making governance decisions. The managers should reduce
conflict that exists between the interests of the stakeholders (Kuo, Yah and Yu, 2012)
Therefore, from this review we can conclude that there is relation between management
responsibilities for climate change in an organization, relation with stakeholder to reduce
carbon emission.
Conceptual Model
4 | P a g e
Management Responsibility
(Independent Variable)
Carbon Emission Reduction
(Dependent Variable)
Management Incentives
(Moderating Variable)
Paraphrase This Document
Need a fresh take? Get an instant paraphrase of this document with our AI Paraphraser
Hypotheses
Higher the influence of Board Responsibility for the climate change in an organization higher
will be carbon emission reduction.
Data Collection
This paper uses descriptive and inferential statistics to investigate the relationship between
dependent and independent variables. The dependent variable is Carbon Emission
Reduction and independent variable is Board Responsible. Management Incentive is
moderating variable.
For the propose of this paper, only 5 most polluter’s countries China, India, Japan, Russia
and USA are included and rest are excluded from the data. Among 55 countries only 5
countries are taken in this paper. From 2011-2017 data are eliminated from 2294 samples
to 847. Data are selected from Carbon emission reduction for the year 2012. All the missing
data, unappropriated data are also deleted from the excel sheet.
5 | P a g e
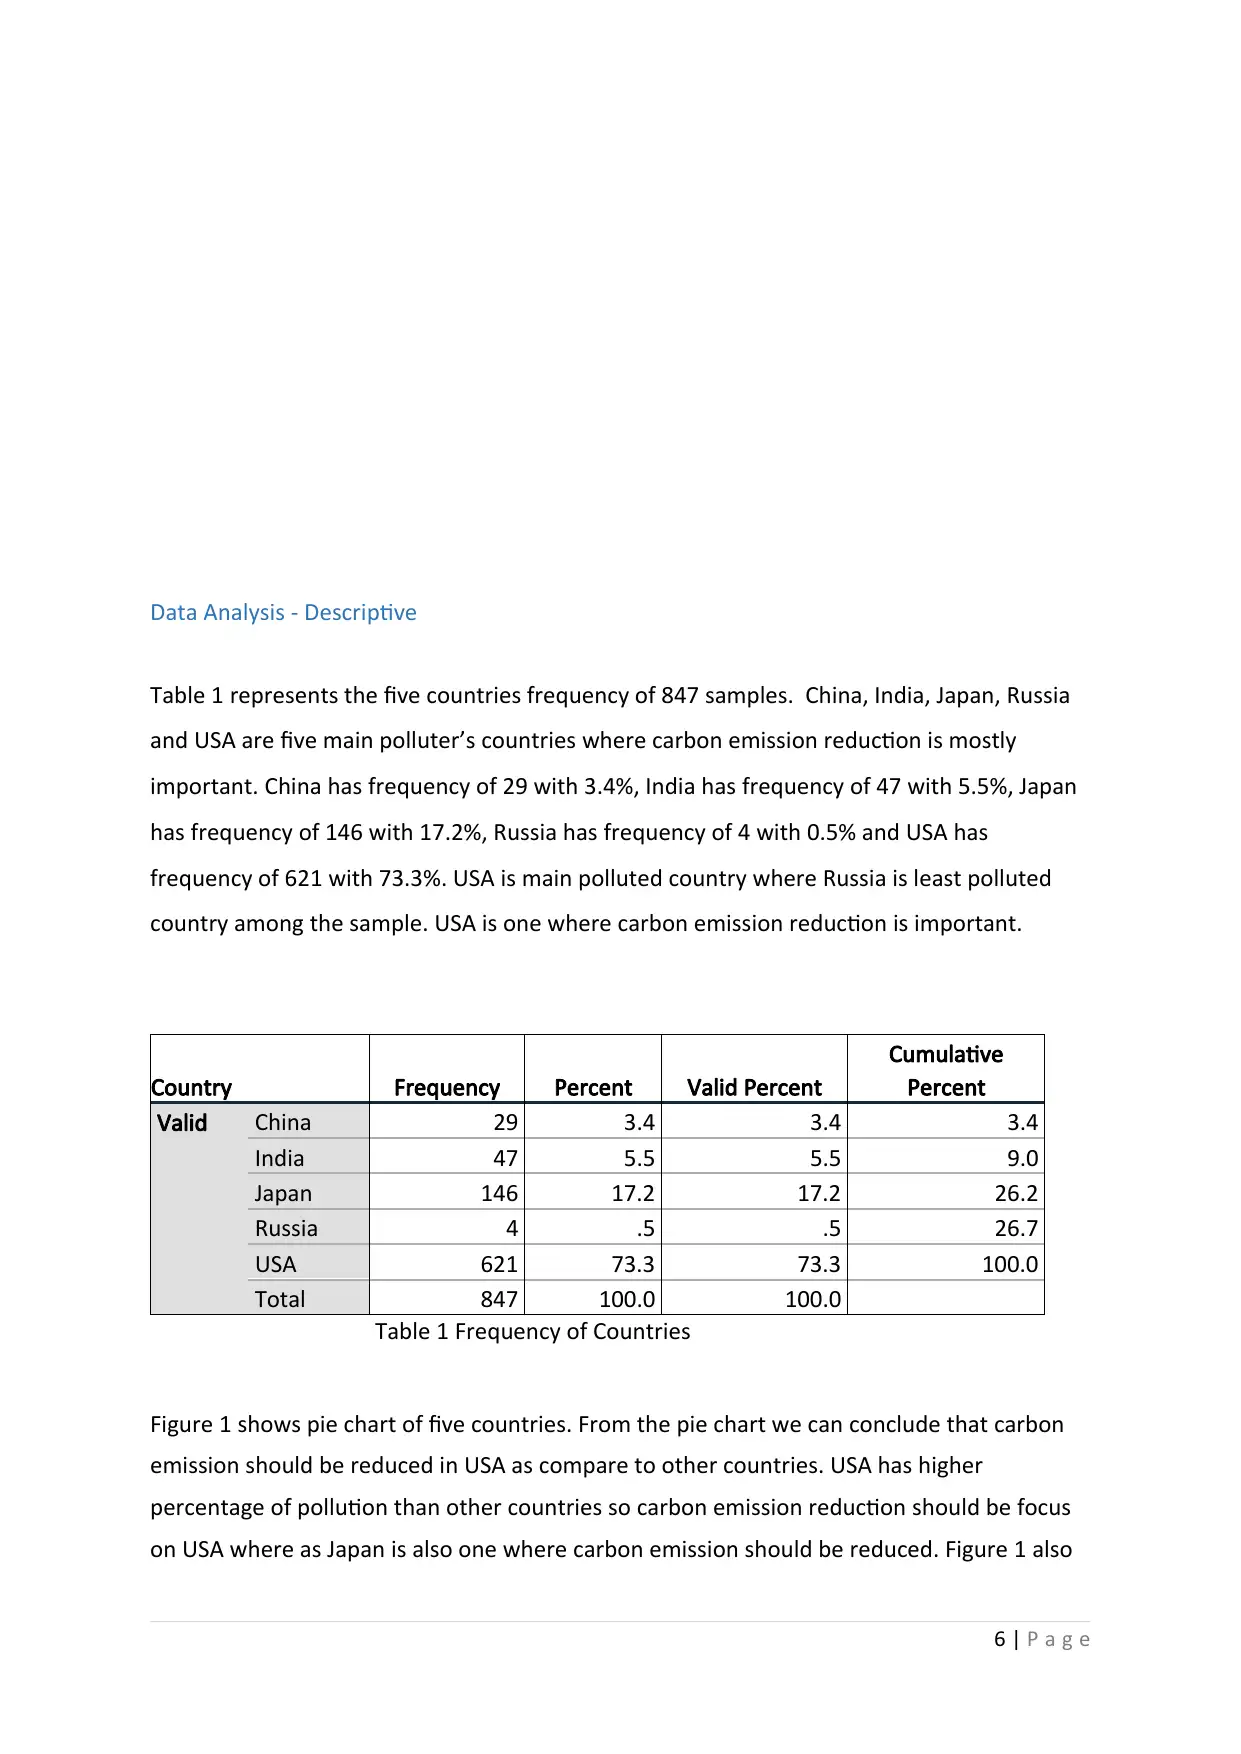
Data Analysis - Descriptive
Table 1 represents the five countries frequency of 847 samples. China, India, Japan, Russia
and USA are five main polluter’s countries where carbon emission reduction is mostly
important. China has frequency of 29 with 3.4%, India has frequency of 47 with 5.5%, Japan
has frequency of 146 with 17.2%, Russia has frequency of 4 with 0.5% and USA has
frequency of 621 with 73.3%. USA is main polluted country where Russia is least polluted
country among the sample. USA is one where carbon emission reduction is important.
Country Frequency Percent Valid Percent
Cumulative
Percent
Valid China 29 3.4 3.4 3.4
India 47 5.5 5.5 9.0
Japan 146 17.2 17.2 26.2
Russia 4 .5 .5 26.7
USA 621 73.3 73.3 100.0
Total 847 100.0 100.0
Table 1 Frequency of Countries
Figure 1 shows pie chart of five countries. From the pie chart we can conclude that carbon
emission should be reduced in USA as compare to other countries. USA has higher
percentage of pollution than other countries so carbon emission reduction should be focus
on USA where as Japan is also one where carbon emission should be reduced. Figure 1 also
6 | P a g e
⊘ This is a preview!⊘
Do you want full access?
Subscribe today to unlock all pages.
Trusted by 1+ million students worldwide
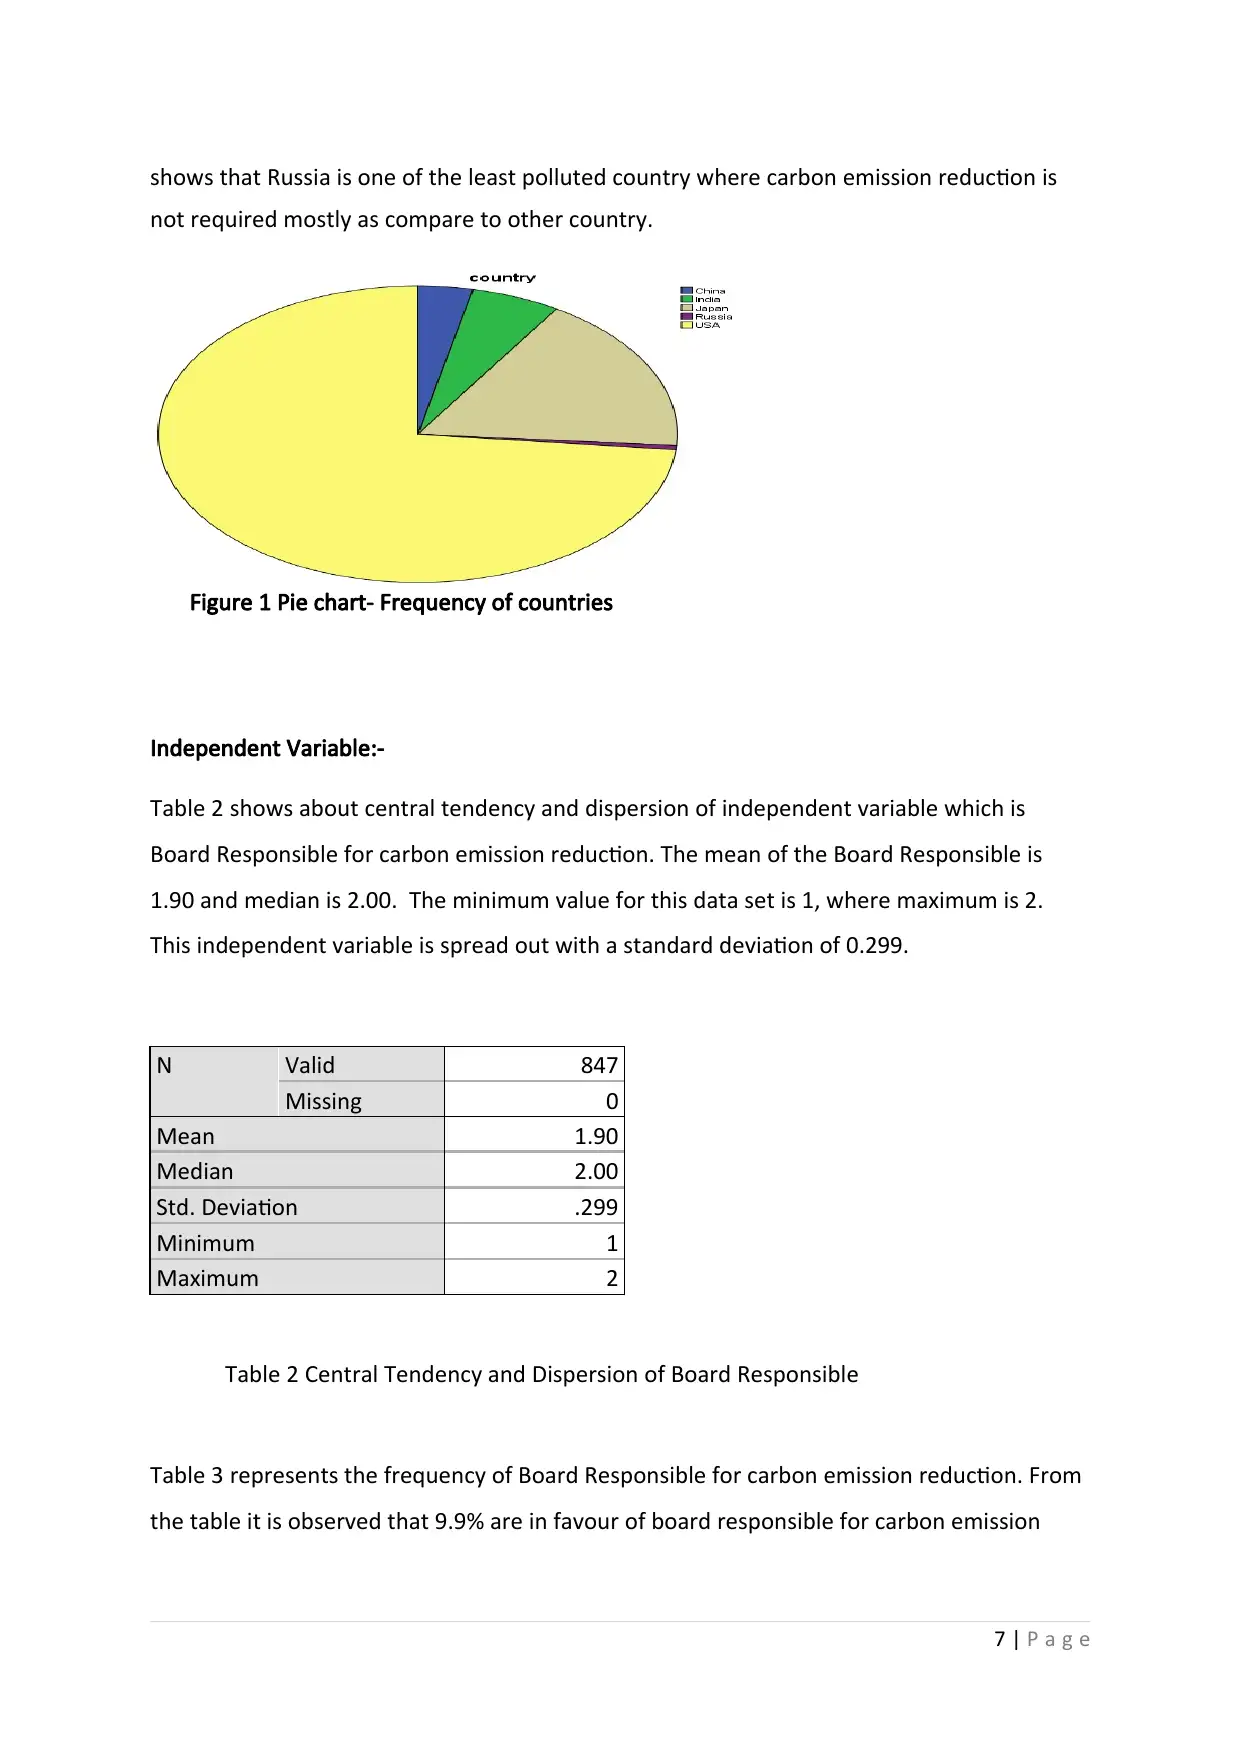
shows that Russia is one of the least polluted country where carbon emission reduction is
not required mostly as compare to other country.
Figure 1 Pie chart- Frequency of countries
Independent Variable:-
Table 2 shows about central tendency and dispersion of independent variable which is
Board Responsible for carbon emission reduction. The mean of the Board Responsible is
1.90 and median is 2.00. The minimum value for this data set is 1, where maximum is 2.
This independent variable is spread out with a standard deviation of 0.299.
Table 2 Central Tendency and Dispersion of Board Responsible
Table 3 represents the frequency of Board Responsible for carbon emission reduction. From
the table it is observed that 9.9% are in favour of board responsible for carbon emission
7 | P a g e
N Valid 847
Missing 0
Mean 1.90
Median 2.00
Std. Deviation .299
Minimum 1
Maximum 2
Paraphrase This Document
Need a fresh take? Get an instant paraphrase of this document with our AI Paraphraser
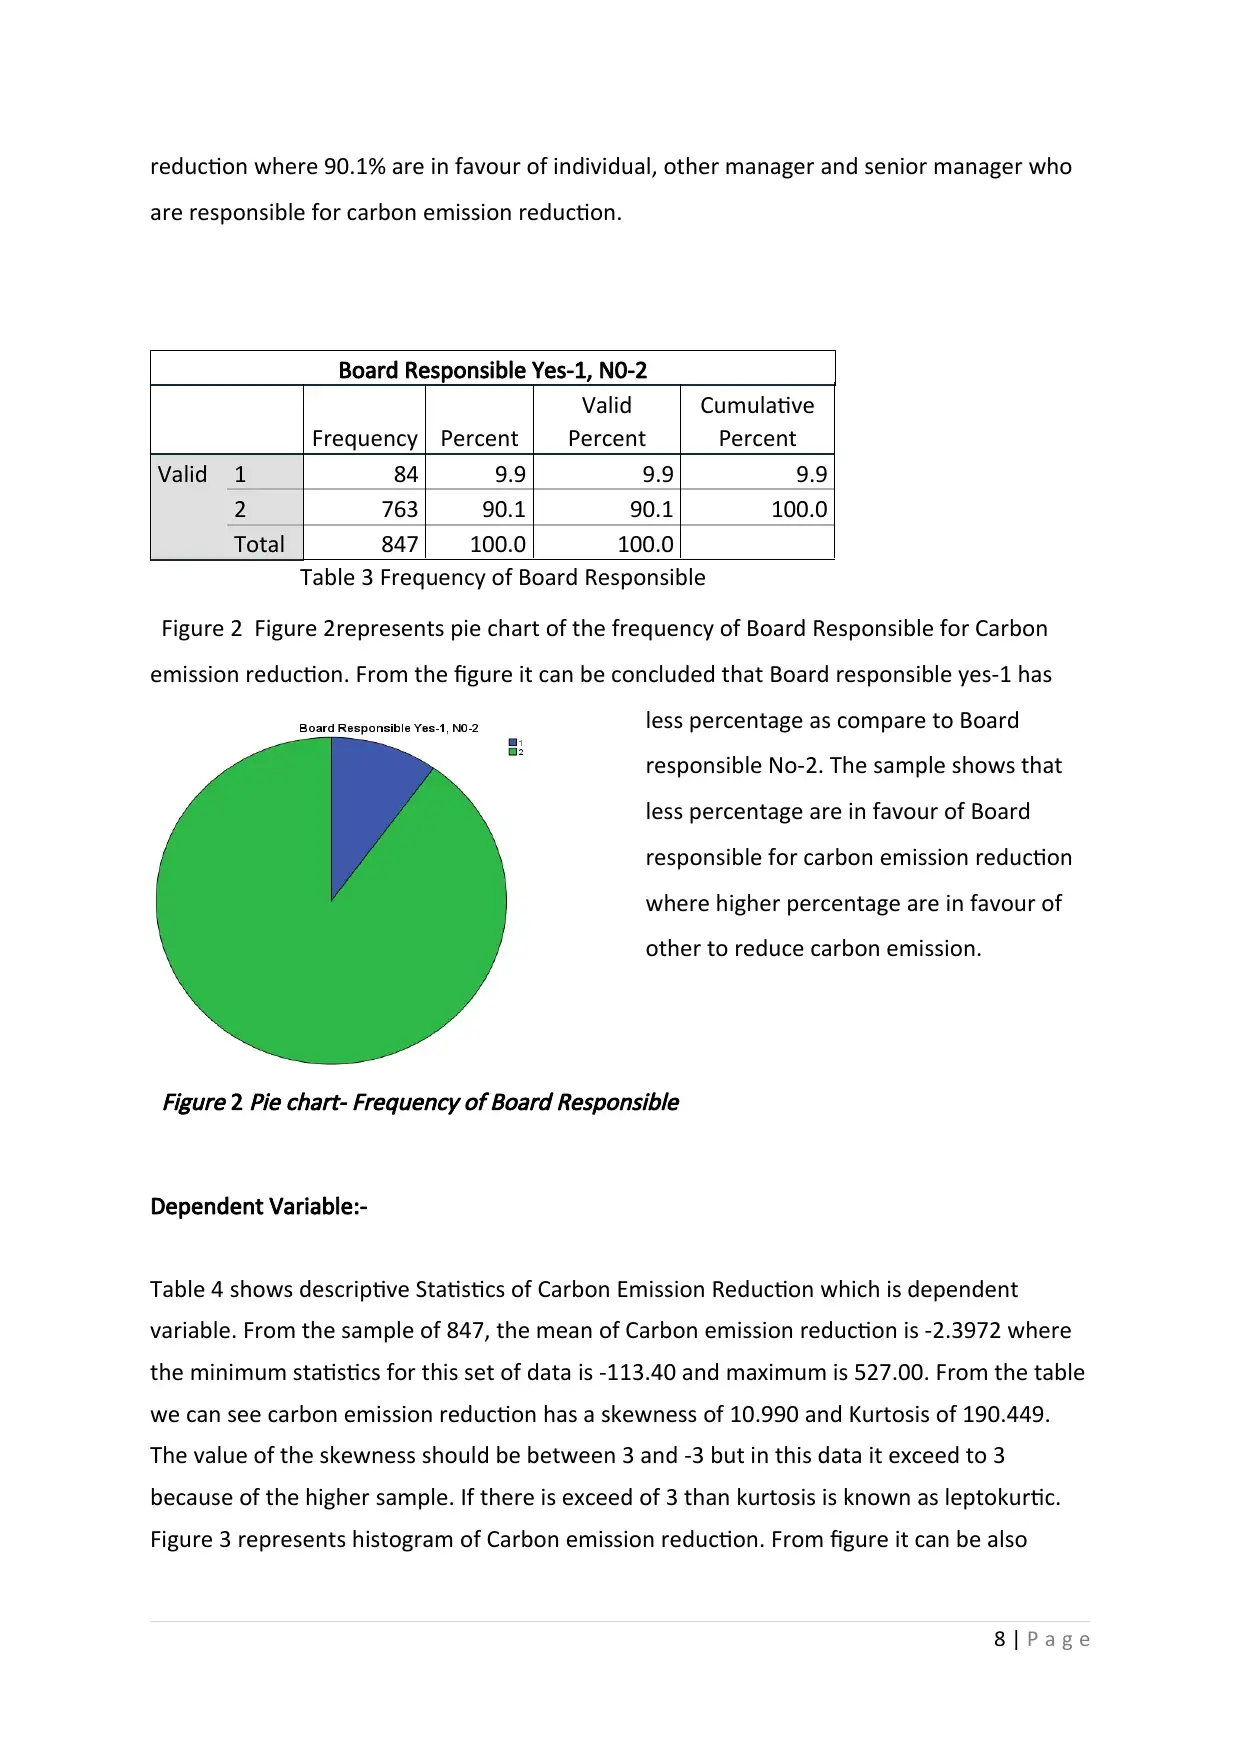
reduction where 90.1% are in favour of individual, other manager and senior manager who
are responsible for carbon emission reduction.
Board Responsible Yes-1, N0-2
Frequency Percent
Valid
Percent
Cumulative
Percent
Valid 1 84 9.9 9.9 9.9
2 763 90.1 90.1 100.0
Total 847 100.0 100.0
Table 3 Frequency of Board Responsible
Figure 2 Figure 2represents pie chart of the frequency of Board Responsible for Carbon
emission reduction. From the figure it can be concluded that Board responsible yes-1 has
less percentage as compare to Board
responsible No-2. The sample shows that
less percentage are in favour of Board
responsible for carbon emission reduction
where higher percentage are in favour of
other to reduce carbon emission.
Figure 2
Pie chart- Frequency of Board Responsible
Dependent Variable:-
Table 4 shows descriptive Statistics of Carbon Emission Reduction which is dependent
variable. From the sample of 847, the mean of Carbon emission reduction is -2.3972 where
the minimum statistics for this set of data is -113.40 and maximum is 527.00. From the table
we can see carbon emission reduction has a skewness of 10.990 and Kurtosis of 190.449.
The value of the skewness should be between 3 and -3 but in this data it exceed to 3
because of the higher sample. If there is exceed of 3 than kurtosis is known as leptokurtic.
Figure 3 represents histogram of Carbon emission reduction. From figure it can be also
8 | P a g e
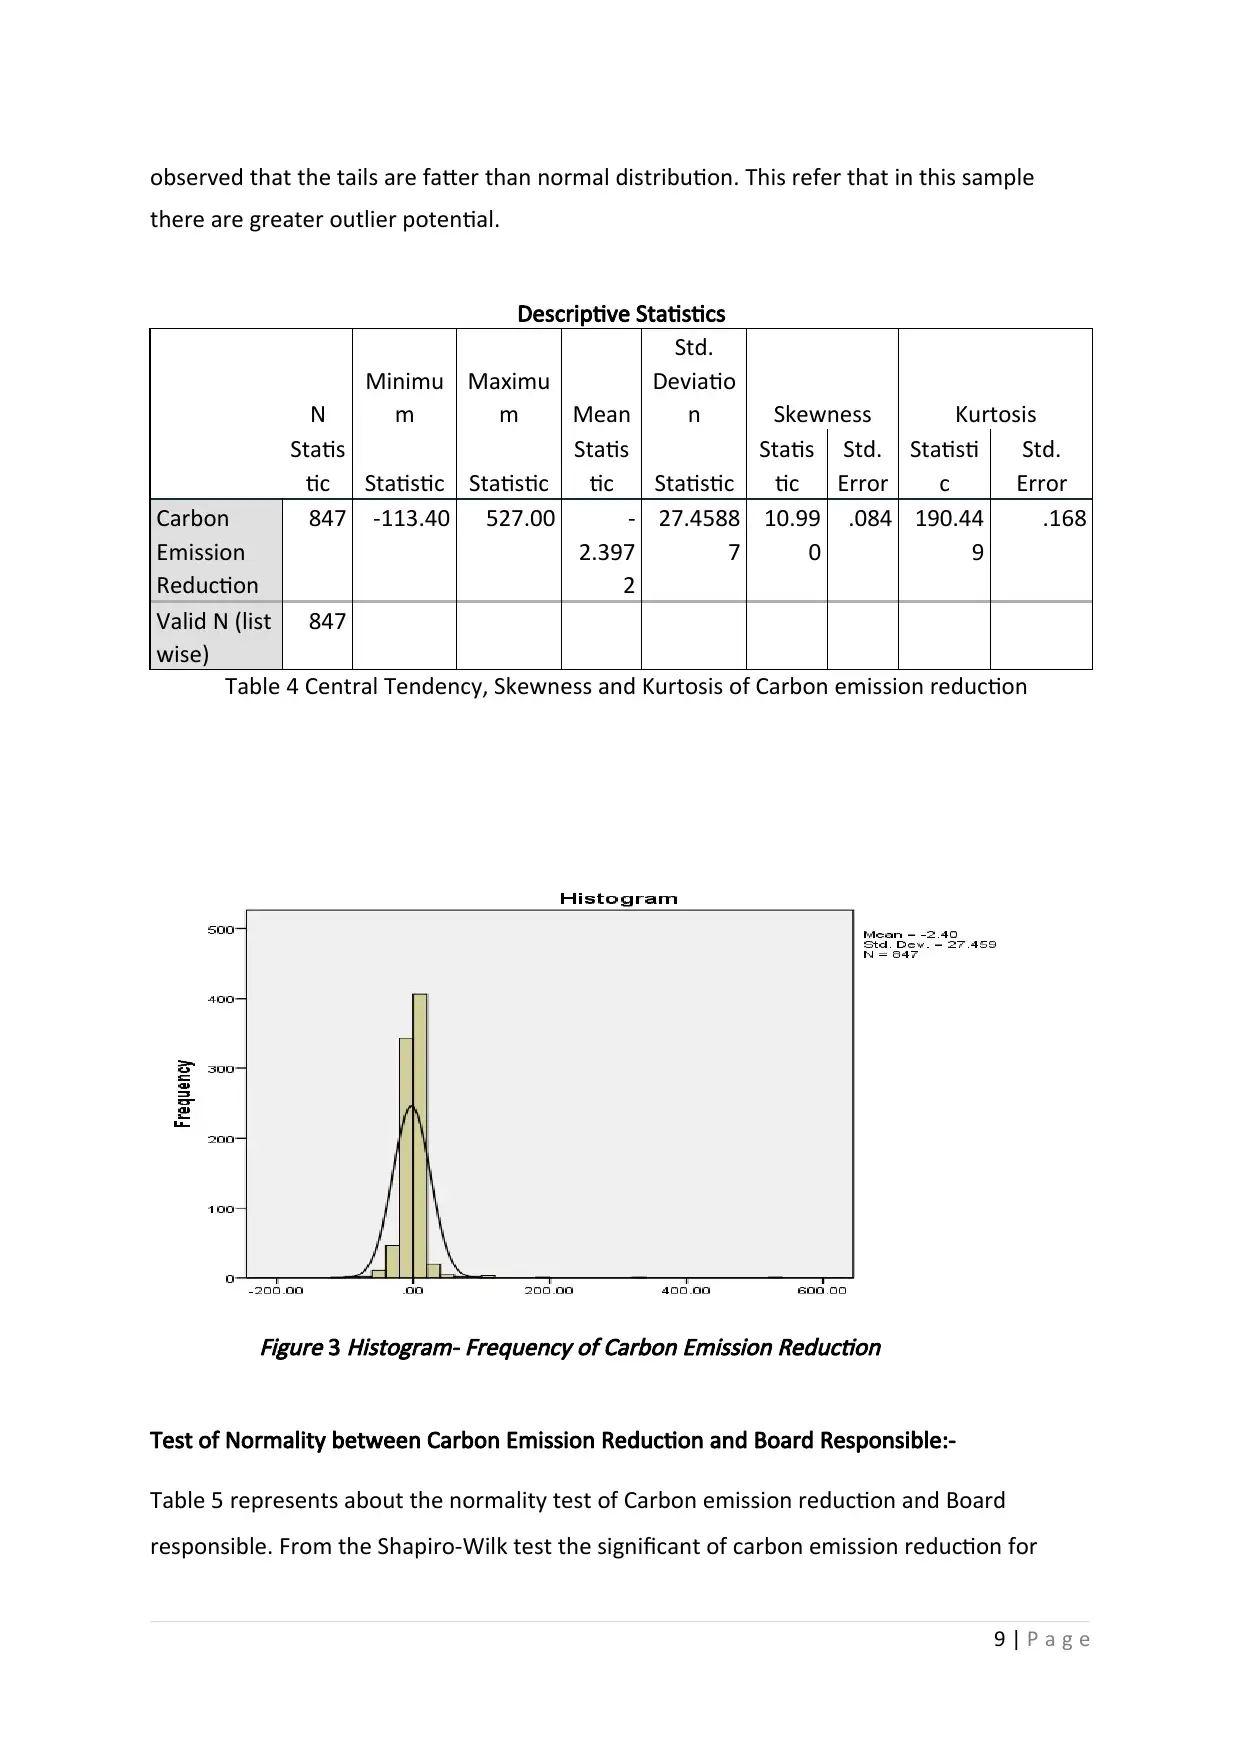
observed that the tails are fatter than normal distribution. This refer that in this sample
there are greater outlier potential.
Descriptive Statistics
N
Minimu
m
Maximu
m Mean
Std.
Deviatio
n Skewness Kurtosis
Statis
tic Statistic Statistic
Statis
tic Statistic
Statis
tic
Std.
Error
Statisti
c
Std.
Error
Carbon
Emission
Reduction
847 -113.40 527.00 -
2.397
2
27.4588
7
10.99
0
.084 190.44
9
.168
Valid N (list
wise)
847
Table 4 Central Tendency, Skewness and Kurtosis of Carbon emission reduction
Figure 3
Histogram- Frequency of Carbon Emission Reduction
Test of Normality between Carbon Emission Reduction and Board Responsible:-
Table 5 represents about the normality test of Carbon emission reduction and Board
responsible. From the Shapiro-Wilk test the significant of carbon emission reduction for
9 | P a g e
⊘ This is a preview!⊘
Do you want full access?
Subscribe today to unlock all pages.
Trusted by 1+ million students worldwide
board responsible 1-yes has 0.000 which is less than 0.05 so null hypothesis is rejected
whereas for carbon emission reduction for board responsible 2-No has also 0.000 which is
also less than 0.05 due to this null hypothesis is rejected.
Tests of Normality
Board
Responsible Yes-
1, N0-2
Kolmogorov-Smirnova Shapiro-Wilk
Statistic df Sig. Statistic df Sig.
Carbon Emission
Reduction
1 .501 84 .000 .232 84 .000
2 .283 763 .000 .390 763 .000
a. Lilliefors Significance Correction
Table 5 Test of Normality of Carbon emission reduction for Board Responsible
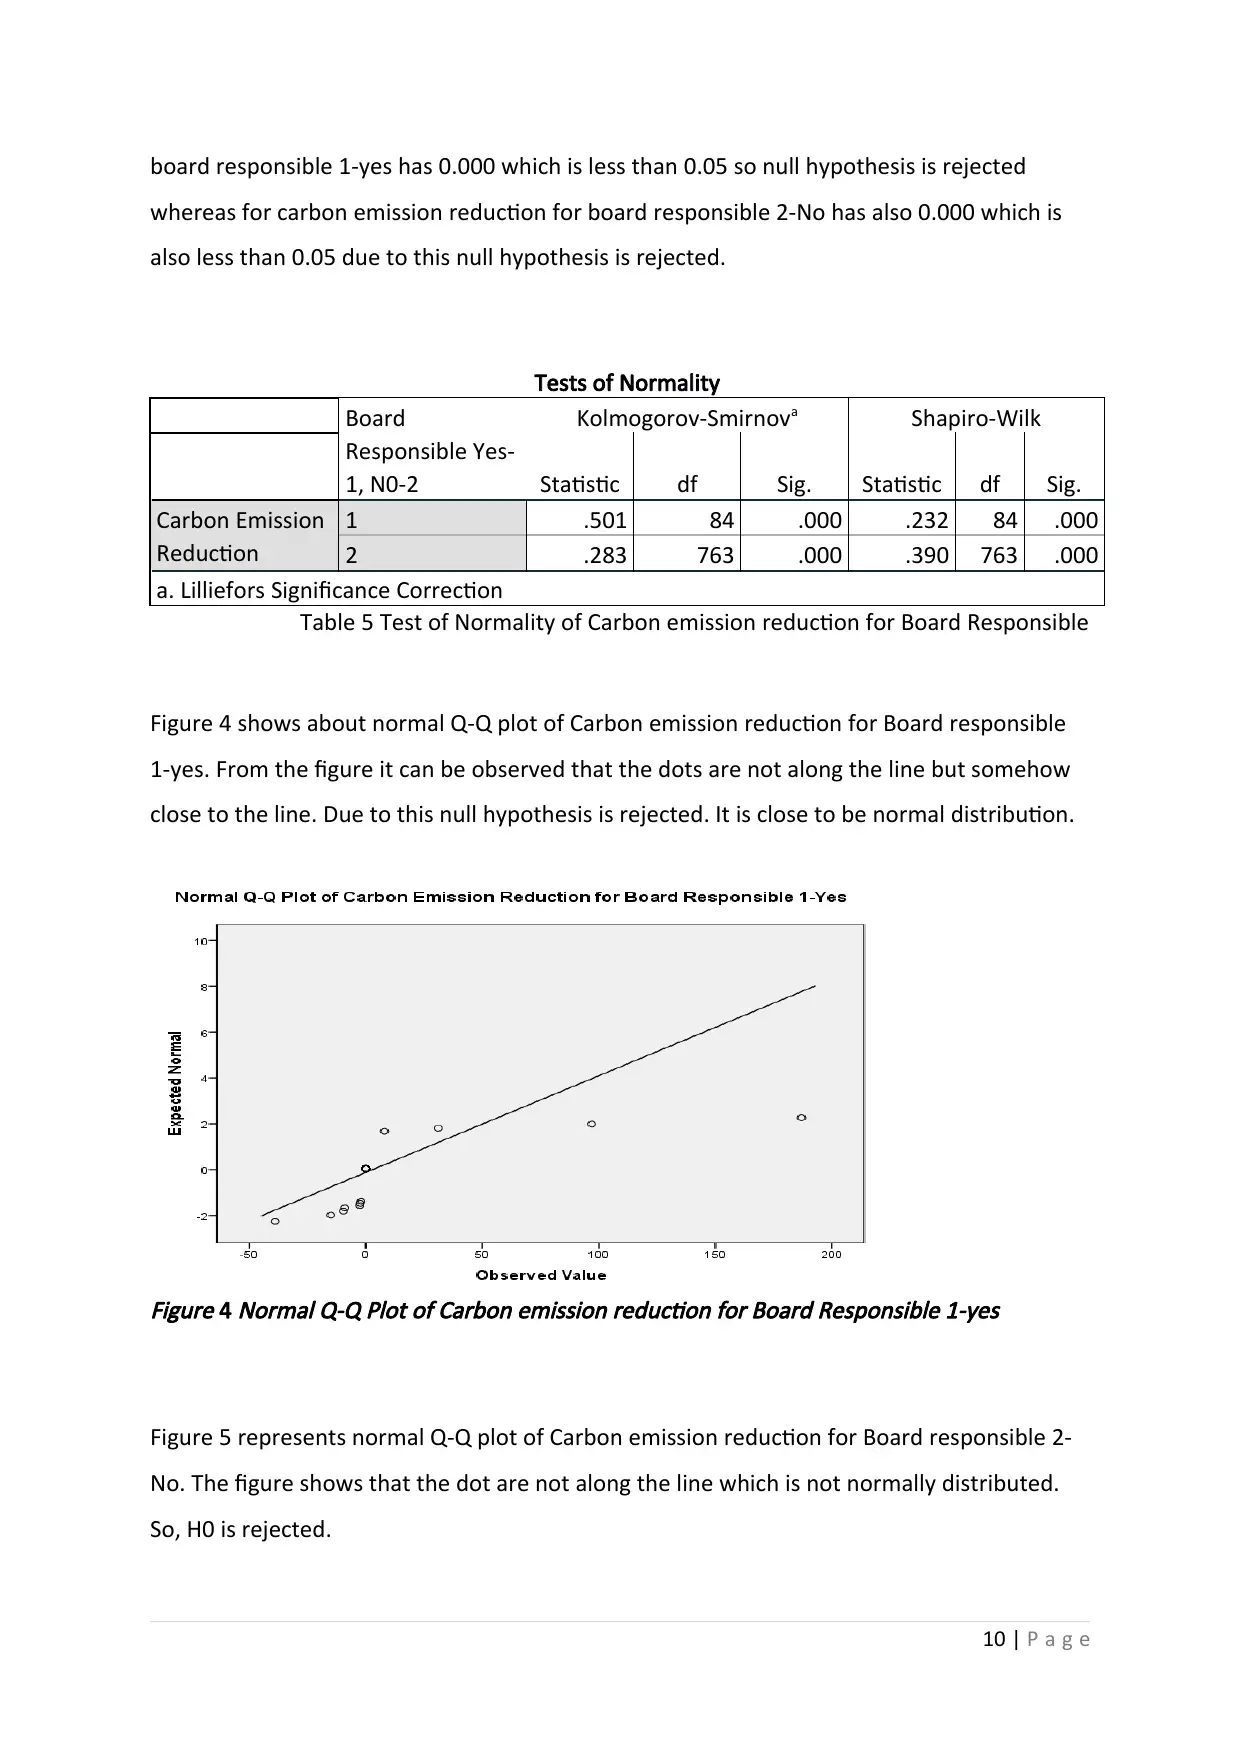
Figure 4 shows about normal Q-Q plot of Carbon emission reduction for Board responsible
1-yes. From the figure it can be observed that the dots are not along the line but somehow
close to the line. Due to this null hypothesis is rejected. It is close to be normal distribution.
Figure 4
Normal Q-Q Plot of Carbon emission reduction for Board Responsible 1-yes
Figure 5 represents normal Q-Q plot of Carbon emission reduction for Board responsible 2-
No. The figure shows that the dot are not along the line which is not normally distributed.
So, H0 is rejected.
10 | P a g e
whereas for carbon emission reduction for board responsible 2-No has also 0.000 which is
also less than 0.05 due to this null hypothesis is rejected.
Tests of Normality
Board
Responsible Yes-
1, N0-2
Kolmogorov-Smirnova Shapiro-Wilk
Statistic df Sig. Statistic df Sig.
Carbon Emission
Reduction
1 .501 84 .000 .232 84 .000
2 .283 763 .000 .390 763 .000
a. Lilliefors Significance Correction
Table 5 Test of Normality of Carbon emission reduction for Board Responsible
Figure 4 shows about normal Q-Q plot of Carbon emission reduction for Board responsible
1-yes. From the figure it can be observed that the dots are not along the line but somehow
close to the line. Due to this null hypothesis is rejected. It is close to be normal distribution.
Figure 4
Normal Q-Q Plot of Carbon emission reduction for Board Responsible 1-yes
Figure 5 represents normal Q-Q plot of Carbon emission reduction for Board responsible 2-
No. The figure shows that the dot are not along the line which is not normally distributed.
So, H0 is rejected.
10 | P a g e
Paraphrase This Document
Need a fresh take? Get an instant paraphrase of this document with our AI Paraphraser
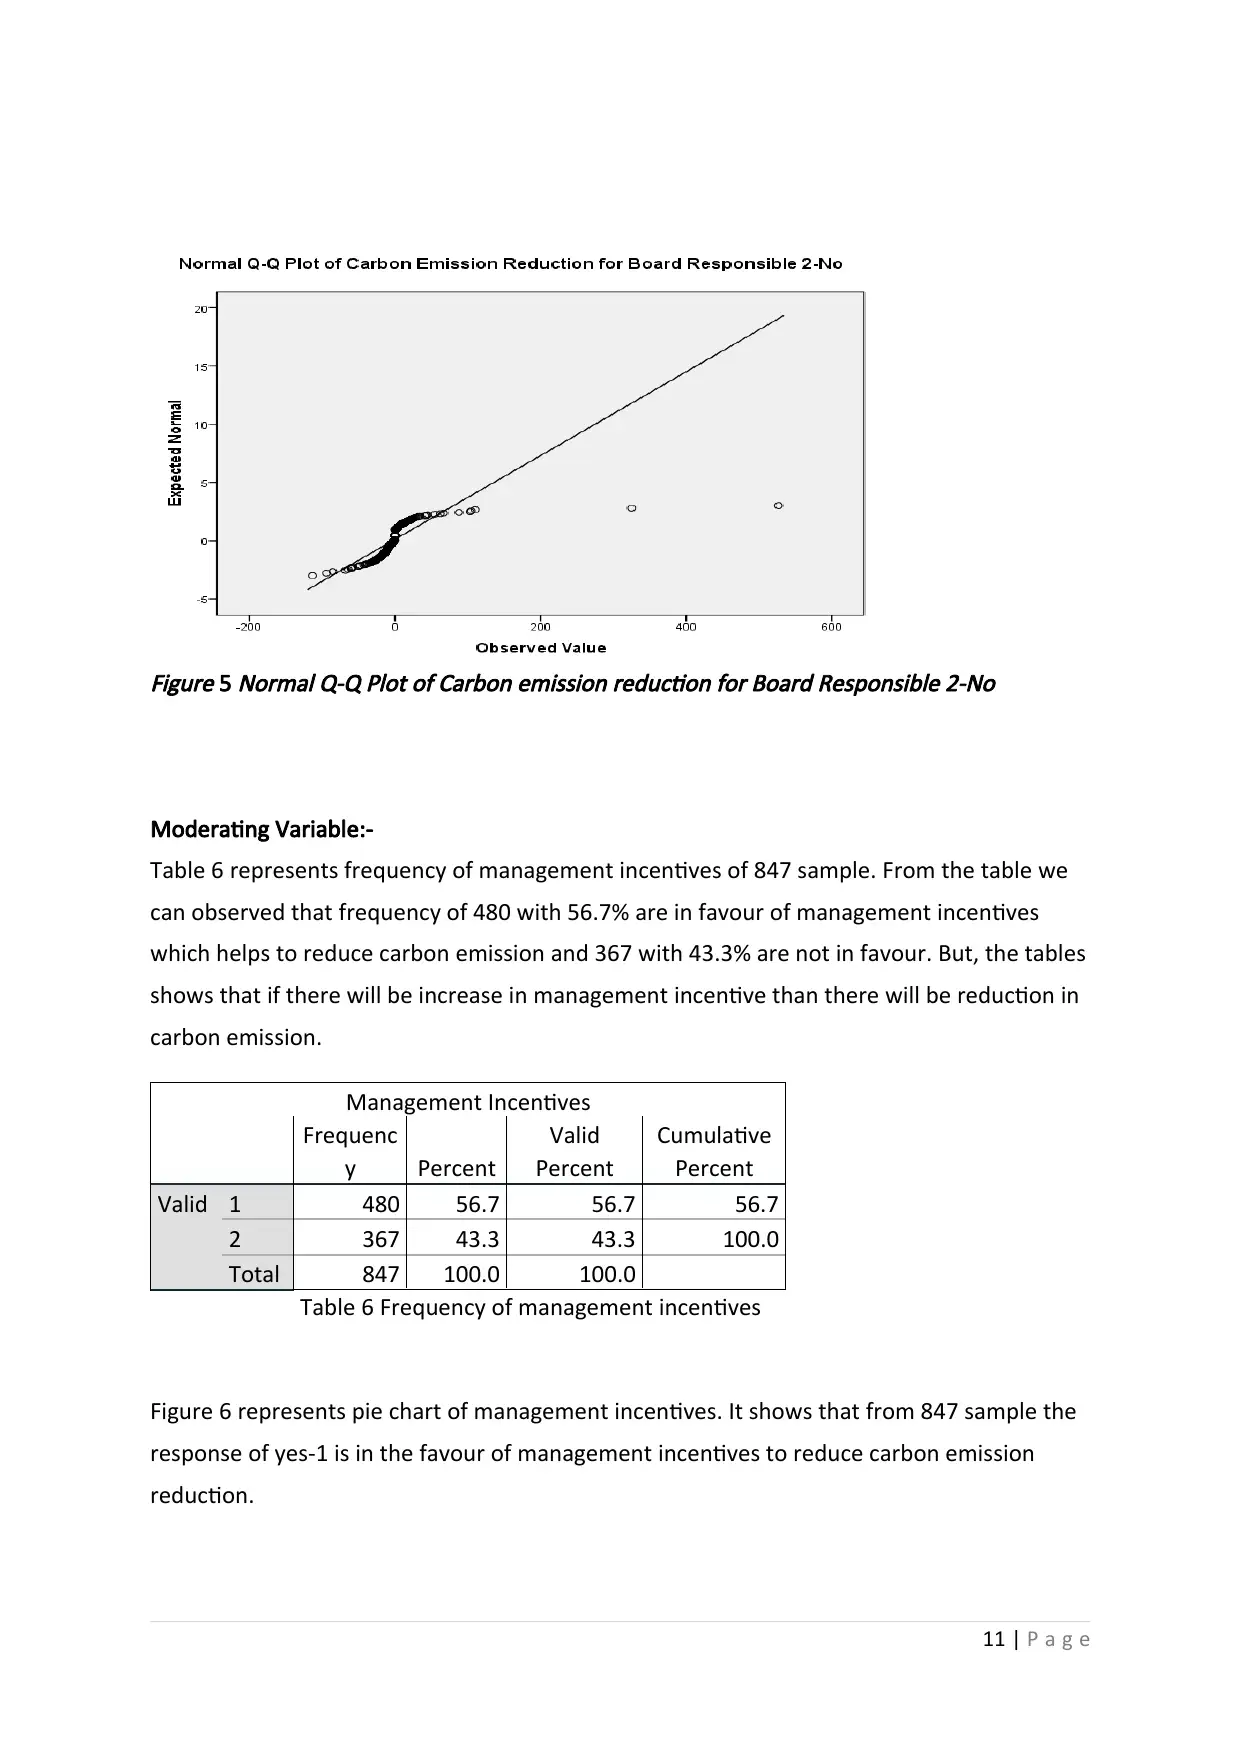
Figure 5
Normal Q-Q Plot of Carbon emission reduction for Board Responsible 2-No
Moderating Variable:-
Table 6 represents frequency of management incentives of 847 sample. From the table we
can observed that frequency of 480 with 56.7% are in favour of management incentives
which helps to reduce carbon emission and 367 with 43.3% are not in favour. But, the tables
shows that if there will be increase in management incentive than there will be reduction in
carbon emission.
Management Incentives
Frequenc
y Percent
Valid
Percent
Cumulative
Percent
Valid 1 480 56.7 56.7 56.7
2 367 43.3 43.3 100.0
Total 847 100.0 100.0
Table 6 Frequency of management incentives
Figure 6 represents pie chart of management incentives. It shows that from 847 sample the
response of yes-1 is in the favour of management incentives to reduce carbon emission
reduction.
11 | P a g e
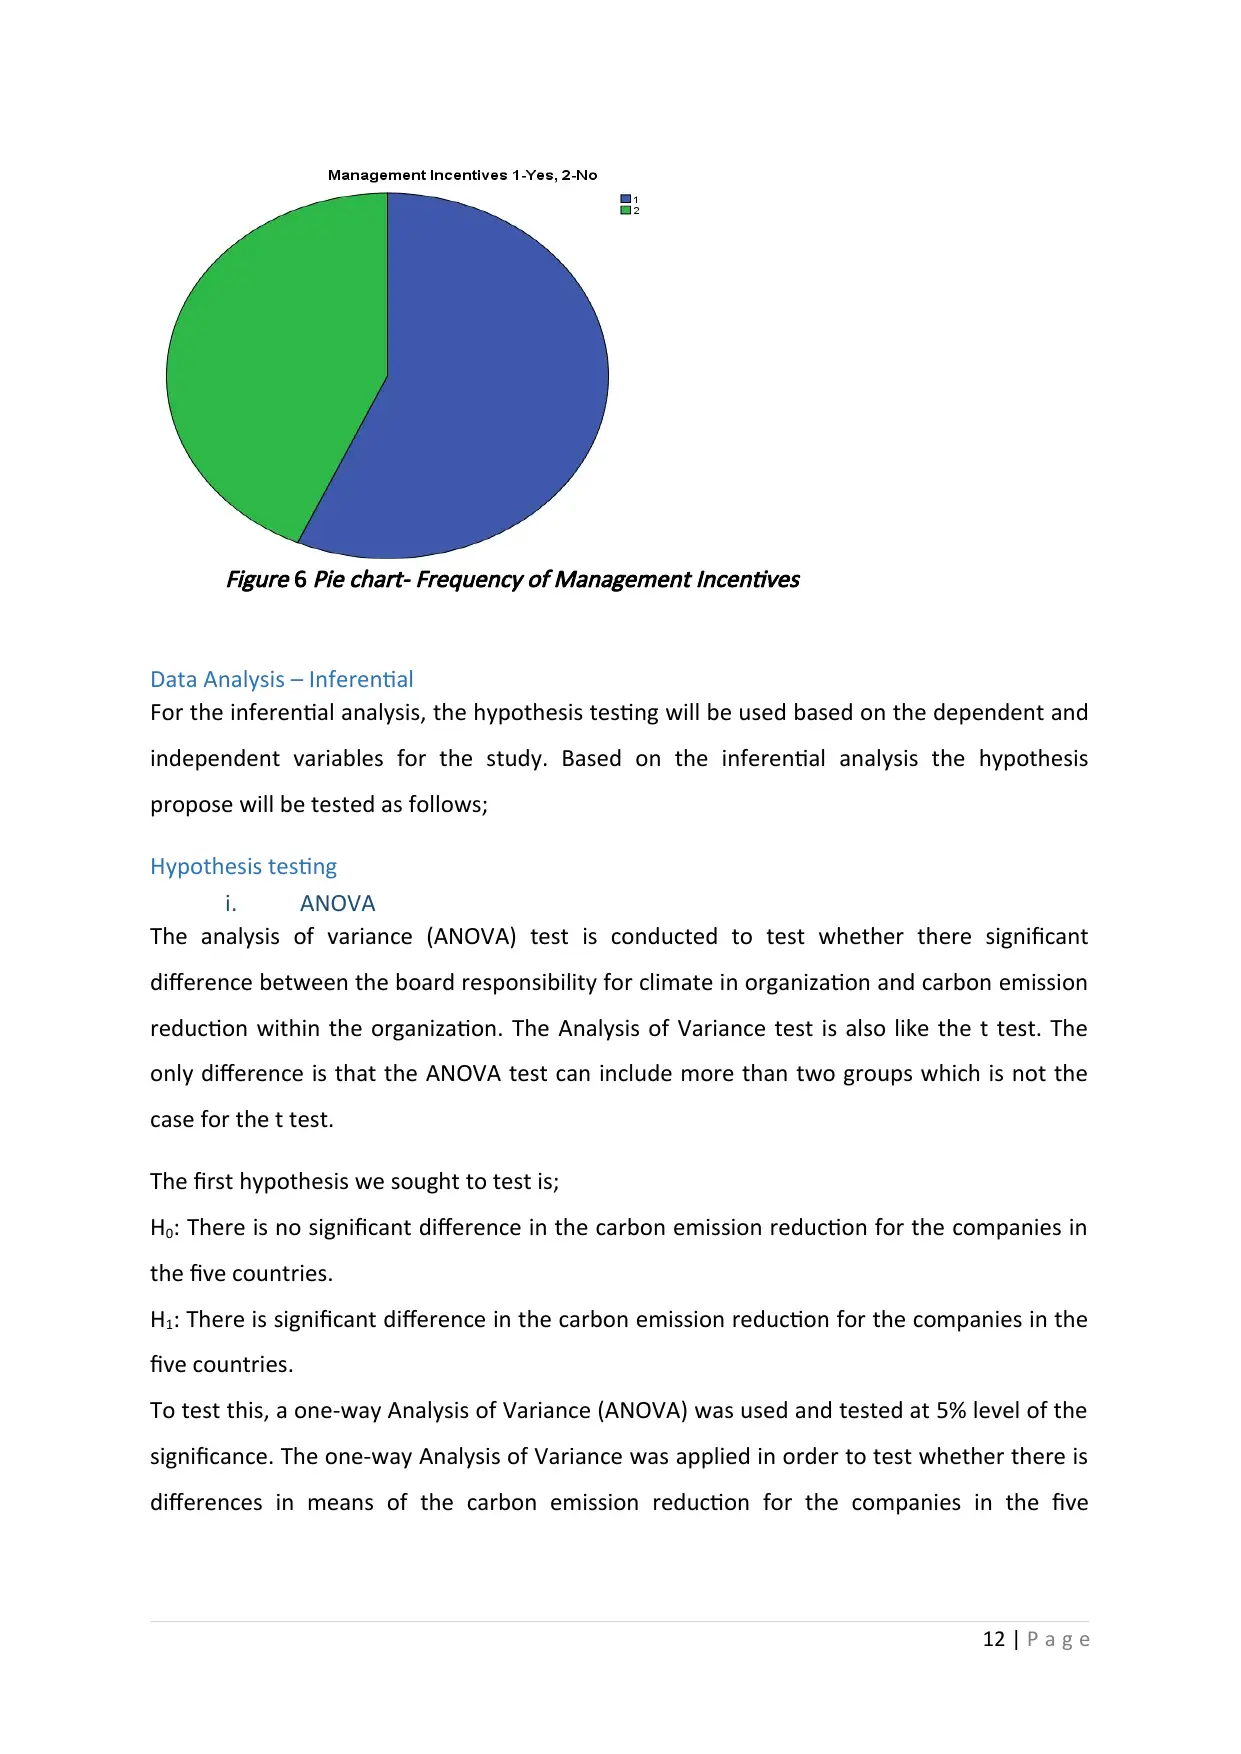
Figure 6
Pie chart- Frequency of Management Incentives
Data Analysis – Inferential
For the inferential analysis, the hypothesis testing will be used based on the dependent and
independent variables for the study. Based on the inferential analysis the hypothesis
propose will be tested as follows;
Hypothesis testing
i. ANOVA
The analysis of variance (ANOVA) test is conducted to test whether there significant
difference between the board responsibility for climate in organization and carbon emission
reduction within the organization. The Analysis of Variance test is also like the t test. The
only difference is that the ANOVA test can include more than two groups which is not the
case for the t test.
The first hypothesis we sought to test is;
H0: There is no significant difference in the carbon emission reduction for the companies in
the five countries.
H1: There is significant difference in the carbon emission reduction for the companies in the
five countries.
To test this, a one-way Analysis of Variance (ANOVA) was used and tested at 5% level of the
significance. The one-way Analysis of Variance was applied in order to test whether there is
differences in means of the carbon emission reduction for the companies in the five
12 | P a g e
⊘ This is a preview!⊘
Do you want full access?
Subscribe today to unlock all pages.
Trusted by 1+ million students worldwide
1 out of 21
Related Documents


Your All-in-One AI-Powered Toolkit for Academic Success.
+13062052269
info@desklib.com
Available 24*7 on WhatsApp / Email
![[object Object]](/_next/static/media/star-bottom.7253800d.svg)
Unlock your academic potential
Copyright © 2020–2026 A2Z Services. All Rights Reserved. Developed and managed by ZUCOL.