MGT723 Research Report: Statistical Data Analysis and Hypothesis Test

Verified

Added on  2023/06/04

|9
|564
|401
Report
AI Summary
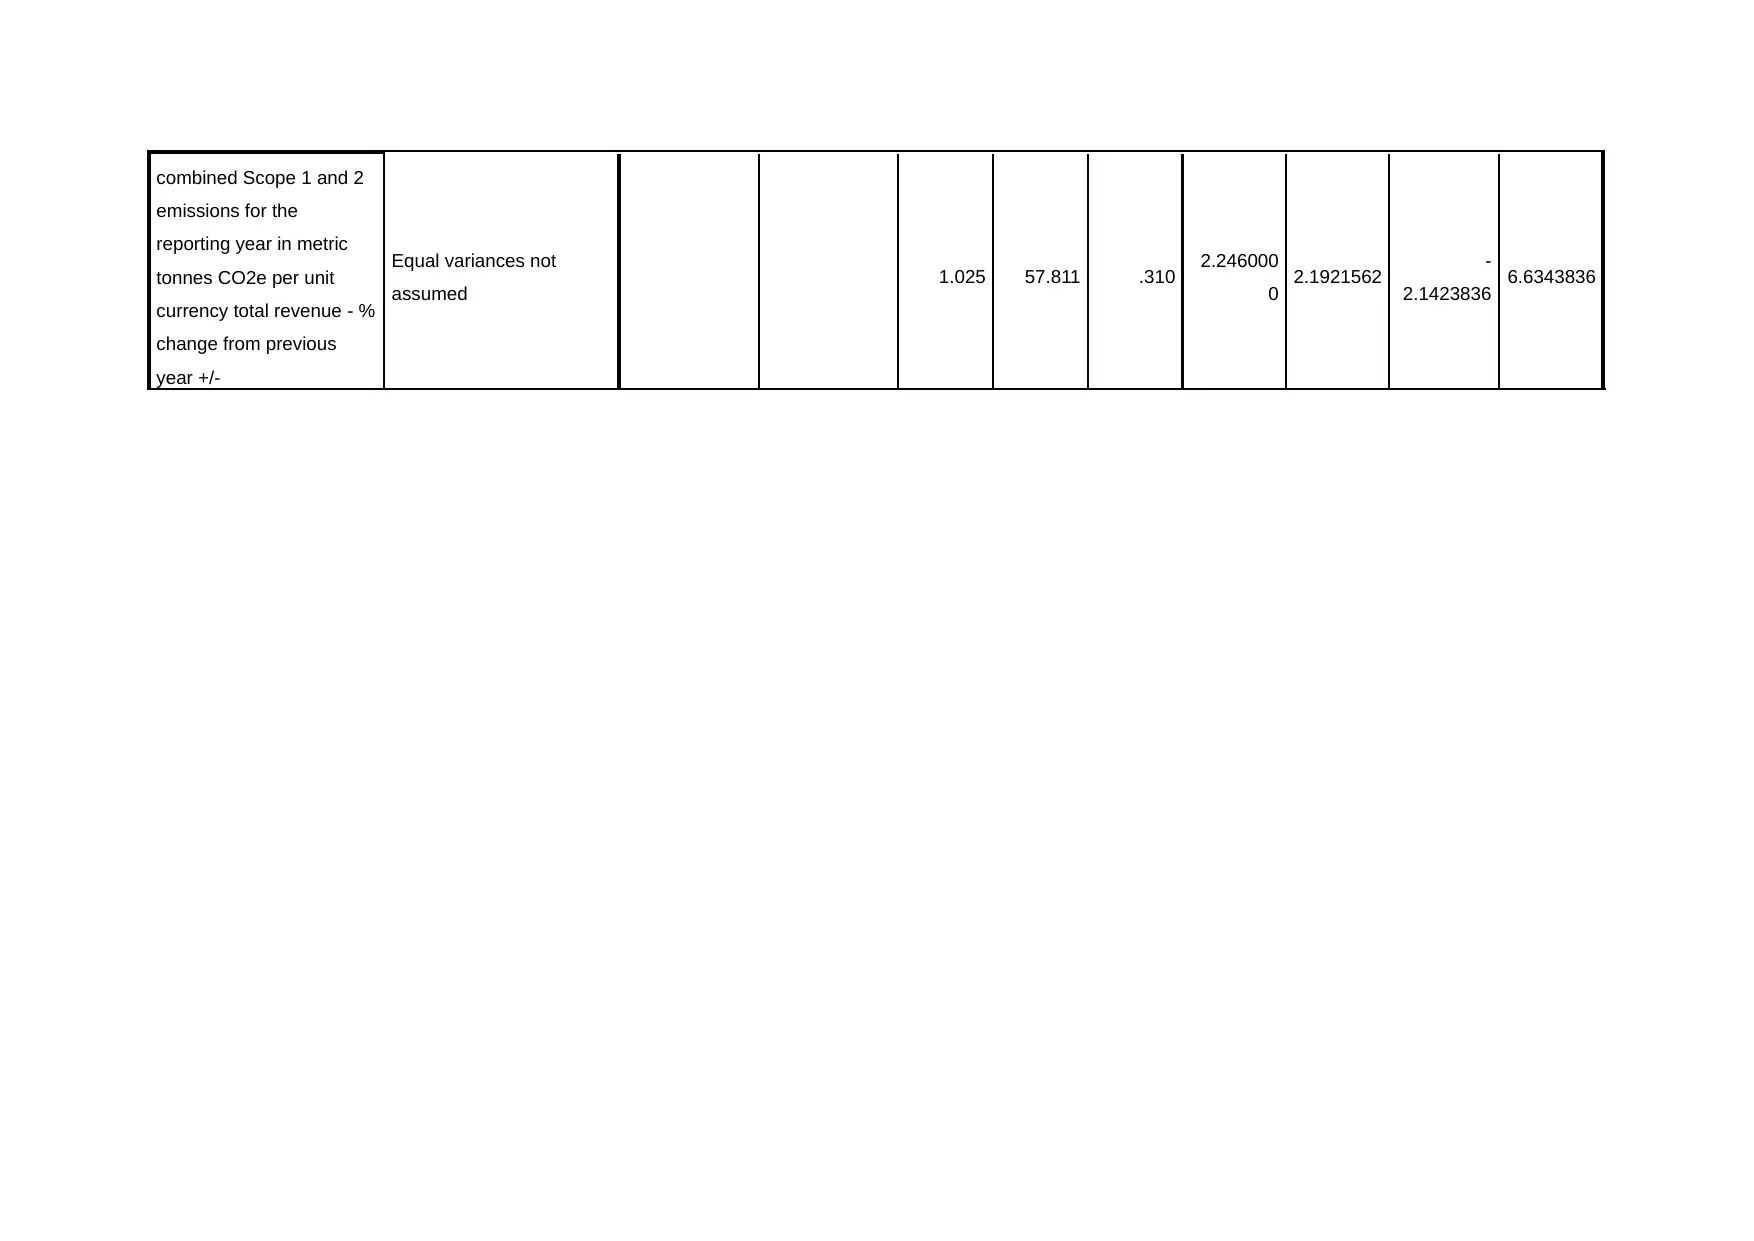
This MGT723 research report focuses on the statistical analysis of data and hypothesis testing. It details the methodologies used to conduct appropriate statistical analyses, draw conclusions regarding the stated hypotheses, and discuss the implications for both practical application and theoretical understanding. The report also identifies the limitations of the study and suggests opportunities for further research based on the findings and limitations encountered. The document includes a literature summary, a conceptual model, the stated hypotheses, descriptive statistics, and a thorough inferential data analysis. This resource is ideal for students seeking to understand the research process, particularly in the context of data analysis and hypothesis evaluation.
Document Page
FREQUENCIES VARIABLES=@2013CC12.2C5PleasedescribeyourgrossglobalcombinedScope1and2emis
CC1.2Doyouprovideincentivesforthemanagementofclimatechangeissues
/PERCENTILES=25.0 50.0 75.0
/STATISTICS=STDDEV MINIMUM MAXIMUM MEAN MEDIAN SKEWNESS SESKEW KURTOSIS SEKURT
/PIECHART PERCENT
/ORDER=ANALYSIS.
Frequencies
Notes
Output Created 25-SEP-2018 14:24:30
Comments
Input
Active Dataset DataSet3
Filter <none>
Weight <none>
Split File <none>
N of Rows in Working Data
File 60
Missing Value Handling
Definition of Missing User-defined missing values
are treated as missing.
Cases Used Statistics are based on all
cases with valid data.
tabler-icon-diamond-filled.svg

Paraphrase This Document

Need a fresh take? Get an instant paraphrase of this document with our AI Paraphraser
Document Page
Syntax
FREQUENCIES
VARIABLES=@2013CC12.2
C5Pleasedescribeyourgross
globalcombinedScope1and2
emis
CC1.2Doyouprovideincentive
sforthemanagementofclimate
changeissues
/PERCENTILES=25.0 50.0
75.0
/STATISTICS=STDDEV
MINIMUM MAXIMUM MEAN
MEDIAN SKEWNESS
SESKEW KURTOSIS
SEKURT
/PIECHART PERCENT
/ORDER=ANALYSIS.
Resources Processor Time 00:00:00.31
Elapsed Time 00:00:00.29
[DataSet3]
Statistics
Document Page
2013 CC12.2
C5 - Please
describe your
gross global
combined
Scope 1 and 2
emissions for
the reporting
year in metric
tonnes CO2e
per unit
currency total
revenue - %
change from
previous year
+/-
CC1.2 - Do you
provide
incentives for
the
management of
climate change
issues, including
the attainment of
targets?
N Valid 60 60
Missing 0 0
Mean -9.957000 1.50
Median -8.010000 1.50
Std. Deviation 8.4937615 .504
Skewness -1.246 .000
Std. Error of Skewness .309 .309
Kurtosis 1.425 -2.070
Std. Error of Kurtosis .608 .608
Minimum -38.7500 1
Maximum -.2000 2
Document Page
Percentiles
25 -12.952500 1.00
50 -8.010000 1.50
75 -3.932500 2.00
Frequency Table
CC1.2 - Do you provide incentives for the management of climate change
issues, including the attainment of targets?
Frequency Percent Valid Percent Cumulative
Percent
Valid
yes 30 50.0 50.0 50.0
no 30 50.0 50.0 100.0
Total 60 100.0 100.0
Pie Chart
tabler-icon-diamond-filled.svg

Paraphrase This Document

Need a fresh take? Get an instant paraphrase of this document with our AI Paraphraser
Document Page
T-TEST GROUPS=CC1.2Doyouprovideincentivesforthemanagementofclimatechangeissues(1 2)
/MISSING=ANALYSIS
/VARIABLES=@2013CC12.2C5PleasedescribeyourgrossglobalcombinedScope1and2emis
/CRITERIA=CI(.95).
Document Page
T-Test
Notes
Output Created 25-SEP-2018 14:27:55
Comments
Input
Active Dataset DataSet4
Filter <none>
Weight <none>
Split File <none>
N of Rows in Working Data
File 60
Missing Value Handling
Definition of Missing User defined missing values
are treated as missing.
Cases Used
Statistics for each analysis
are based on the cases with
no missing or out-of-range
data for any variable in the
analysis.
Document Page
Syntax
T-TEST
GROUPS=CC1.2Doyouprovi
deincentivesforthemanagem
entofclimatechangeissues(1
2)
/MISSING=ANALYSIS
/VARIABLES=@2013CC12.2
C5Pleasedescribeyourgross
globalcombinedScope1and2
emis
/CRITERIA=CI(.95).
Resources Processor Time 00:00:00.02
Elapsed Time 00:00:00.01
[DataSet4]
Group Statistics
CC1.2 - Do you provide
incentives for the
management of climate
change issues, including the
attainment of targets?
N Mean Std. Deviation Std. Error Mean
2013 CC12.2 C5 - Please yes 30 -8.834000 8.2435666 1.5050625
tabler-icon-diamond-filled.svg

Paraphrase This Document

Need a fresh take? Get an instant paraphrase of this document with our AI Paraphraser
Document Page
describe your gross global
combined Scope 1 and 2
emissions for the reporting
year in metric tonnes CO2e
per unit currency total
revenue - % change from
previous year +/-
no 30 -11.080000 8.7298379 1.5938430
Independent Samples Test
Levene's Test for Equality of
Variances
t-test for Equality of Means
F Sig. t df Sig. (2-
tailed)
Mean
Difference
Std. Error
Difference
95%
Confidence
Interval of
the
Difference
Lower Upper
2013 CC12.2 C5 - Please
describe your gross global
Equal variances assumed .006 .938 1.025 58 .310 2.246000
0
2.1921562 -
2.1420773
6.6340773
Document Page
combined Scope 1 and 2
emissions for the
reporting year in metric
tonnes CO2e per unit
currency total revenue - %
change from previous
year +/-
Equal variances not
assumed 1.025 57.811 .310 2.246000
0 2.1921562 -
2.1423836 6.6343836
chevron_up_icon
1 out of 9
circle_padding
hide_on_mobile
zoom_out_icon
[object Object]