MGT723 Research Project: Government Impact on CO2 Emission Reduction
VerifiedAdded on 2023/06/07
|27
|3739
|244
Report
AI Summary
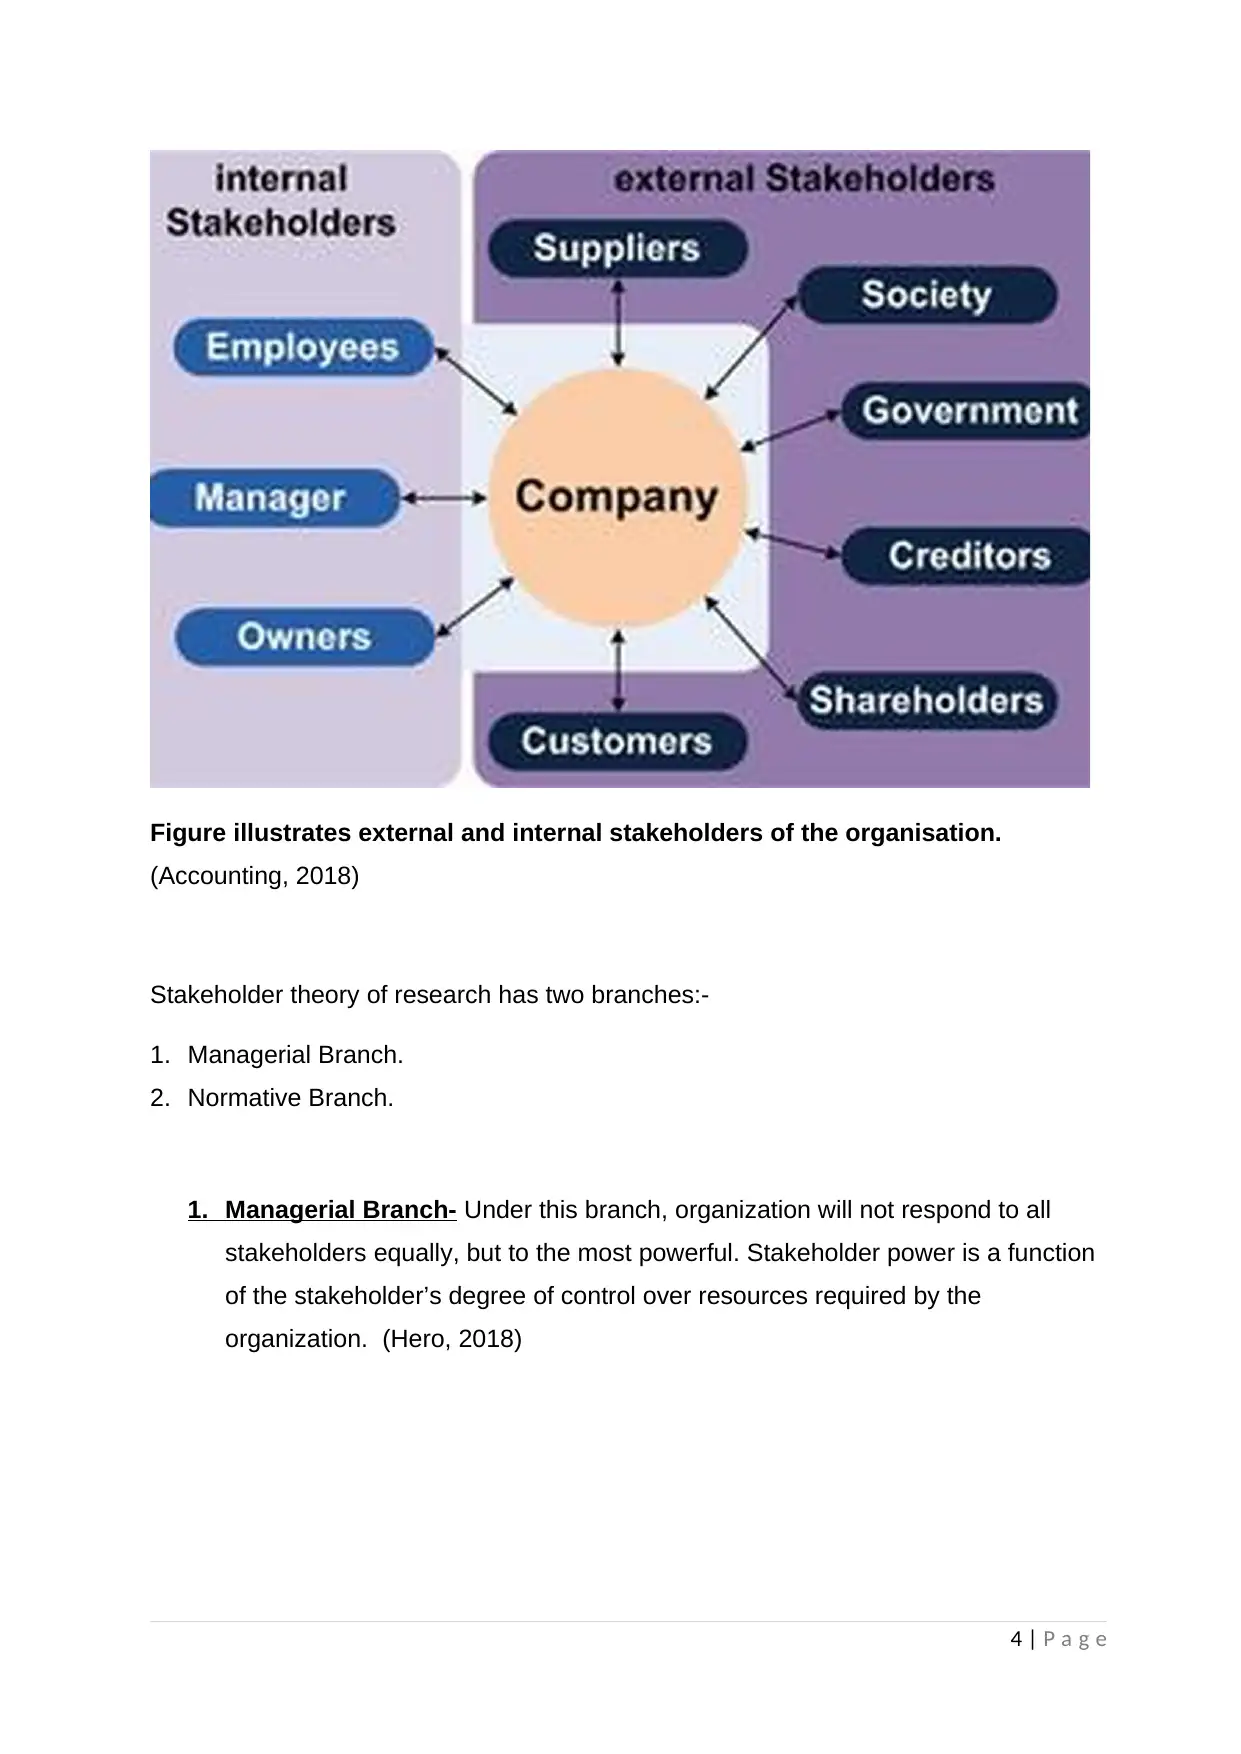
This research report investigates the impact of government policies on the reduction of carbon emissions by organizations across different countries. It begins by highlighting the increasing global concern over climate change and the role of governments in implementing policies to mitigate carbon emissions. The literature review emphasizes the environmental costs associated with industrial activities and the importance of corporate social responsibility, particularly through the lens of stakeholder theory. The conceptual model explores the influence of stakeholders, with a focus on the government's role and its impact on organizational environmental performance. The report formulates hypotheses regarding the relationship between government influence and carbon emission reduction. Data from firms in Canada, the United Kingdom, Brazil, and the United States are analyzed, considering variables such as government role and emission reduction rates. The report addresses missing data using multiple imputation techniques and presents descriptive statistics to analyze the independent variable (government role) and dependent variable (emission reduction rate). The research design and data preparation are detailed, setting the stage for further analysis and testing of the hypotheses.

MGT723 Research Project
Semester 2 2018
Assessment Task 2: Research Proposal
Student Name:
Draft Research Question: “Whether there is a change observed in carbon emissions by the
influence of stakeholder interference?”
Title: Government Impact and the reduction in CO2 emissions by organisations in different
countries.
Submission Date:
Acknowledgement:
I certify that I have carefully reviewed the university’s academic misconduct policy. I
understand that the source of ideas must be referenced and that quotation marks and a
reference are required when directly quoting anyone else’s words.
Paraphrase This Document
Need a fresh take? Get an instant paraphrase of this document with our AI Paraphraser

INTRODUCTION
Climate change has over the past few decades emerged as a major global issue. This
has been due to its effects, which have become more visible with the increase in
extreme weather events and patterns. This has forced governments globally to get
involved in fighting climate change.
Governments are charged with making policies that govern the various aspects of the
lives of the citizens. The policies include manufacturing and processing policies that
applied during the Industrial Revolution to generate wealth. These policies have
proven to contribute to a surge in carbon emissions globally since the Industrial
Revolution (Ecolife, 2011).
In order to combat climate change, presently, governments have been forced to
develop and implement policies that would assist in reducing carbon emissions (Oba,
2014). The policies can only be successful if they are integrated into the business
strategies of the various companies and organizations in the country in question.
This paper focuses on establishing whether the policies developed by the various
governments globally have had an impact on mitigation of climate change. This will be
achieved by observing whether climate change has been integrated into the business
strategies of companies and organization as well as observing the respective carbon
emission percentages by each company or organization.
2 | P a g e

LITERATURE REVIEW - SUMMARY
Today, we live in a culture that has been significantly shaped by the forces of industry.
We live in a society that has come to place an extreme value on the consumption of
goods and services. However, the environmental cost of this kind of culture is not always
immediately visible. To produce any single good or service, there is a long chain of
processes that should also be accounted for when considering the environmental cost of
anything. (Greenberg, 2014)
Organisations are using resources at a very high rate which results into increase in
carbon emissions into the environment. Carbon Dioxide Emissions means the release
of greenhouse gases and/or their precursors into the atmosphere over a specified
area and period of time. (OECD, 2005). Since the industrial revolution the burning of
fossil fuels has increased, which directly correlates to the increase of co2 emissions
level in our atmosphere and thus the rapid increase of global warming. (Ecolife, 2011).
Co2 emissions have a very negative impact on the environment such as causing
global warming, ocean acidification, smog pollution, ozone depletion as well as
changes to plant growth and nutrition levels.
Now a days, most of the organisations consider corporate social responsibility in their
business strategies and plans. Corporate social responsibility goes a long way in for
creating a positive word of mouth for the organization on the whole. Doing something
for your environment, society, stake holders, customers would not only take your
business to a higher level but also ensure long term growth and success.
There are number of theories such as legitimacy, agency and stakeholder but in my
perspective stakeholder theory is best. So in order to develop a hypothesis I am
utilizing stakeholder theory. According to Edward Freeman, stakeholder theory holds that
a company’s stakeholders include just about anyone affected by the company and its
workings. Freeman suggests that a company’s stakeholders are "those groups without
whose support the organization would cease to exist." These groups would include
customers, employees, suppliers, society, managers, owners, government, creditors,
shareholders and more (Freeman, 1984).
3 | P a g e
⊘ This is a preview!⊘
Do you want full access?
Subscribe today to unlock all pages.

Trusted by 1+ million students worldwide

Figure illustrates external and internal stakeholders of the organisation.
(Accounting, 2018)
Stakeholder theory of research has two branches:-
1. Managerial Branch.
2. Normative Branch.
1. Managerial Branch- Under this branch, organization will not respond to all
stakeholders equally, but to the most powerful. Stakeholder power is a function
of the stakeholder’s degree of control over resources required by the
organization. (Hero, 2018)
4 | P a g e
Paraphrase This Document
Need a fresh take? Get an instant paraphrase of this document with our AI Paraphraser

2. Normative Branch- This branch hold that managers ought to pay attention to
key stakeholder relationships. According to this perspective, managerial
relationships with stakeholders are based on normative, moral commitments.
Rather than on a desire to use those stakeholders solely to maximize profits.
(Zawaideh, 2006)
In order to consider environmental impact of the organization, out of these two
branches managerial branch of stakeholder theory is more effective and useful.
In order to identify the influence of stakeholders, organization can use stakeholder
salience. The Salience Model uses three parameters to categorize stakeholders:
Power, Legitimacy and Urgency. (Sharma, 2010)
1. The Stakeholders' Power to influence the firm.
2 Legitimacy of the stakeholders' relationships with the firm
3 The urgency of the stakeholders claim on the firm. (Morphy, 2008).
In my perspective, power is the best parameter to check the influence of the different
stakeholders on the firm. Out of the different stakeholders, government is the most
important and powerful stakeholder. There is a high degree of impact of government
on the organisations. This is because the government has many powers that could be
implemented on organisations depending on their environmental performance and
corporate social responsibility. Government can implement many policies such as
make new rules and regulations, impose taxes. Furthermore government can impose
penalties on the firms which are not considering their operational activities impact on
the environment.
5 | P a g e

CONCEPTUAL MODEL
6 | P a g e
6 | P a g e
⊘ This is a preview!⊘
Do you want full access?
Subscribe today to unlock all pages.

Trusted by 1+ million students worldwide

Hypotheses:-
H1: There is a positive relationship between government influence on industries and
reduction of carbon emissions in climate.
Ho: There is a no relationship between government influence on industries and
reduction of carbon emissions in climate.
7 | P a g e
H1: There is a positive relationship between government influence on industries and
reduction of carbon emissions in climate.
Ho: There is a no relationship between government influence on industries and
reduction of carbon emissions in climate.
7 | P a g e
Paraphrase This Document
Need a fresh take? Get an instant paraphrase of this document with our AI Paraphraser

DATA DESCRIPTION AND PREPARATION
The sample data was collected from firms that are more directly involved in carbon
emissions. These firms were prioritized over other firms that are mostly consumers of
the products from firms that are directly involved in carbon emissions. The excluded
firms, which can be described as secondary contributors to carbon emissions, include
the firms in the financial industry. The firms considered for the samples were also
taken from four countries; Canada, United Kingdom, Brazil and United States of
America.
The sample data has three variables; Countries (those selected for observation and
research from which the firms originates), Government Role (in account of reduction of
CO2 emissions in the climate) and Emission Reduction Rate (in the rate of CO2
emissions by different companies).
The Countries variable is the Control Variable (CV) with four different categories.
These categories are the countries of Canada, United Kingdom, Brazil and United
States of America. This data variable is Nominal in nature.
The Government Role variable is the Independent Variable (IV) with two different
categories. Similar to the Countries variable, the Government Role is Nominal in
nature. The categories are 1 and 2; 1 represents “Yes” (the firm has climate change
integrated into its Business Strategy) while 2 represents “No” (the firm does not have
climate change integrated into its Business Strategy).
The Emission Reduction Rate is the dependent variable (DV). This data variable is
Ratio/Scale in nature representing the percentage change observed in 2013
compared to previous year’s data.
The sample data contains firms from various sectors or industries that can be
considered as primary contributors to carbon emissions. This therefore implies that the
analysis and findings from this research can be generalized for all sectors or industries
of the primary contributors.
However, the sample data only contains data collected from four countries; Canada,
United Kingdom, Brazil and United States of America. Whereas the list of countries
does include moderately industrialized to industrialized countries which are the
significant contributors to carbon emission, the list is not geographically balanced. The
8 | P a g e

countries come from predominantly the Americas and Europe. Including countries
from the Middle East and Asia would have made the analysis and findings from this
research more generalizable in terms of region
DATA ANALYSIS
The sample data contained missing values or entries. Below is a summary of the
missing values or entries in the sample data from SPSS.
Figure 1: Missing Values Analysis (Source SPSS)
From the analysis results represented in Figure 1: Missing Values Analysis (Source
SPSS) above, we observe that only one of the three data variables has missing
entries. 23.75% of the cases or observation are affected, this represents a total of 38
of the 160 observations. The percentage of entered values (entries) affected is
7.917%, which represents a total of 38 of the 442 entries.
Variable Summarya,b
Missing Valid N Mean Std.
DeviationN Percent
9 | P a g e
⊘ This is a preview!⊘
Do you want full access?
Subscribe today to unlock all pages.

Trusted by 1+ million students worldwide

Percentage
Reduction in Carbon
Emissions in 2013
38 23.8% 122 569.054
0
517.15598
a. Maximum number of variables shown: 25
b. Minimum percentage of missing values for variable to be included:
10.0%
Table 1: Missing Values Analysis (Source SPSS)
Table 1: Missing Values Analysis (Source SPSS) above represents the variable
summary for missing values analysis. From Table 1: Missing Values Analysis (Source
SPSS), the only variable with missing values is the Percentage Reduction in Carbon
Emissions in 2013. The missing values represent 23.8% of the entries for this variable.
This represents a total of 38 of the 160 entries for the variable. The remaining valid
entries are 122 entries.
Since the percentage of the missing values is more than 5%, to deal with the empty
entries we apply the Multiple Imputation Technique in SPSS. This technique will
impute 23.8 (Rounded to 24) datasets. However, for efficiency, we will use the default
imputation number of 5 imputations for 5 datasets. Analysis on the resultant dataset
will produce a pooled outcome.
Independent Variable Analysis
The independent variable (IV) is the Government Role Variable, described as Climate
Change Integration into Business Strategy. The analysis of the Independent Variable
produced the outputs below:
Statistics
Integration of Climate Change into
Business Strategy
Original
data N Valid 160
Missing 0
1 N Valid 160
Missing 0
10 | P a g e
Paraphrase This Document
Need a fresh take? Get an instant paraphrase of this document with our AI Paraphraser

2 N Valid 160
Missing 0
3 N Valid 160
Missing 0
4 N Valid 160
Missing 0
5 N Valid 160
Missing 0
Pooled N Valid 160
Missing 0
Table 2: General Statistics for Independent Variable
Integration of Climate Change into Business Strategy
Imputation Number Frequenc
y
Percent Valid
Percent
Cumulative
Percent
Original
data Valid
Yes 80 50.0 50.0 50.0
No 80 50.0 50.0 100.0
Total 160 100.0 100.0
1 Valid
Yes 80 50.0 50.0 50.0
No 80 50.0 50.0 100.0
Total 160 100.0 100.0
2 Valid Yes 80 50.0 50.0 50.0
No 80 50.0 50.0 100.0
11 | P a g e
Missing 0
3 N Valid 160
Missing 0
4 N Valid 160
Missing 0
5 N Valid 160
Missing 0
Pooled N Valid 160
Missing 0
Table 2: General Statistics for Independent Variable
Integration of Climate Change into Business Strategy
Imputation Number Frequenc
y
Percent Valid
Percent
Cumulative
Percent
Original
data Valid
Yes 80 50.0 50.0 50.0
No 80 50.0 50.0 100.0
Total 160 100.0 100.0
1 Valid
Yes 80 50.0 50.0 50.0
No 80 50.0 50.0 100.0
Total 160 100.0 100.0
2 Valid Yes 80 50.0 50.0 50.0
No 80 50.0 50.0 100.0
11 | P a g e

Total 160 100.0 100.0
3 Valid
Yes 80 50.0 50.0 50.0
No 80 50.0 50.0 100.0
Total 160 100.0 100.0
4 Valid
Yes 80 50.0 50.0 50.0
No 80 50.0 50.0 100.0
Total 160 100.0 100.0
5 Valid
Yes 80 50.0 50.0 50.0
No 80 50.0 50.0 100.0
Total 160 100.0 100.0
Pooled Valid
Yes 80
No 80
Total 160
Table 3: Detailed Statistics for Independent Variable
From Table 2: General Statistics for Independent Variable we observe that the
Independent Variable had no missing values in all the imputations with a total of 160
entries in each imputation. The pooled results show no missing values and a total of
160 entries as well.
From Table 3: Detailed Statistics for Independent Variable we observe 80 “Yes”
responses, representing 50% of the cases, and the remaining 80 responses being
“No”, equally representing 50%. This represents the results of the analysis in each of
the imputation as well as the pooled results.
Descriptives
Imputation Number Statistic Std.
Error
Original
data
Integration of Climate
Change into Business
Strategy
Mean 1.50 .040
95% Confidence
Interval for Mean
Lower
Bound
1.42
Upper
Bound
1.58
12 | P a g e
⊘ This is a preview!⊘
Do you want full access?
Subscribe today to unlock all pages.

Trusted by 1+ million students worldwide
1 out of 27
Related Documents

Your All-in-One AI-Powered Toolkit for Academic Success.
+13062052269
info@desklib.com
Available 24*7 on WhatsApp / Email
Unlock your academic potential
Copyright © 2020–2025 A2Z Services. All Rights Reserved. Developed and managed by ZUCOL.