Microeconomics Homework: PPF, Elasticity, and Market Equilibrium
VerifiedAdded on  2020/02/24
|13
|1998
|149
Homework Assignment
AI Summary
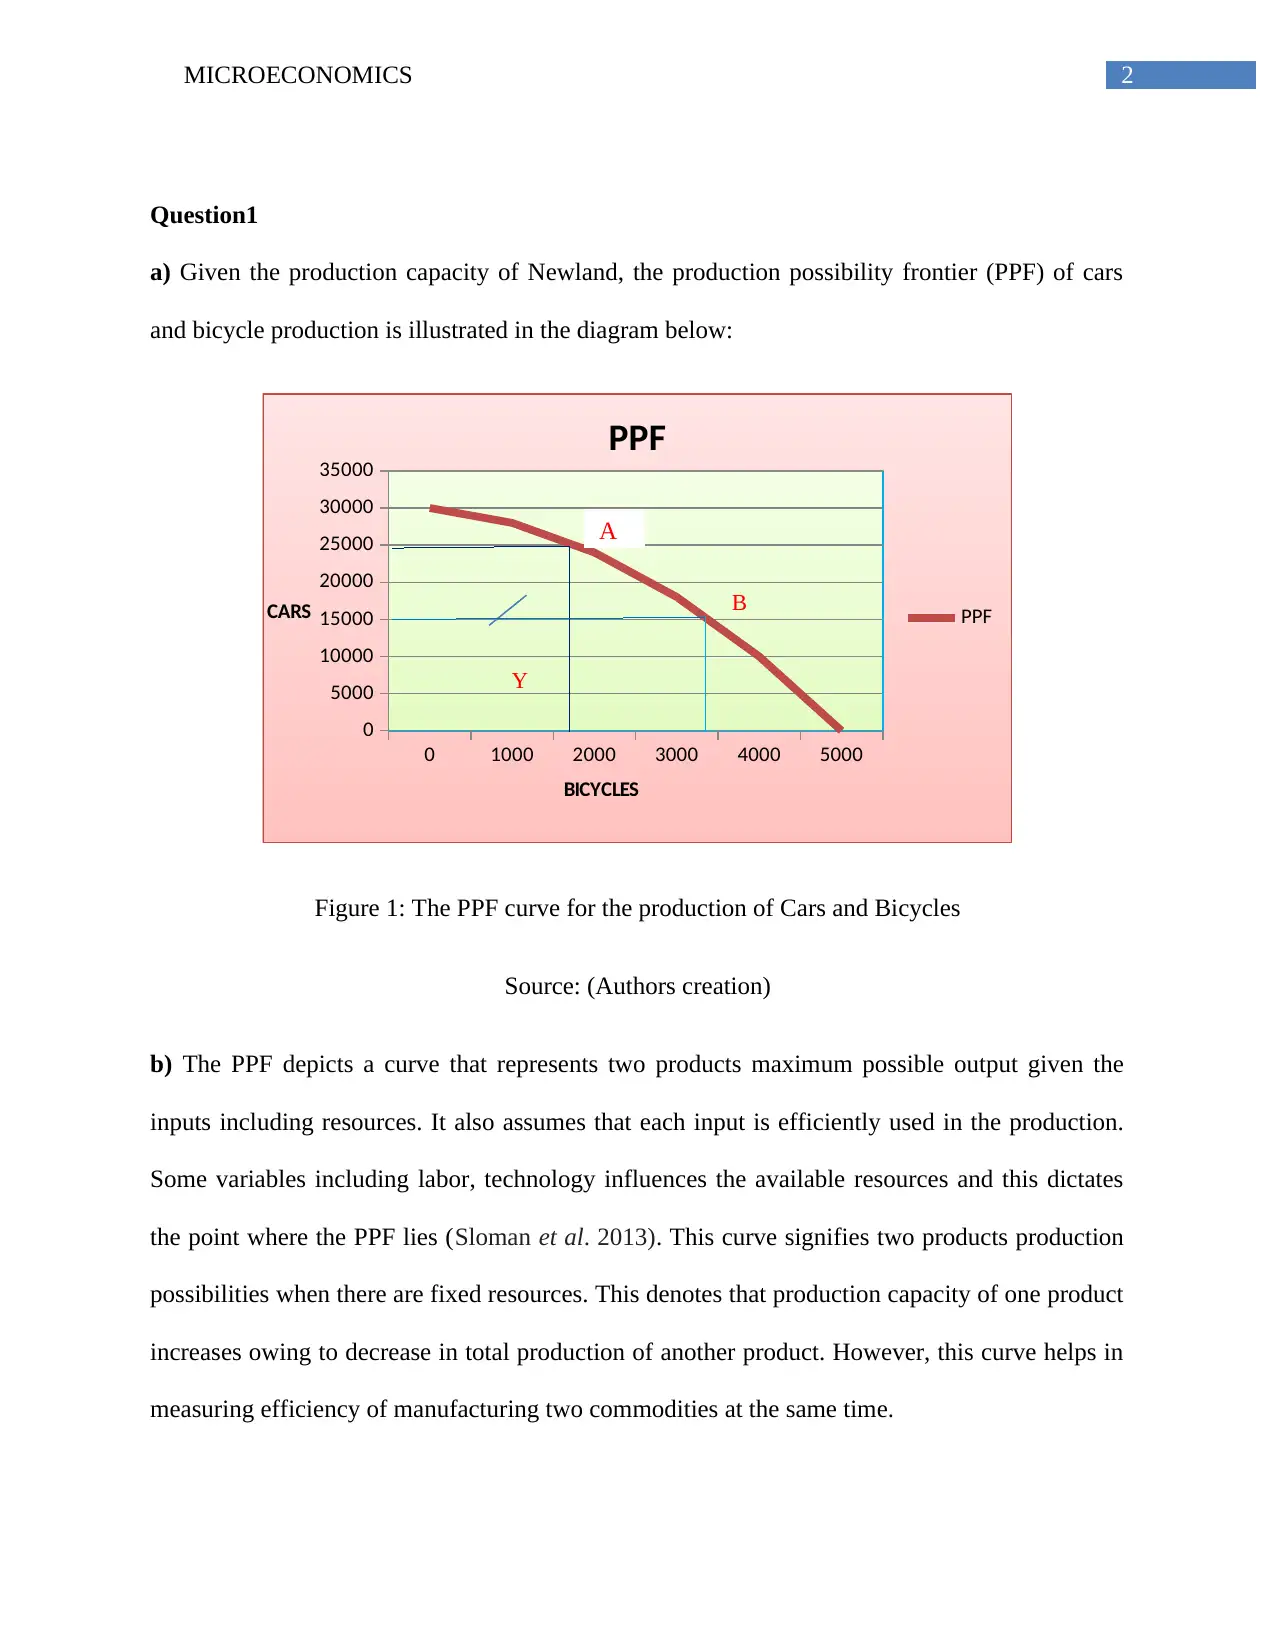
This microeconomics assignment delves into several key concepts. It begins by analyzing the Production Possibility Frontier (PPF) to illustrate the trade-offs in production between cars and bicycles, explaining efficiency, resource allocation, and the impact of technological advancements and imports. The assignment then explores demand and supply, calculating total revenue and price elasticity of demand for computer chips, and examining the relationship between price changes and revenue. It proceeds to determine market equilibrium using demand and supply functions, calculating consumer and producer surplus, and evaluating the impact of a price ceiling and deadweight loss. Finally, it examines the effects of government taxation on Alcops, discussing tax incidence, the ineffectiveness of the tax in reducing teenage drinking, and alternative policies to address binge drinking. The analysis includes graphical representations and detailed explanations of each concept.

Running head: MICROECONOMICS
MICROECONOMICS
Name of the Student
Name of the University
Authors Note
MICROECONOMICS
Name of the Student
Name of the University
Authors Note
Paraphrase This Document
Need a fresh take? Get an instant paraphrase of this document with our AI Paraphraser

1MICROECONOMICS
Table of Contents
Question1.........................................................................................................................................2
Question 2........................................................................................................................................4
Question 3........................................................................................................................................9
References......................................................................................................................................12

2MICROECONOMICS
Question1
a) Given the production capacity of Newland, the production possibility frontier (PPF) of cars
and bicycle production is illustrated in the diagram below:
0 1000 2000 3000 4000 5000
0
5000
10000
15000
20000
25000
30000
35000
PPF
PPF
BICYCLES
CARS B
Y
Figure 1: The PPF curve for the production of Cars and Bicycles
Source: (Authors creation)
b) The PPF depicts a curve that represents two products maximum possible output given the
inputs including resources. It also assumes that each input is efficiently used in the production.
Some variables including labor, technology influences the available resources and this dictates
the point where the PPF lies (Sloman et al. 2013). This curve signifies two products production
possibilities when there are fixed resources. This denotes that production capacity of one product
increases owing to decrease in total production of another product. However, this curve helps in
measuring efficiency of manufacturing two commodities at the same time.
A
⊘ This is a preview!⊘
Do you want full access?
Subscribe today to unlock all pages.

Trusted by 1+ million students worldwide

3MICROECONOMICS
The above figure reflects PPF of the manufacture of cars and bicycles. In this figure, point A and
B on PPF curve indicates that the resources are efficiently allocated by the economy, while point
Y represents inefficient utilization of resources. At point A, if the economy wants to manufacture
large number of cars then it will have to give up those resources that are used for producing
bicycles. On the other hand, point B denotes that if the nation starts to produce huge number of
bicycles then it must divert the resources that are utilized in manufacturing cars (Taussig 2013).
Therefore, shifting from point A to point B, the nation will decline production of cars by
negligible amount as compared to rise in output of bicycle. Point Y represents that the resources
of the nation are not allocated efficiently. This means that the nation is not manufacturing large
number of cars and bicycles given the resource potential.
The underlying assumptions of PPF are given below:
ï‚· Though the total amount of resources utilized in manufacturing products is fixed, it can
be relocated for producing one good to another (Rios et al. 2013).
ï‚· Technology used in the production of commodities is presumed to be fixed.
ï‚· Efficient utilization of resources
ï‚· The economy can utilize same amount of resources for producing both the products and
hence is shifted freely.
The properties of PPF are given as under:
 PPF is negatively sloped – PPF is negatively sloped as change in total amount of one
product is inversely related with the change in amount of other product.
Paraphrase This Document
Need a fresh take? Get an instant paraphrase of this document with our AI Paraphraser

4MICROECONOMICS
ï‚· PPF is concave shaped- PPF curve is concave in shape owing to increase in marginal
opportunity cost. This means that the nation sacrifices large amount of one product for
gaining extra amount of another product.
c) In order to meet the increase in demand for cars and bicycles, the three possibilities by which
Newland meets the increased demand includes:
ï‚· It is predicted that Newland will introduce new technology for meeting the increased
demand for these two types of products (Rader 2014). However, implementation of new
technology will help the economy to increase the total production.
ï‚· Newland might increase the supply of these two products for meeting the needs of the
customers. Moreover, technology also contributes to increase in supply of these products.
ï‚· In addition, import of goods will also help Newland in meeting the customers demand for
cars and bicycles. Hence, its supply increases owing to import of these products.
Question 2
a) Given the demand schedule for computer chips, the total revenue attained by the company is
57500 dollar. Total revenue signifies the total receipts gained from the product sales throughout
the year. If the price of computer chips falls from the data given in the table, the total revenue of
the company also decreases. However, this reflects that fall in total revenue adversely impacts on
the financial performance of the company (Nicholson and Snyder 2014). This is shown in the
table below:

5MICROECONOMICS
Price(dolla
rs in chip)
Quantity
demanded(millio
ns of chips per
year)
Total
revenu
e
Fall
in
pric
e
Quantity
demande
d
Total
revenu
e
200 50 10000 200 50 10000
250 45 11250 250 45 11250
300 40 12000 300 40 12000
350 35 12250 300 35 10500
400 30 12000 350 30 10500
57500 54250
Table 1: Total revenue attained after the fall in price of computer chips
Source: (Authors creation)
b)
Price
Quantity
demanded
Total
revenu
e
Price
elasticit
y of
demand
Total
revenue
test
200 50 10000 3 elastic
250 45 11250 -0.6 Inelastic
300 40 12000 -0.7 Inelastic
350 35 12250 -0.8 Inelastic
400 30 12000 -0.9 Inelastic
Table 2: Total revenue test determining elasticity of demand for good
Source: (Authors creation)
Price elasticity of demand (Ed) refers to the sensitivity of demand for quantity of goods with
respect to its price change. Therefore, Ed= Change in proportion of demand for quantity/Change
⊘ This is a preview!⊘
Do you want full access?
Subscribe today to unlock all pages.

Trusted by 1+ million students worldwide

6MICROECONOMICS
in proportion of price. Ed=(Q2-Q1)/(P2-P1)*((P1+P2)/2)/((Q1+Q2)/2). The relationship between
total revenue and elasticity of demand is defined with the help of total revenue test. In case of
elastic demand, the price and revenue moves in the opposite direction (Mankiw 2014). On the
contrary, the price and revenue moves in the same direction. However, rise in product price with
inelastic goods demand, profit exceeds loss. On the other hand, decrease in price with elastic
product demand, loss exceeds gain (Hall and Lieberman 2012). This test shows that TR remains
unchanged with rise or fall in price. With average price of $300, the elasticity of demand is
shown in the table.
c) Widgets demand function is given as:
QD=100-5P
QS=5P
The market equilibrium occurs when the product’s demand curve intersects with its supply
curve. Therefore, Qd=Qs
100-5P=5p
100=5p+5p
100=10P
P=100/10=10, QD=100-5*10=100-50=50
d) Consumer surplus signifies measurement of welfare that every individuals wants to gain from
the consumption of products. It is estimated from the difference between the amount of
Paraphrase This Document
Need a fresh take? Get an instant paraphrase of this document with our AI Paraphraser

7MICROECONOMICS
commodity for which the consumers are eager to pay and the amount he actually pays. Consumer
Surplus is calculated as-
CS= ½ *(Base *Height)
Height Qd
Consumer
Surplus
20 50 250
10
Producer surplus refers to the excess amount that producers gain from selling their commodities
in the marketplace (Gans et al. 2012). Therefore, it is assessed from the difference between the
quantity of products that is received by the producer and the amount that they eager to accept.
Producer surplus is also evaluated in the same way as that of the consumer surplus.
Height Qd
Producer
Surplus
10 50 250
0
Total surplus is estimated by the summation of consumer as well as producer surplus.
TS=250+250=500
e) Maximum sold quantity of the product is 25 and the price of the product is assumed to $15.
Therefore, the consumer surplus is estimated as:
Height Qd
Consumer
surplus
20 25 62.5

8MICROECONOMICS
15
In this case, producer surplus is evaluated as:
Height Qd
15 25 187.5
0
Deadweight loss refers to total welfare loss owing to various reasons like price ceilings, taxes
etc. Therefore, deadweight loss is calculated as:
Deadweight loss=1/2*(P2-P1)*(Q1-Q2)
=125
Now if the price is set at $5, Consumer surplus is
Height Qd
Consumer
surplus
20 25 187.5
5
Producer surplus is evaluated as-
Height Qd
Producer
surplus
5 25 62.5
0
Deadweight loss=132.5
f) Using both the equations, the demand and supply cure is drawn and market equilibrium is
shown at point E with equilibrium price at 10 and equilibrium quantity at 50.
⊘ This is a preview!⊘
Do you want full access?
Subscribe today to unlock all pages.

Trusted by 1+ million students worldwide

9MICROECONOMICS
0 20 40 60 80 100 120
0
5
10
15
20
25
MARKET EQUILIBRIUM
Qd
Qs
Output
Price
E
Figure 1: Demand and supply curve
Source: (Author’s creation)
Question 3
a) The result of the government imposition of tax on Alcops is definitely surprising. As
excessive consumption of Alcops leads to various health problems, the Australian government
took the right step in imposing the tax on Alcops for reducing teenage drinking. According to the
economic theory, price of any product is inversely proportional to its quantity demanded
(Friedman 2017). However, increase in tax on alcohol leads to rise in its price, which results to
decrease in its consumption. Though the motive of the government was to increase the tax
revenue earned from Alcops , the earnings was 6% less than it was predicted. This is because
demand for higher alcohol products reduces owing to imposition of sin tax and hence this results
to supply surplus (Baumol and Blinder 2015). This is a condition of price flooring where higher
price influences the market by reducing its demand. However, it is given that no reduction in
Paraphrase This Document
Need a fresh take? Get an instant paraphrase of this document with our AI Paraphraser

10MICROECONOMICS
Quantity of Alcops
Price
S
D
P
Q
P* Price Flooring
teenage drinking occurred at the end of financial year leads to contradictory statement. This can
occur if the cheaper products are purchased instead of higher priced products. Therefore, demand
for Alcops does not change irrespective of change in its price.
Figure 2: Demand and supply model for Alcops
Source: (Authors creation)
b) The sellers bears greater burden of tax because they produces both higher and cheaper
products but higher products are less purchased than cheaper ones. However, suppliers attains
lower profitability and hence bears huge tax burden (Bauer 2014). Therefore, the outcome was
not tax efficient.
c) Imposition of tax is not the effective means of reducing binge drinking and health hazards.
Other policies by which the Australian government might implement with this aim are

11MICROECONOMICS
restrictions in its advertisement, regulating alcohol availability in the market by licensing and
policing such as breath testing.
restrictions in its advertisement, regulating alcohol availability in the market by licensing and
policing such as breath testing.
⊘ This is a preview!⊘
Do you want full access?
Subscribe today to unlock all pages.

Trusted by 1+ million students worldwide
1 out of 13
Related Documents

Your All-in-One AI-Powered Toolkit for Academic Success.
 +13062052269
info@desklib.com
Available 24*7 on WhatsApp / Email
Unlock your academic potential
Copyright © 2020–2025 A2Z Services. All Rights Reserved. Developed and managed by ZUCOL.