Economics Report: Microeconomics and Macroeconomics Analysis
VerifiedAdded on 2022/12/29
|12
|3233
|64
Report
AI Summary
This economics report provides a comprehensive analysis of microeconomic and macroeconomic concepts. The microeconomic section differentiates between cardinal and ordinal approaches to consumer behavior, explaining consumer equilibrium in both single and multiple commodity models, and evaluating the concept of elasticity, including demand, income, cross, and supply elasticities. The macroeconomic section explores the components of aggregate demand within GDP, detailing household spending, capital investment, government spending, and exports and imports. Furthermore, the report critically discusses the limitations of GDP as a measure of national well-being, acknowledging its strengths in reflecting economic growth while highlighting its inability to fully capture factors such as health, happiness, and living standards. The report is supported by a thorough review of the literature, with references to demonstrate the research and understanding.

ECONOMICS
Paraphrase This Document
Need a fresh take? Get an instant paraphrase of this document with our AI Paraphraser
Table of Contents
INTRODUCTION...........................................................................................................................3
MAIN BODY..................................................................................................................................3
Question 1........................................................................................................................................3
A. Differentiate ordinal and cardinal and equilibrium position on consumer behaviour............3
B. Evaluating usefulness of the concept of elasticity..................................................................6
Question 2........................................................................................................................................7
A. Components of aggregate demand of GDP............................................................................7
B.GDP not a measure of well-being of nation.............................................................................9
CONCLUSION..............................................................................................................................10
REFERENCES..............................................................................................................................11

INTRODUCTION
Economics is being classified as micro-economics and macro-economics. Micro
economics is used to study in on individuals and organization decisions which focus on demand
and supply of goods and service affected with price and other factor, while macroeconomics is
been focused on the decision of whole country and government (Jansen, Schollmeyer and
Augustin, 2017). This report includes the cardinal and ordinal approaches on consumer
behaviour and usage of elasticity. While macro-economic shows the aggregate demand and their
components.
MAIN BODY
Question 1
A. Differentiate ordinal and cardinal and equilibrium position on consumer behaviour.
Utility shows the satisfaction level of the consumer and it differs from consumer to
consumer. The utility can be denoted from cardinal approach and ordinal approach.
Cardinal approach explain that satisfaction level gain after consuming the goods and
service and the utility can be hold and measurable. Consumer can measure quantitative cardinal
in terms of size, which shows level of satisfaction is gained from the goods and service. While in
actual terms, cardinal utility is measured in terms of money which shows the purchasing power
of consumers. For example: Marshal consume two goods and get 60 utility from pizza but 40
utility from burger. Cardinal approach can be measured as utile which is less practical in real
terms.
Cardinal approach to consumer equilibrium states that when the satisfaction level of consumers
is reached it shows the equilibrium point of consumer with the given resources and other factors.
While a consumer is highly satisfied when consumer allocates this expenditure in such a way
that give same level of satisfaction by money spending on each commodity. The two equilibrium
model of consumer satisfaction are:
1. Consumer equilibrium in single commodity Model: This model shows, when the
consumer consumes single commodity with given amount of money, income can retain
or spend on single commodity to gain utility. If the marginal utility of commodity X
(MUx) is more the marginal utility of money (MUm), consumer will spend this money to
gain maximum of commodity X. Whereas, after the maximum utility gained from
⊘ This is a preview!⊘
Do you want full access?
Subscribe today to unlock all pages.
Trusted by 1+ million students worldwide
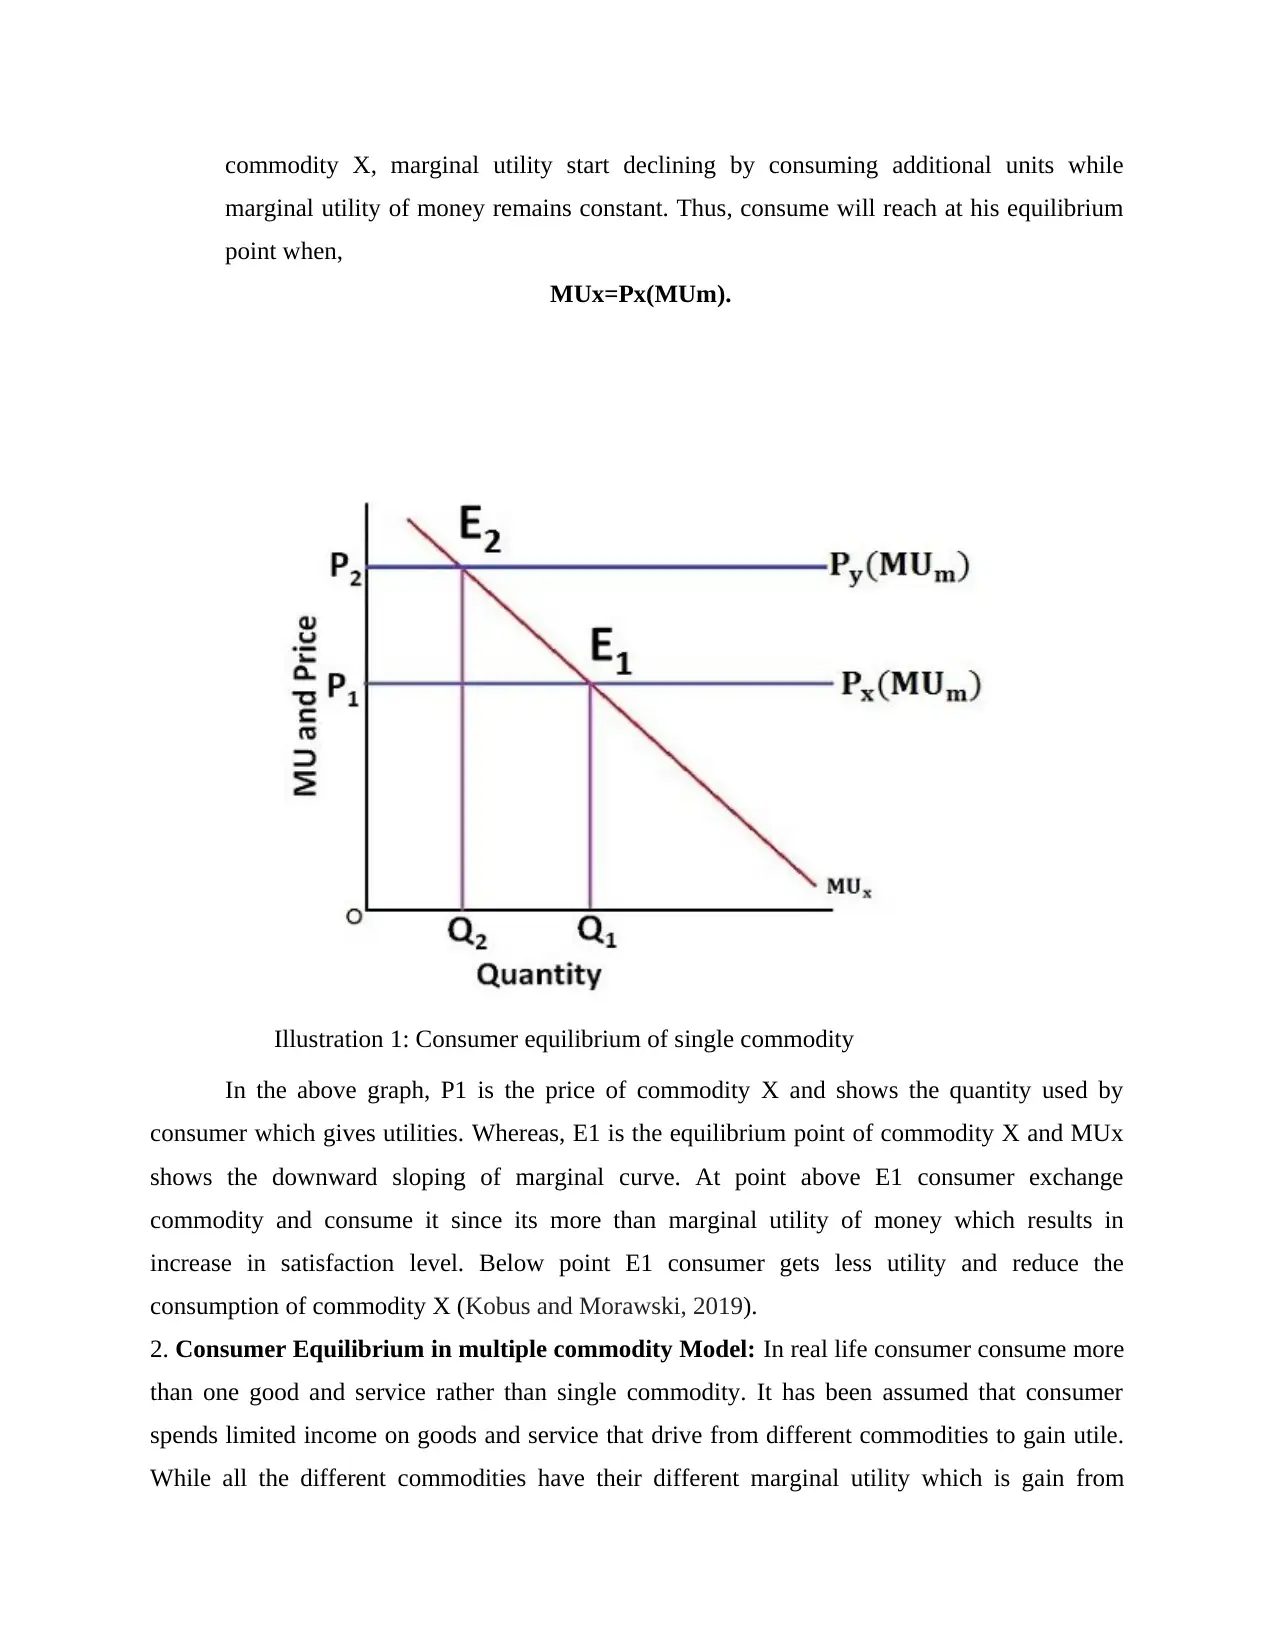
commodity X, marginal utility start declining by consuming additional units while
marginal utility of money remains constant. Thus, consume will reach at his equilibrium
point when,
MUx=Px(MUm).
In the above graph, P1 is the price of commodity X and shows the quantity used by
consumer which gives utilities. Whereas, E1 is the equilibrium point of commodity X and MUx
shows the downward sloping of marginal curve. At point above E1 consumer exchange
commodity and consume it since its more than marginal utility of money which results in
increase in satisfaction level. Below point E1 consumer gets less utility and reduce the
consumption of commodity X (Kobus and Morawski, 2019).
2. Consumer Equilibrium in multiple commodity Model: In real life consumer consume more
than one good and service rather than single commodity. It has been assumed that consumer
spends limited income on goods and service that drive from different commodities to gain utile.
While all the different commodities have their different marginal utility which is gain from
Illustration 1: Consumer equilibrium of single commodity
Paraphrase This Document
Need a fresh take? Get an instant paraphrase of this document with our AI Paraphraser
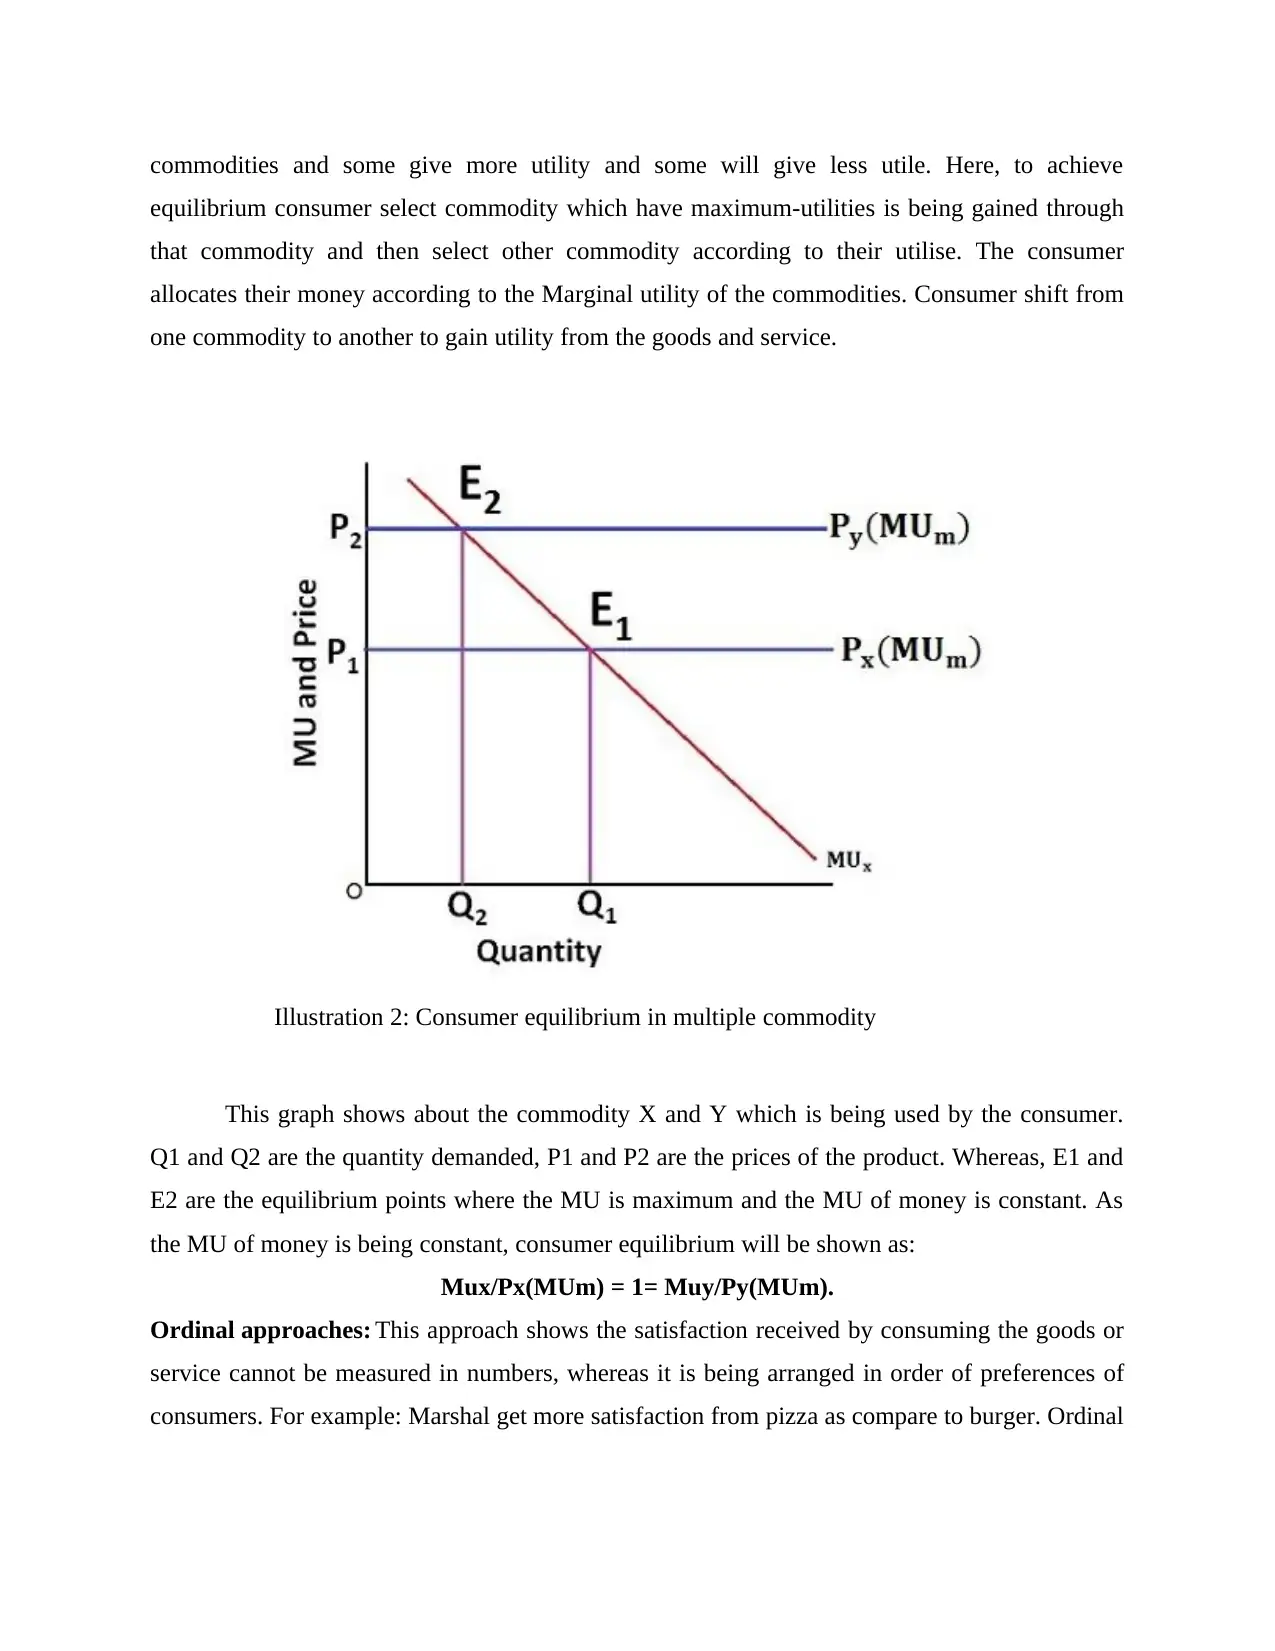
commodities and some give more utility and some will give less utile. Here, to achieve
equilibrium consumer select commodity which have maximum-utilities is being gained through
that commodity and then select other commodity according to their utilise. The consumer
allocates their money according to the Marginal utility of the commodities. Consumer shift from
one commodity to another to gain utility from the goods and service.
This graph shows about the commodity X and Y which is being used by the consumer.
Q1 and Q2 are the quantity demanded, P1 and P2 are the prices of the product. Whereas, E1 and
E2 are the equilibrium points where the MU is maximum and the MU of money is constant. As
the MU of money is being constant, consumer equilibrium will be shown as:
Mux/Px(MUm) = 1= Muy/Py(MUm).
Ordinal approaches: This approach shows the satisfaction received by consuming the goods or
service cannot be measured in numbers, whereas it is being arranged in order of preferences of
consumers. For example: Marshal get more satisfaction from pizza as compare to burger. Ordinal
Illustration 2: Consumer equilibrium in multiple commodity
utility is being ranked on the basis of satisfaction received. It is more realistic as compare to
cardinal approach.
Ordinal approaches to consumer equilibrium is said when consumer maximize his total
utility in the given level of income and price remain constant. There are two methods of
consumer equilibrium in ordinal approach (Shergin and Chala, 2017).
First order condition: It is same model as of cardinal multiple approach and reach equilibrium
point and can be denoted from
MUx/MUy=MRSxy
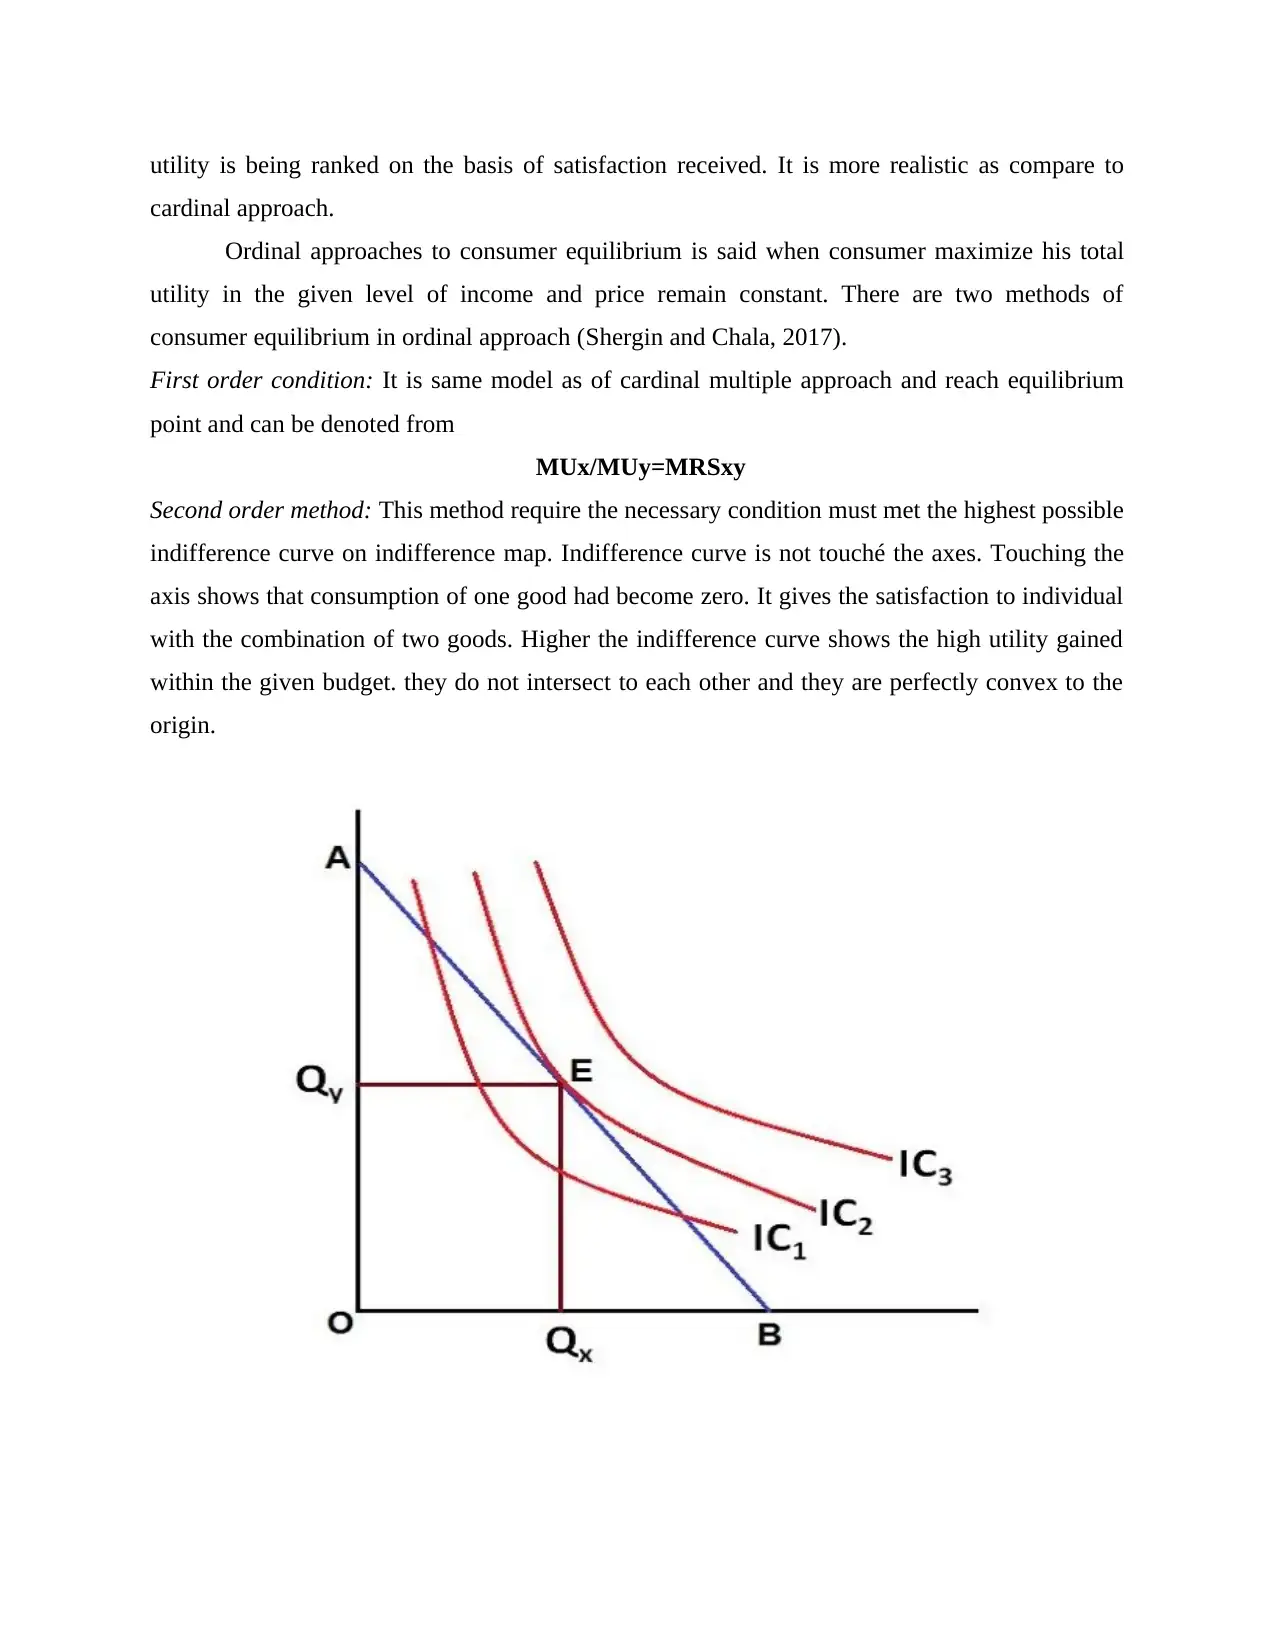
Second order method: This method require the necessary condition must met the highest possible
indifference curve on indifference map. Indifference curve is not touché the axes. Touching the
axis shows that consumption of one good had become zero. It gives the satisfaction to individual
with the combination of two goods. Higher the indifference curve shows the high utility gained
within the given budget. they do not intersect to each other and they are perfectly convex to the
origin.
cardinal approach.
Ordinal approaches to consumer equilibrium is said when consumer maximize his total
utility in the given level of income and price remain constant. There are two methods of
consumer equilibrium in ordinal approach (Shergin and Chala, 2017).
First order condition: It is same model as of cardinal multiple approach and reach equilibrium
point and can be denoted from
MUx/MUy=MRSxy
Second order method: This method require the necessary condition must met the highest possible
indifference curve on indifference map. Indifference curve is not touché the axes. Touching the
axis shows that consumption of one good had become zero. It gives the satisfaction to individual
with the combination of two goods. Higher the indifference curve shows the high utility gained
within the given budget. they do not intersect to each other and they are perfectly convex to the
origin.
⊘ This is a preview!⊘
Do you want full access?
Subscribe today to unlock all pages.
Trusted by 1+ million students worldwide
In the given diagram, IC1, IC2 and IC3 are indifference curve, AB is the budget line.
Here IC2 met the budget line and equilibrium pointy of consumer. This shows the IC2 gives the
highest utility within the given budget and according to taste and preference.
B. Evaluating usefulness of the concept of elasticity.
Elasticity describes the change in behaviour of buyer and seller with response to price of
goods and service. Elasticity of demand and in-elasticity shows how much change in demand of
goods and service due to increase or decrease in price. While, inelastic shows the consumer
consume goods even after the change in price (Storm, Supriatna, and Kaliske, 2020). The
elasticity is changed according to number of substitute available in the market.
The usefulness of elasticity is can be classified as:
Demand elasticity: it measure the sensitivity of demand which are related to change in
other variables. The quantity demand of goods and service are depend on the factor like
price, substitute product, income and preference of consumers. While change in these
variable result in change in this quantity demanded of that product in the market. When
there is interlinked between change in price and change in quantity demanded of goods
and service, the elasticity is called price elasticity of demand.
Income elasticity: this elasticity refers to change in quantity demand in goods to a
change in real income of consumer purchases those goods while all things remain
constant. Income elasticity can be calculated as change in percentage of quantity
demanded is divided by percentage change in income of consumer. Income elasticity of
demand shows the goods is necessity goods or luxury goods.
Cross elasticity: It results in change quantity demand of one goods due to change in
price of other goods in the market. It is also known as cross price elasticity of demand
which can be calculated from percentage change in quantity demand of one good is
divided by percentage change in price of other good in the market.
Price elasticity of supply: it shows the responsive change in supply of goods and service
with respond to change in price in the market. This simple denotes when the price of
goods increased in the market, supplier increase the supply of that good to earn good
profits. Whereas, is the market price of the goods are low, supply of that good will
decrease by supplier in the market (Wu,Yuan and Tu, 2020).
Paraphrase This Document
Need a fresh take? Get an instant paraphrase of this document with our AI Paraphraser
Elasticity is use for the companies and the product and service to know the demand and
supply of goods and the effect of change in factors like price, income and taste and preference of
consumer to goods and service.
Question 2
A. Components of aggregate demand of GDP
Aggregate demand
It can be said to be the total amount of all finished goods and services which is produced
in an economy. It is monetary transaction exchanged at specific point of time at a specific price
level. Aggregate demand relates GDP by taking in account the price levels. The increase or
decrease both happens together in case of GDP and aggregate demand. It consists of consumer
goods, capital goods, exports, imports with government spending.
The components of aggregate demand are:
a) Household spending: This has been the largest element of expenditure talking of UK
economy. The demand is basically for durables and non-durable goods who have to be bought
after a period of time. The family budget is spent on various categories like food, clothing,
housing, alcohol etc. The UK being an advanced economy people are spending money on new
brands of home care and personal care products (Dean and et.al., 2020). For e.g.: the past decade
has seen growth in men's care products such as after shave, face creams etc. The entry of new
brands in the market has also made consumer spending increase. The biggest factors have been
housing costs, food and clothing. Housing costs have increased due to increase in property rates.
Expenditure on food and clothing have however decreased with increase in spending over
alcohol.
b) Capital Investment: The investment is basically on manufacturing sector like plant and
equipment and buildings to increase consumer goods in the future. Investment in UK has been
not very high in manufacturing as the GDP share of manufacturing sector has been around 21%
(Vanessa,2020). The production share has been declining as UK has invested less in Research
and Development in past two to three decades. There has also been more competition from Asian
counterparts.
c)Government spending: The spending is on state goods and services which includes spending
on public goods. The government spends around 20% of GDP generally (Geoff, 2020). Speaking
of UK, the departments which the government is focusing on is social protection, health,
education, debt interest, defence, public order and safety, personal social services, housing and
environment, transport, industry, agriculture and employment (Skott,2019).
d)Export of goods and services: The goods and services which UK deals in are cars, gas
turbines, crude petroleum, gold, pharmaceuticals, aircraft parts, refined petroleum, paintings,
computers, petroleum gas, air pumps etc. The UK top exports accounting for two-thirds of global
shipments (Daniel , 2020).
e) Import of goods and services: The UK imports account for around two-third of overall value
of product purchase (Daniel,2020). The imports are listed as gems, machinery, vehicles,
electrical machinery, mineral fuels, pharmaceuticals etc.
B.GDP not a measure of well-being of nation
GDP is not a measure of all the aspects which affect a nation. It measures however the economic
well-being of a nation in terms of growth but it does not take in account the factors such as
health, happiness of the people living in the country, their living standards, facilities provided,
education status of the people etc. A high GDP may show that a country is doing well on
economic aspect and the trade with other nations going well (Dean and et.al., 2020). However,
the quantity of growth reaching to the people in actual may be entirely different. It may be
because of reasons like government not spending on a sector according to the requirement, due to
corruption happening at various levels in public departments etc.
The GDP however does throw light on some aspects like a GDP which is high of a
country will reflect that the country can afford better facilities such as health care, better
educational system, high quality infrastructure. If a country's trade is doing well it will mean that
the country is having a better global outlook, better reach to other nations, more capital for the
economy and increase in business opportunities. But the problem which creeps in is GDP
although uses market price to value the goods and services but excludes the activity which is
taking place outside the market. The value of goods and services gets omitted. For e.g. a retail
⊘ This is a preview!⊘
Do you want full access?
Subscribe today to unlock all pages.
Trusted by 1+ million students worldwide
chain in UK is providing value at low price for its products. The customer satisfaction at being
offered valuable service will not be counted in GDP. However, this factor may result in growth
of the business and affecting the GDP positively. Volunteer work at a NGO in UK will be
positively affecting lives of people and creating value for their lives but it will remain
unaccounted in GDP (Auclert and Rognlie, 2018).
The other thing which GDP excludes is the quality of the environment. A country doing
well in GDP may be rising on economic terms but may not be following environmental
regulations to achieve growth further. It will lead to a deterioration in environment and this will
affect the lives of people in the country. The country will have to then spend extra on healthcare
facilities. The deterioration in quality of air and water will offset the growth received which will
lead to lessening of GDP projection of growth. The countries thus have decided to achieve a
sustainable growth rate which does not harm the environment. Speaking of UK, the government
has imposed restrictions on the manufacturing firms and instructed them to reduce the carbon
print for a period charted out according to their manufacturing capacity.
GDP does not lay focus on income distribution. It may happen that in a country with
large GDP the income is focused among top notch. Average person may not be getting a good
amount. Thus, average per capita income is necessary to reflect a common man's status in the
country. The amount of goods and services need to be judged as per common man's perspective
how much can be utilised by him. Speaking of UK, the per capita income is decent as it is a
developed nation. However, it is being considered by many that GDP per person will be more
able to reflect the development aptly (Skott, 2019).
The quality of life is also not measured by GDP. It may happen that a country is on road
to economic growth but the same may not be reflected in the residential facilities of drainage,
water supply and road construction. It may happen due to corruption in which money of public is
not properly utilised in government schemes and life quality remains same as earlier. The GDP
will not be able to assess this factor and the growth will only be reflected in trade but not on its
impact on infrastructure.
CONCLUSION
Paraphrase This Document
Need a fresh take? Get an instant paraphrase of this document with our AI Paraphraser
It may be concluded that micro economics and macroeconomics factor are both influential in
decision making on individual as well as government basis. The ordinal and cardinal approaches
have been discussed with equilibrium position on consumer behaviour. The importance of
concept of elasticity has been discussed. The aggregate demand of GDP factors have been
described with relevance to UK'S GDP. The relevance and non-relevance of GDP has been
discussed considering various factors if it can show real growth or if there are many factors
which need to be considered while assessing outcome of GDP.
REFERENCES
Books and journals
Auclert, A. and Rognlie, M., 2018. Inequality and aggregate demand (No. w24280). National
Bureau of Economic Research.
Dean, E. and et.al., 2020. The Components of Aggregate Demand. Principles of Economics:
Scarcity and Social Provisioning (2nd Ed.).
Jansen, C., Schollmeyer, G. and Augustin, T., 2017, June. Concepts for decision making under
severe uncertainty with partial ordinal and partial cardinal preferences. In Proceedings
of the tenth international symposium on imprecise probability: theories and
applications (pp. 181-192). PMLR.
Kobus, M. and Morawski, L., 2019. Comparing Cardinal and Ordinal Approaches to Measuring
Socioeconomic Inequalities in Health. Eastern European Economics. 57(6). pp.484-502.
Shergin, V. and Chala, L., 2017, October. The concept of elasticity of scale-free networks.
In 2017 4th International Scientific-Practical Conference Problems of
Infocommunications. Science and Technology (PIC S&T) (pp. 257-260). IEEE.
Skott, P., 2017. Autonomous demand and the Harrodian criticisms of the Kaleckian
model. Metroeconomica. 68(1). pp.185-193.
Skott, P., 2019. Autonomous demand, Harrodian instability and the supply
side. Metroeconomica. 70(2). pp.233-246.
Storm, J., Supriatna, D. and Kaliske, M., 2020. The concept of representative crack elements for
phase‐field fracture: Anisotropic elasticity and thermo‐elasticity. International Journal
for Numerical Methods in Engineering.121(5). pp.779-805.
Wu, Z., Yuan, R. and Tu, J., 2020. Group Decision Making with Transitive Preferences Under
Ordinal and Cardinal Consistencies: An Optimization Approach. Group Decision and
Negotiation, pp.1-30.
Online
[Online]. Available through: Vanessa Page,2020
<https://www.investopedia.com/articles/investing/042915/how-uk-makes-money.asp>
Geoff Riley, 2020 <https://www.tutor2u.net/economics/reference/aggregate-demand-ad>
Daniel Workman, 2020 <http://www.worldstopexports.com/united-kingdoms-top-exports/>
Daniel Workman, 2020 <http://www.worldstopexports.com/united-kingdoms-top-10-imports/>
<>
⊘ This is a preview!⊘
Do you want full access?
Subscribe today to unlock all pages.
Trusted by 1+ million students worldwide
1 out of 12
Related Documents


Your All-in-One AI-Powered Toolkit for Academic Success.
+13062052269
info@desklib.com
Available 24*7 on WhatsApp / Email
![[object Object]](/_next/static/media/star-bottom.7253800d.svg)
Unlock your academic potential
Copyright © 2020–2026 A2Z Services. All Rights Reserved. Developed and managed by ZUCOL.