ACC00152: MicroNet Technology Distribution Channels Evaluation Report

Verified

Added on  2023/03/20

|5
|1269
|57
Report
AI Summary
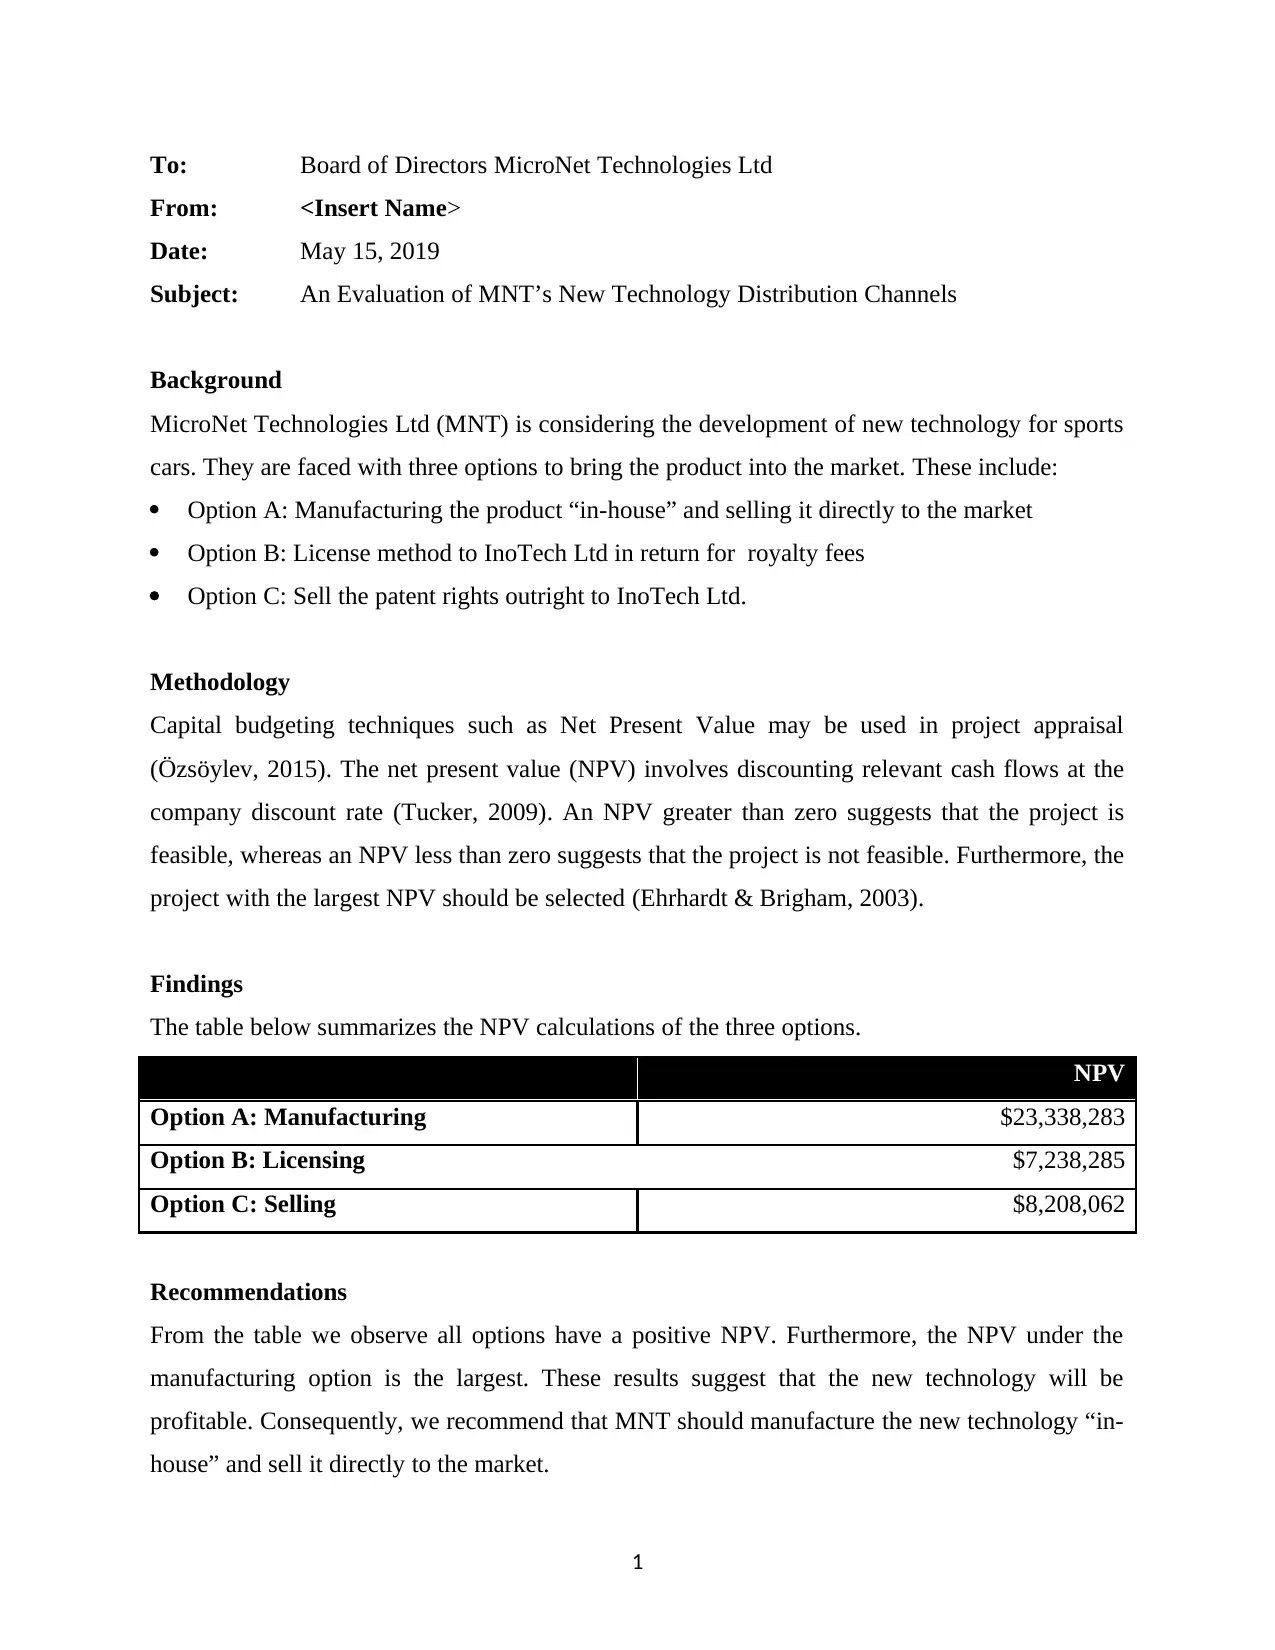
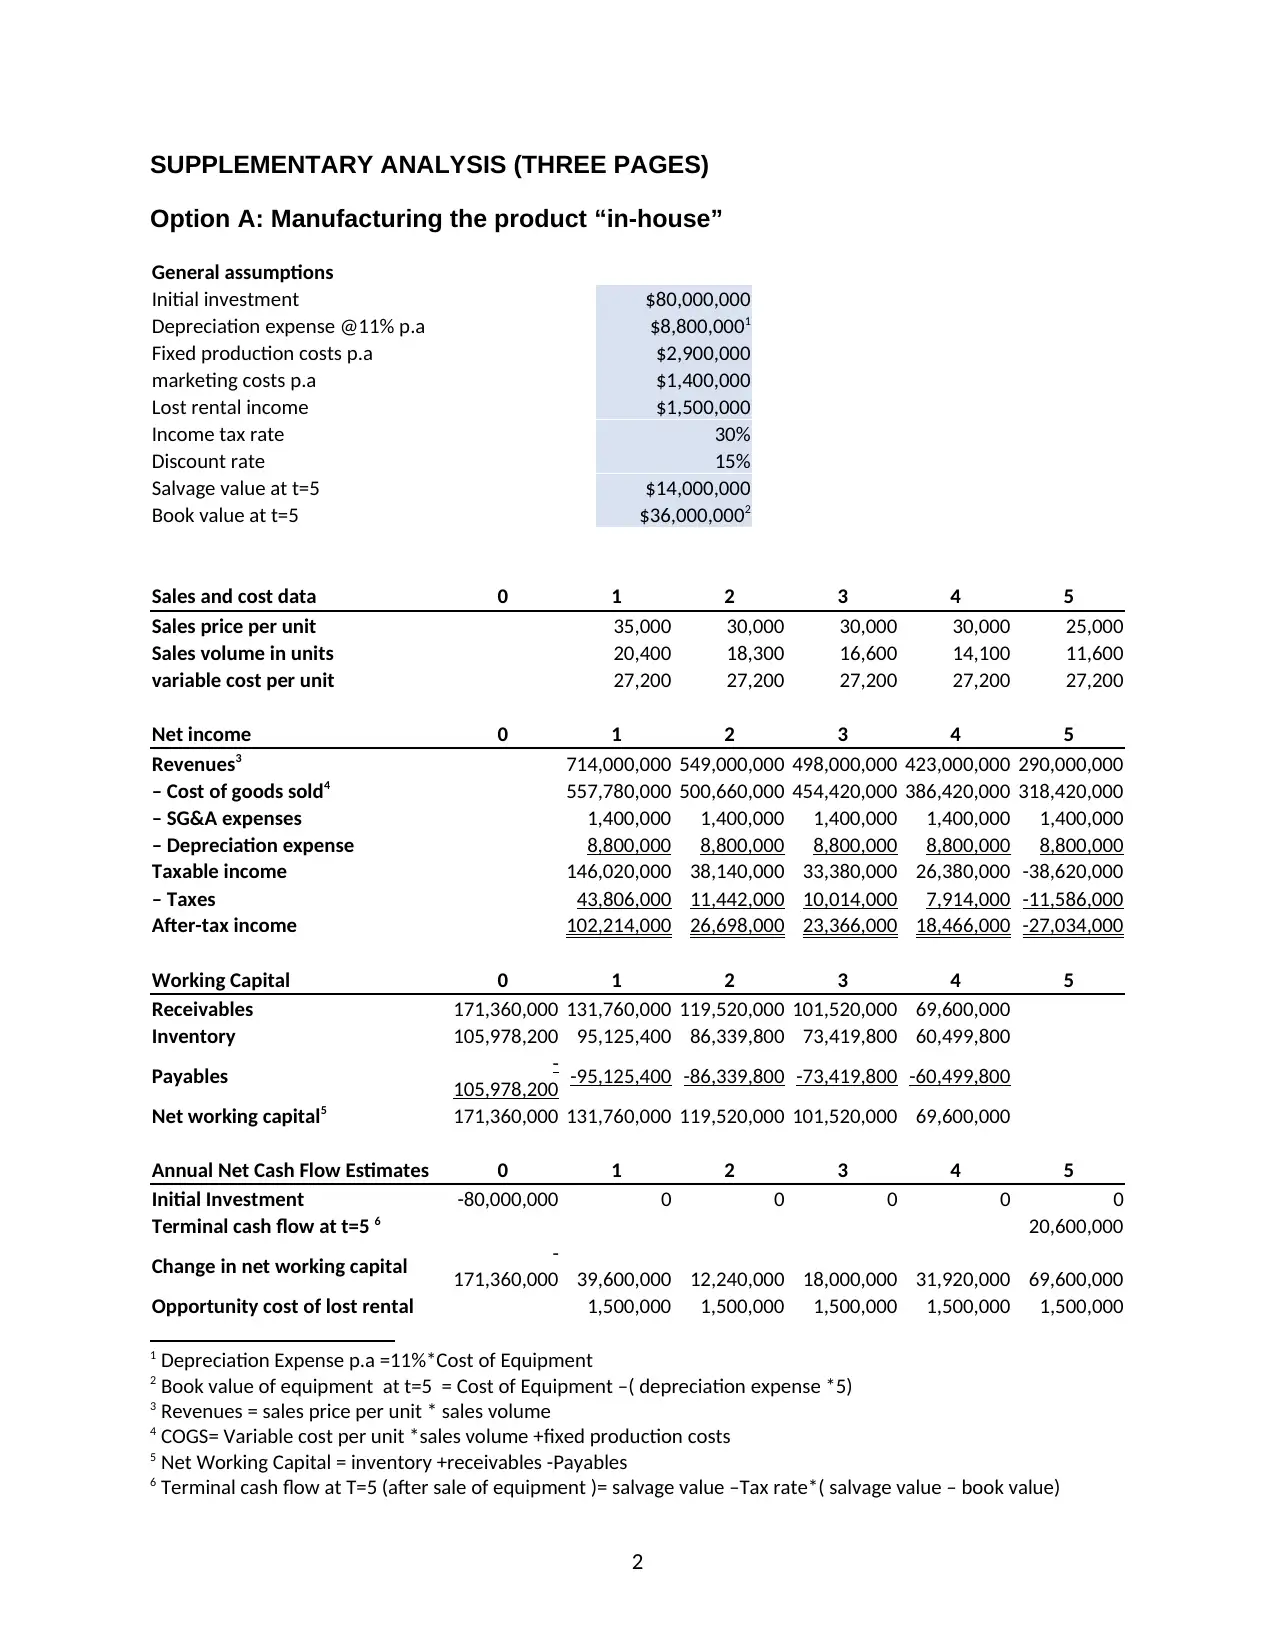
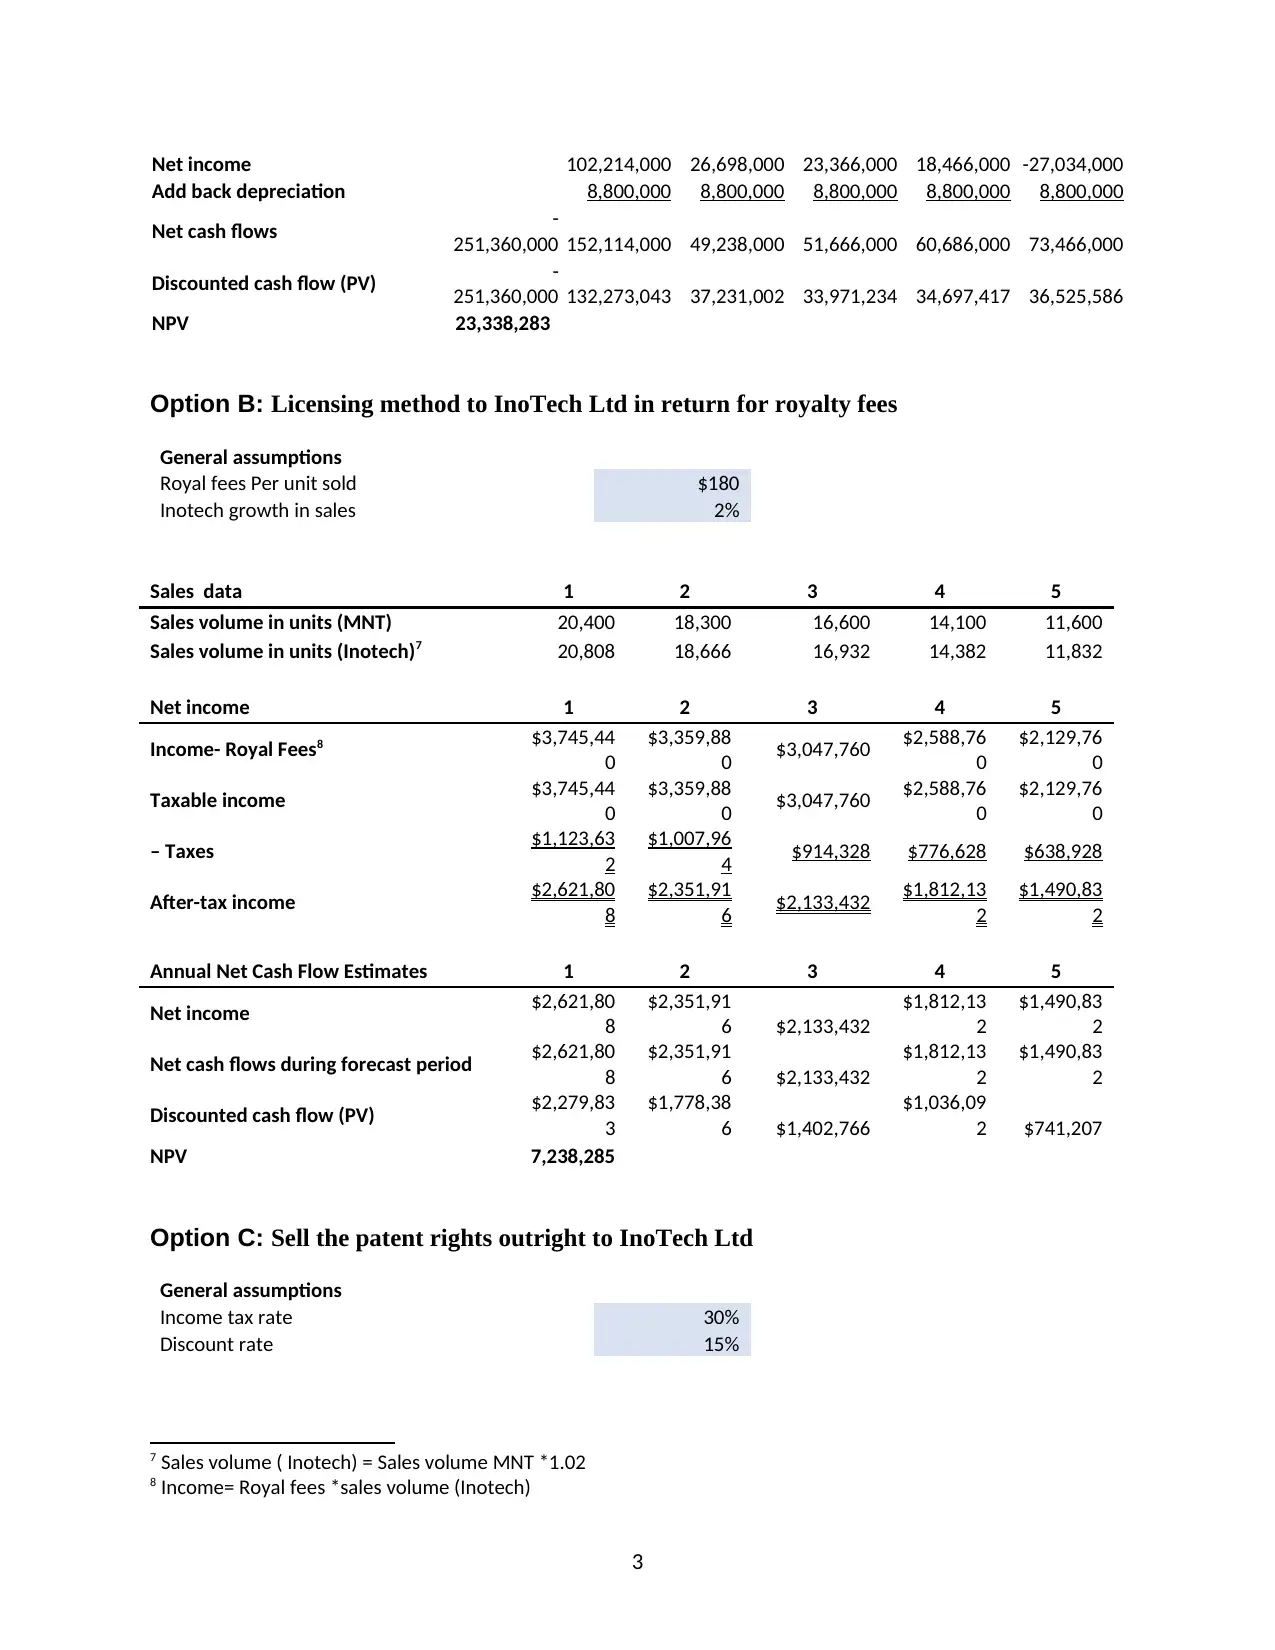
This report evaluates three technology distribution options for MicroNet Technologies Ltd (MNT): in-house manufacturing and direct sales (Option A), licensing to InoTech Ltd (Option B), and selling patent rights to InoTech Ltd (Option C). Using capital budgeting techniques, specifically Net Present Value (NPV), the report analyzes the financial viability of each option. The analysis includes detailed assumptions, sales and cost data, and cash flow estimates, along with supplementary analysis. The findings reveal that all three options have a positive NPV, with Option A (manufacturing) yielding the highest NPV. The report recommends that MNT manufacture the new technology in-house and sell it directly to the market. Furthermore, it suggests that while NPV is a valuable tool, MNT should also consider qualitative factors like competition and conduct sensitivity analysis to assess the impact of key assumptions on the forecasts, mitigating forecasting risks. References include sources on capital budgeting and factors affecting the cost of capital.
Document Page
To: Board of Directors MicroNet Technologies Ltd
From: <Insert Name>
Date: May 15, 2019
Subject: An Evaluation of MNT’s New Technology Distribution Channels
Background
MicroNet Technologies Ltd (MNT) is considering the development of new technology for sports
cars. They are faced with three options to bring the product into the market. These include:
Option A: Manufacturing the product “in-house” and selling it directly to the market
Option B: License method to InoTech Ltd in return for royalty fees
Option C: Sell the patent rights outright to InoTech Ltd.
Methodology
Capital budgeting techniques such as Net Present Value may be used in project appraisal
(Özsöylev, 2015). The net present value (NPV) involves discounting relevant cash flows at the
company discount rate (Tucker, 2009). An NPV greater than zero suggests that the project is
feasible, whereas an NPV less than zero suggests that the project is not feasible. Furthermore, the
project with the largest NPV should be selected (Ehrhardt & Brigham, 2003).
Findings
The table below summarizes the NPV calculations of the three options.
NPV
Option A: Manufacturing $23,338,283
Option B: Licensing $7,238,285
Option C: Selling $8,208,062
Recommendations
From the table we observe all options have a positive NPV. Furthermore, the NPV under the
manufacturing option is the largest. These results suggest that the new technology will be
profitable. Consequently, we recommend that MNT should manufacture the new technology “in-
house” and sell it directly to the market.
1
tabler-icon-diamond-filled.svg

Paraphrase This Document

Need a fresh take? Get an instant paraphrase of this document with our AI Paraphraser
Document Page
SUPPLEMENTARY ANALYSIS (THREE PAGES)
Option A: Manufacturing the product “in-house”
General assumptions
Initial investment $80,000,000
Depreciation expense @11% p.a $8,800,0001
Fixed production costs p.a $2,900,000
marketing costs p.a $1,400,000
Lost rental income $1,500,000
Income tax rate 30%
Discount rate 15%
Salvage value at t=5 $14,000,000
Book value at t=5 $36,000,0002
Sales and cost data 0 1 2 3 4 5
Sales price per unit 35,000 30,000 30,000 30,000 25,000
Sales volume in units 20,400 18,300 16,600 14,100 11,600
variable cost per unit 27,200 27,200 27,200 27,200 27,200
Net income 0 1 2 3 4 5
Revenues3 714,000,000 549,000,000 498,000,000 423,000,000 290,000,000
– Cost of goods sold4 557,780,000 500,660,000 454,420,000 386,420,000 318,420,000
– SG&A expenses 1,400,000 1,400,000 1,400,000 1,400,000 1,400,000
– Depreciation expense 8,800,000 8,800,000 8,800,000 8,800,000 8,800,000
Taxable income 146,020,000 38,140,000 33,380,000 26,380,000 -38,620,000
– Taxes 43,806,000 11,442,000 10,014,000 7,914,000 -11,586,000
After-tax income 102,214,000 26,698,000 23,366,000 18,466,000 -27,034,000
Working Capital 0 1 2 3 4 5
Receivables 171,360,000 131,760,000 119,520,000 101,520,000 69,600,000
Inventory 105,978,200 95,125,400 86,339,800 73,419,800 60,499,800
Payables -
105,978,200 -95,125,400 -86,339,800 -73,419,800 -60,499,800
Net working capital5 171,360,000 131,760,000 119,520,000 101,520,000 69,600,000
Annual Net Cash Flow Estimates 0 1 2 3 4 5
Initial Investment -80,000,000 0 0 0 0 0
Terminal cash flow at t=5 6 20,600,000
Change in net working capital -
171,360,000 39,600,000 12,240,000 18,000,000 31,920,000 69,600,000
Opportunity cost of lost rental 1,500,000 1,500,000 1,500,000 1,500,000 1,500,000
1 Depreciation Expense p.a =11%*Cost of Equipment
2 Book value of equipment at t=5 = Cost of Equipment –( depreciation expense *5)
3 Revenues = sales price per unit * sales volume
4 COGS= Variable cost per unit *sales volume +fixed production costs
5 Net Working Capital = inventory +receivables -Payables
6 Terminal cash flow at T=5 (after sale of equipment )= salvage value –Tax rate*( salvage value – book value)
2
Document Page
Net income 102,214,000 26,698,000 23,366,000 18,466,000 -27,034,000
Add back depreciation 8,800,000 8,800,000 8,800,000 8,800,000 8,800,000
Net cash flows -
251,360,000 152,114,000 49,238,000 51,666,000 60,686,000 73,466,000
Discounted cash flow (PV) -
251,360,000 132,273,043 37,231,002 33,971,234 34,697,417 36,525,586
NPV 23,338,283
Option B: Licensing method to InoTech Ltd in return for royalty fees
General assumptions
Royal fees Per unit sold $180
Inotech growth in sales 2%
Sales data 1 2 3 4 5
Sales volume in units (MNT) 20,400 18,300 16,600 14,100 11,600
Sales volume in units (Inotech)7 20,808 18,666 16,932 14,382 11,832
Net income 1 2 3 4 5
Income- Royal Fees8 $3,745,44
0
$3,359,88
0 $3,047,760 $2,588,76
0
$2,129,76
0
Taxable income $3,745,44
0
$3,359,88
0 $3,047,760 $2,588,76
0
$2,129,76
0
– Taxes $1,123,63
2
$1,007,96
4 $914,328 $776,628 $638,928
After-tax income $2,621,80
8
$2,351,91
6 $2,133,432 $1,812,13
2
$1,490,83
2
Annual Net Cash Flow Estimates 1 2 3 4 5
Net income $2,621,80
8
$2,351,91
6 $2,133,432
$1,812,13
2
$1,490,83
2
Net cash flows during forecast period $2,621,80
8
$2,351,91
6 $2,133,432
$1,812,13
2
$1,490,83
2
Discounted cash flow (PV) $2,279,83
3
$1,778,38
6 $1,402,766
$1,036,09
2 $741,207
NPV 7,238,285
Option C: Sell the patent rights outright to InoTech Ltd
General assumptions
Income tax rate 30%
Discount rate 15%
7 Sales volume ( Inotech) = Sales volume MNT *1.02
8 Income= Royal fees *sales volume (Inotech)
3
Document Page
Annual Net Cash Flow Estimates 0 1 2 3 4
Incremental cash flow9 $2,500,000 $2,500,000 $2,500,000 $2,500,000
Net cash flows during forecast period $2,500,000 $2,500,000 $2,500,000 $2,500,000
Discounted cash flow (PV) $2,500,000 $2,173,913 $1,890,359 $1,643,791
NPV 8,208,062.79
Other Assumptions - Irrelevant Cash flows
The following cash flows were considered sunk costs and therefore were not relevant to the cash
flow analysis under all three options.
Research and Development costs of $2.7 million
Payment of $800,000 to external consultant for a production plan and demand analysis.
From the analysis, we observe all options have a positive NPV. These values tells us that the
selling the new technology, regardless of distribution, will be profitable for the next five years.
Therefore, MNT should invest in the project. Furthermore, the NPV under the manufacturing
option is the largest. Hence, manufacturing and selling the product in-house will be the most
profitable option to MNT.
Nonetheless, during capital budgeting, NPV should not be used alone in isolation MNT should
also consider other qualitative techniques like competition, as well as the effects on their key
assumptions on the forecasts ( sensitivity analysis). Forecasting risks occur as a result of errors in
projections (Efinance, 2019). Sensitivity analysis can reduce forecasting risks and assist
companies to determine the effects of their key assumptions during project appraisals.
References
EduPristine , 2018. Capital Budgeting: Techniques & Importance. [Online]
Available at: https://www.edupristine.com/blog/capital-budgeting-techniques
Efinance, 2019. Factors Affecting Cost of Capital. [Online]
Available at: https://efinancemanagement.com/investment-decisions/factors-affecting-cost-of-capital
Ehrhardt, M. & Brigham, E., 2003. Corporate Finance: A Focused Approach. s.l.:Thomson/South-Western.
Özsöylev, H., 2015. Mechanics of Capital Budgeting. Instanbul: s.n.
9 Annual Cash flows = 10,000,000/4
4
tabler-icon-diamond-filled.svg

Paraphrase This Document

Need a fresh take? Get an instant paraphrase of this document with our AI Paraphraser
Document Page
Tucker, J., 2009. How to set the hurdle rate for capital investments. [Online]
Available at: https://www.eprints.uwe.ac.uk/11334/1/Tucker_2009_QFinance_book_chapter.doc
5
chevron_up_icon
1 out of 5
circle_padding
hide_on_mobile
zoom_out_icon
[object Object]