Microeconomics Report: Impact of Tax on Sugary Drinks in Australia

Verified

Added on  2021/06/18

|8
|1409
|95
Report
AI Summary
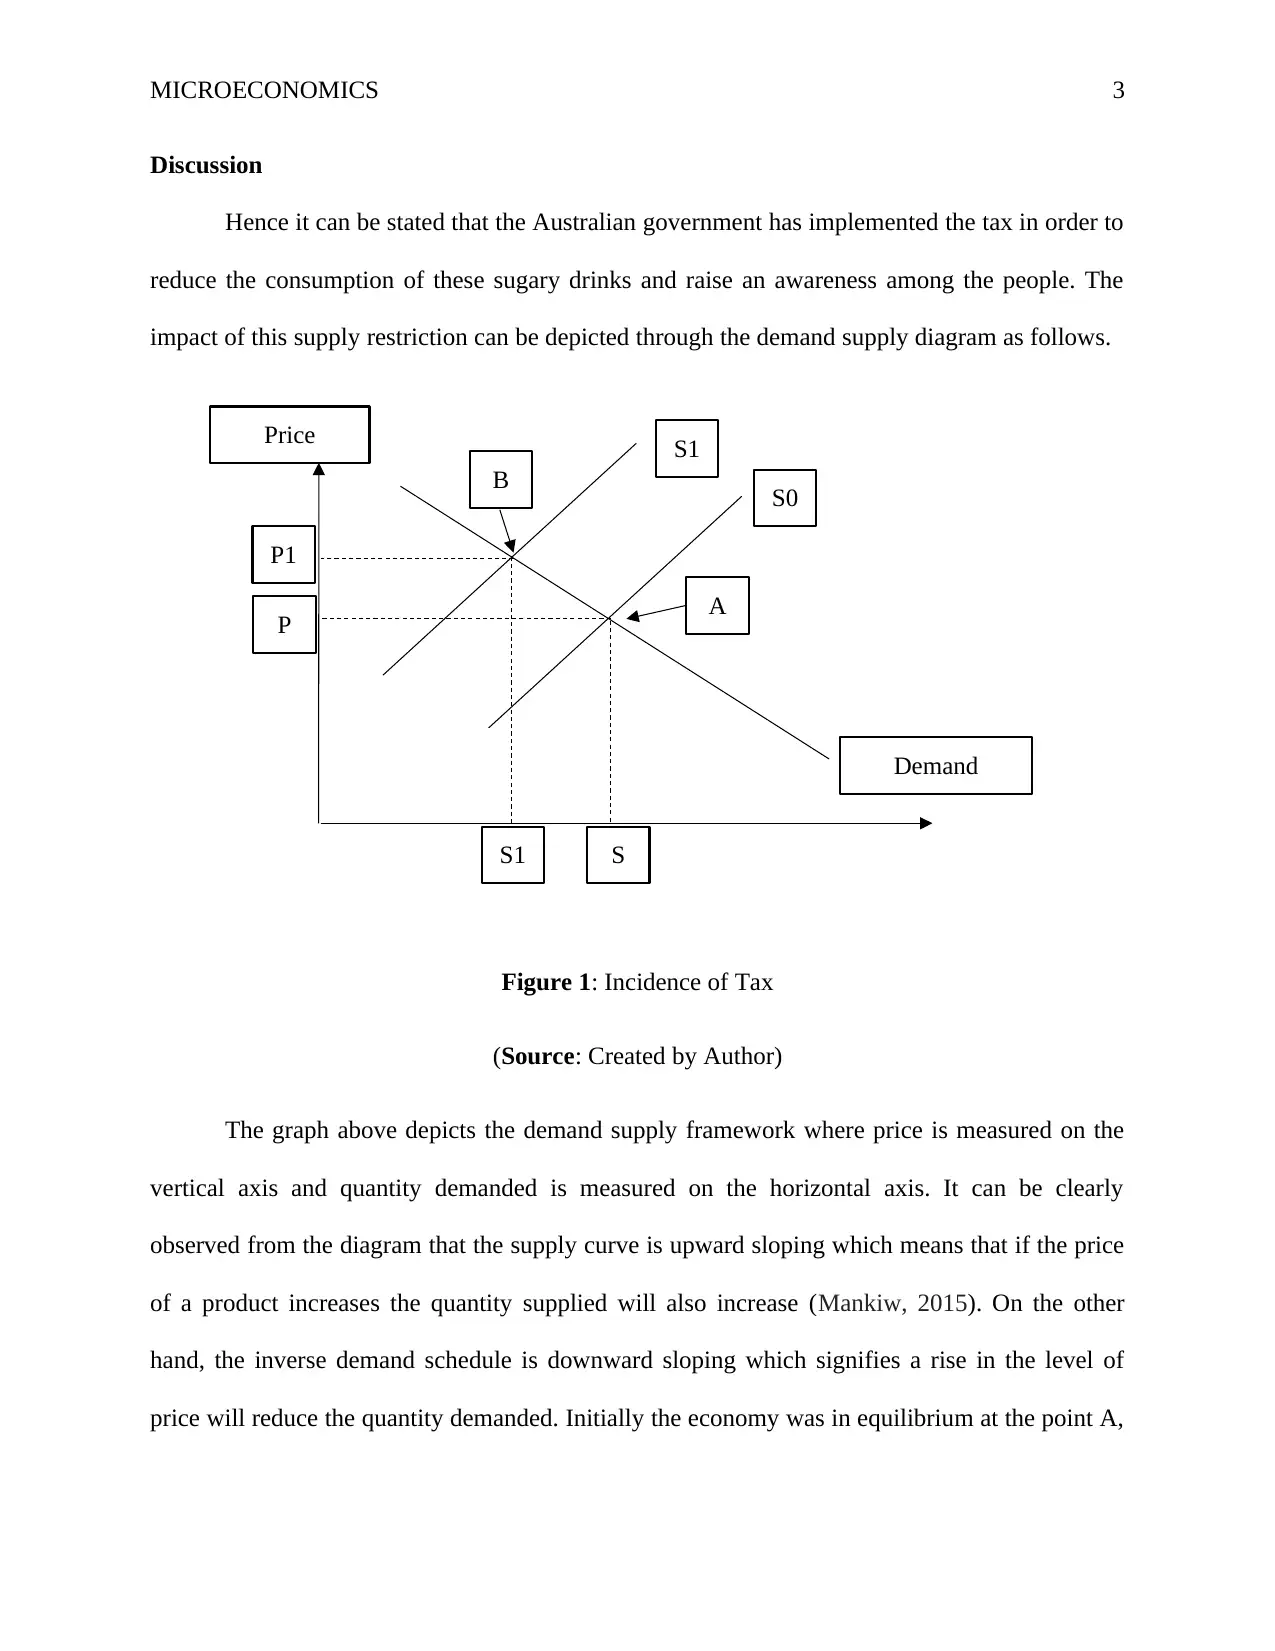
This microeconomics report analyzes the impact of the Australian government's tax on sugary drinks, examining its effects through a supply-demand framework. The report discusses how the tax affects producers and consumers, considering the elasticity of supply and demand. It explains how the tax burden is shared between market participants and the resulting deadweight loss. Furthermore, the report explores the implications of the tax on income inequality within the Australian economy, highlighting the disproportionate impact on low-income groups. It concludes by summarizing the economic concepts of taxation and income inequality in the context of the provided article, emphasizing the unequal distribution of the tax burden and its contribution to income disparities. The report uses diagrams to illustrate its points and cites relevant economic literature.
Document Page
Running head: MICROECONOMICS
Microeconomics
Name of the Student:
Name of the University:
Author’s Note:
tabler-icon-diamond-filled.svg

Paraphrase This Document

Need a fresh take? Get an instant paraphrase of this document with our AI Paraphraser
Document Page
MICROECONOMICS 1
Table of Contents
Introduction......................................................................................................................................2
Discussion........................................................................................................................................2
Conclusion.......................................................................................................................................5
Reference List..................................................................................................................................6
Document Page
MICROECONOMICS 2
Introduction
The traditional economic concepts make an attempt to explain certain economic concepts
with the help of simple supply-demand framework. In the context of the given scenario of the
Australian government imposing a tax over the sugary drinks the concept of controlling supply
will be explained with the help of demand supply model. Primarily UK announced a tax on soft
drinks and soon after that the Australian government also declared that they are going to tax the
sugary drinks. However, the UK stated that this taxation is mainly because providing their youth
a healthy lifestyle and the revenue which the government will accrue would be spent on kid’s
sports activities. It has been observed that Australian people happily pay these sort of sin tax.
People of the country have already accepted a higher level of tax on fuel, alcohol and cigarettes.
This new tax may affect the sugar industry of Australia but the cane growers of Queensland are
less likely to be affected as they export their products and as a result the local tax will not affect
them.
The two issues which can be found in this article are the,
Impact of taxation on the supply curve of the producers
Increase in income inequality due to the incidence of a tax
These two concepts will be linked with the following learning outcomes,
See how supply and demand together set the price of a good and the quantity sold
Learn the meaning of the elasticity of supply
Learn the meaning of the elasticity of demand
Document Page
S1
Price
P1
Demand
A
B S0
SS1
P
MICROECONOMICS 3
Discussion
Hence it can be stated that the Australian government has implemented the tax in order to
reduce the consumption of these sugary drinks and raise an awareness among the people. The
impact of this supply restriction can be depicted through the demand supply diagram as follows.
Figure 1: Incidence of Tax
(Source: Created by Author)
The graph above depicts the demand supply framework where price is measured on the
vertical axis and quantity demanded is measured on the horizontal axis. It can be clearly
observed from the diagram that the supply curve is upward sloping which means that if the price
of a product increases the quantity supplied will also increase (Mankiw, 2015). On the other
hand, the inverse demand schedule is downward sloping which signifies a rise in the level of
price will reduce the quantity demanded. Initially the economy was in equilibrium at the point A,
tabler-icon-diamond-filled.svg

Paraphrase This Document

Need a fresh take? Get an instant paraphrase of this document with our AI Paraphraser
Document Page
MICROECONOMICS 4
where the demand curve intersects the supply curve. At this point the equilibrium quantity
supplied is S at the equilibrium price P (Baumol & Blinder, 2015).
The tax authorities generally need either the buyer or the seller to share the burden of the
tax legally. The incidence of tax is the process through which the tax burden is shared between
the market participants. Taxes will certainly impose a greater burden over the party having the
more inelastic curve. For instance if the supply curve is inelastic and the demand curve is elastic
then the tax burden will be higher for the suppliers (Pindyck & Rubinfeld, 2014).
Now as the Australian government imposes a tax on the sugary drinks the tax burden will
be higher on the producers this is because they cannot produce an alternative commodity and
will be needed to accept a lower price (Moulin, 2014). The burden will be lower on the part of
the consumers as they can find alternative to the sugary drinks, for instance they can opt for fruit
juices as well. Hence the supply curve will shift upwards to the left and the economy will be in
equilibrium at the point B. At this new equilibrium point the increased price will be P1 and the
equilibrium quantity supplied will be S1. This taxation will lead to a deadweight loss for the
economy which will occur because of the lack of mutually beneficial exchanges between the
buyers and the sellers.
The second economic concept which can be discussed in relation to this article is income
inequality. Income inequality is defined as the unequal distribution of the income of the
households or individuals among the other economic players (Nicholson & Snyder, 2014).
Income inequality is often represented as a percentage of income in comparison to the percentage
of the population.
Document Page
MICROECONOMICS 5
Income inequality is sometimes regarded as the economic fairness of income. Most of the
people consider inequality as unfair while the rich possesses a disproportionately larger
proportion of the country’s income in comparison to the general population of the country.
Researchers have identified the causes behind this income inequality. They have pointed out that
gender, level of education and social status may act as the key reasons behind economic
inequality. The emergence of income inequality became evidently visible during the 1980s and at
that point of time almost 30% to 35% of the national income of the country was controlled by the
10% of the top earners of the country (Friedman, 2017). Due to this unequal distribution there
arises a disparity among the high earners and low earners. Due to the imposition of tax on the
sugary drinks the inequality within the Australian economy will become more evident. The
economists have stated that the people who are belonging to the high income group are less
likely to be affected by the imposition of this tax. This is because they are already paying sin
taxes for cigarettes and alcoholic beverages, a rise in the price level of these sugary drinks will
not affect them much (Boland, 2014). However, the low income groups will face difficulties as
with lower income it would become difficult for them to pay even a little higher price also.
Hence, this taxation would reflect the difference between the purchasing power of these two
groups of individuals and thereby give rise to inequality.
Conclusion
On a concluding note it can be stated that the assignment has successfully described the
economic concepts of taxation and income inequality in the context of the article provided. It has
been observed that the imposition of tax will affect the suppliers as they have more inelastic
supply curve in comparison to the elastic demand curve of the consumers. On the other hand, this
will also give rise to the income inequality as the low income population will not be able to
Document Page
MICROECONOMICS 6
purchase the drinks even if they do then they will have to pay a higher price which will affect
their overall budget (Varian, 2014). On the contrary the people belonging to the high income
group will not be affect as they will pay a marginally higher price.
tabler-icon-diamond-filled.svg

Paraphrase This Document

Need a fresh take? Get an instant paraphrase of this document with our AI Paraphraser
Document Page
MICROECONOMICS 7
Reference List
Baumol, W. J., & Blinder, A. S. (2015). Microeconomics: Principles and policy. Cengage
Learning.
Boland, L. A. (2014). Methodology for a New Microeconomics (Routledge Revivals): The
Critical Foundations. Routledge.
Friedman, L. S. (2017). The microeconomics of public policy analysis. Princeton University
Press.
Mankiw, N. G. (2015). Principles of Microeconomics, Cengage Learning. Stamford, CT, 213.
Moulin, H. (2014). Cooperative microeconomics: a game-theoretic introduction. Princeton
University Press.
Nicholson, W., & Snyder, C. M. (2014). Intermediate microeconomics and its application.
Cengage Learning.
Pindyck, R. S., & Rubinfeld, D. L. (2014). Microeconomics. Pearson.
Varian, H. R. (2014). Intermediate Microeconomics: A Modern Approach: Ninth International
Student Edition. WW Norton & Company.
chevron_up_icon
1 out of 8
circle_padding
hide_on_mobile
zoom_out_icon
[object Object]