Microeconomics 12: Analysis of Production, Taxes, and Disasters
VerifiedAdded on 2021/05/31
|12
|1939
|118
Homework Assignment
AI Summary
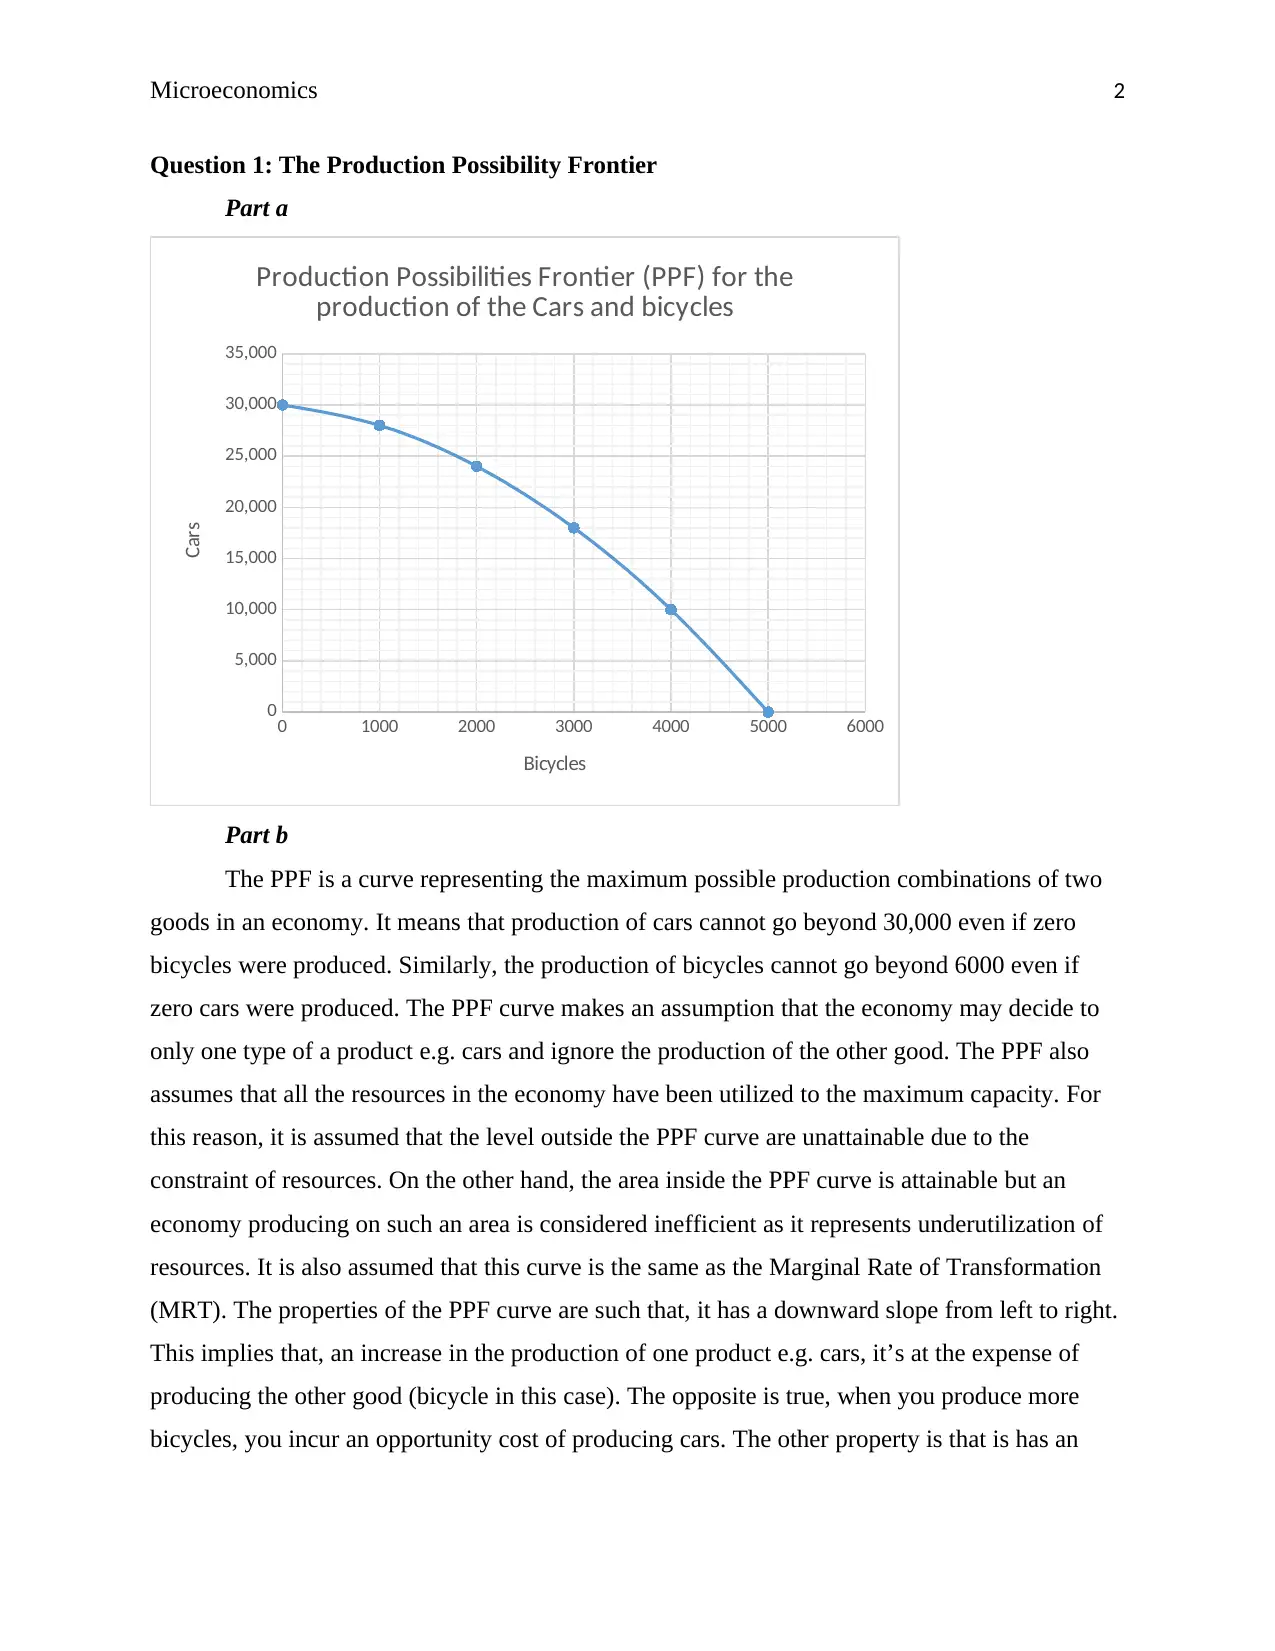
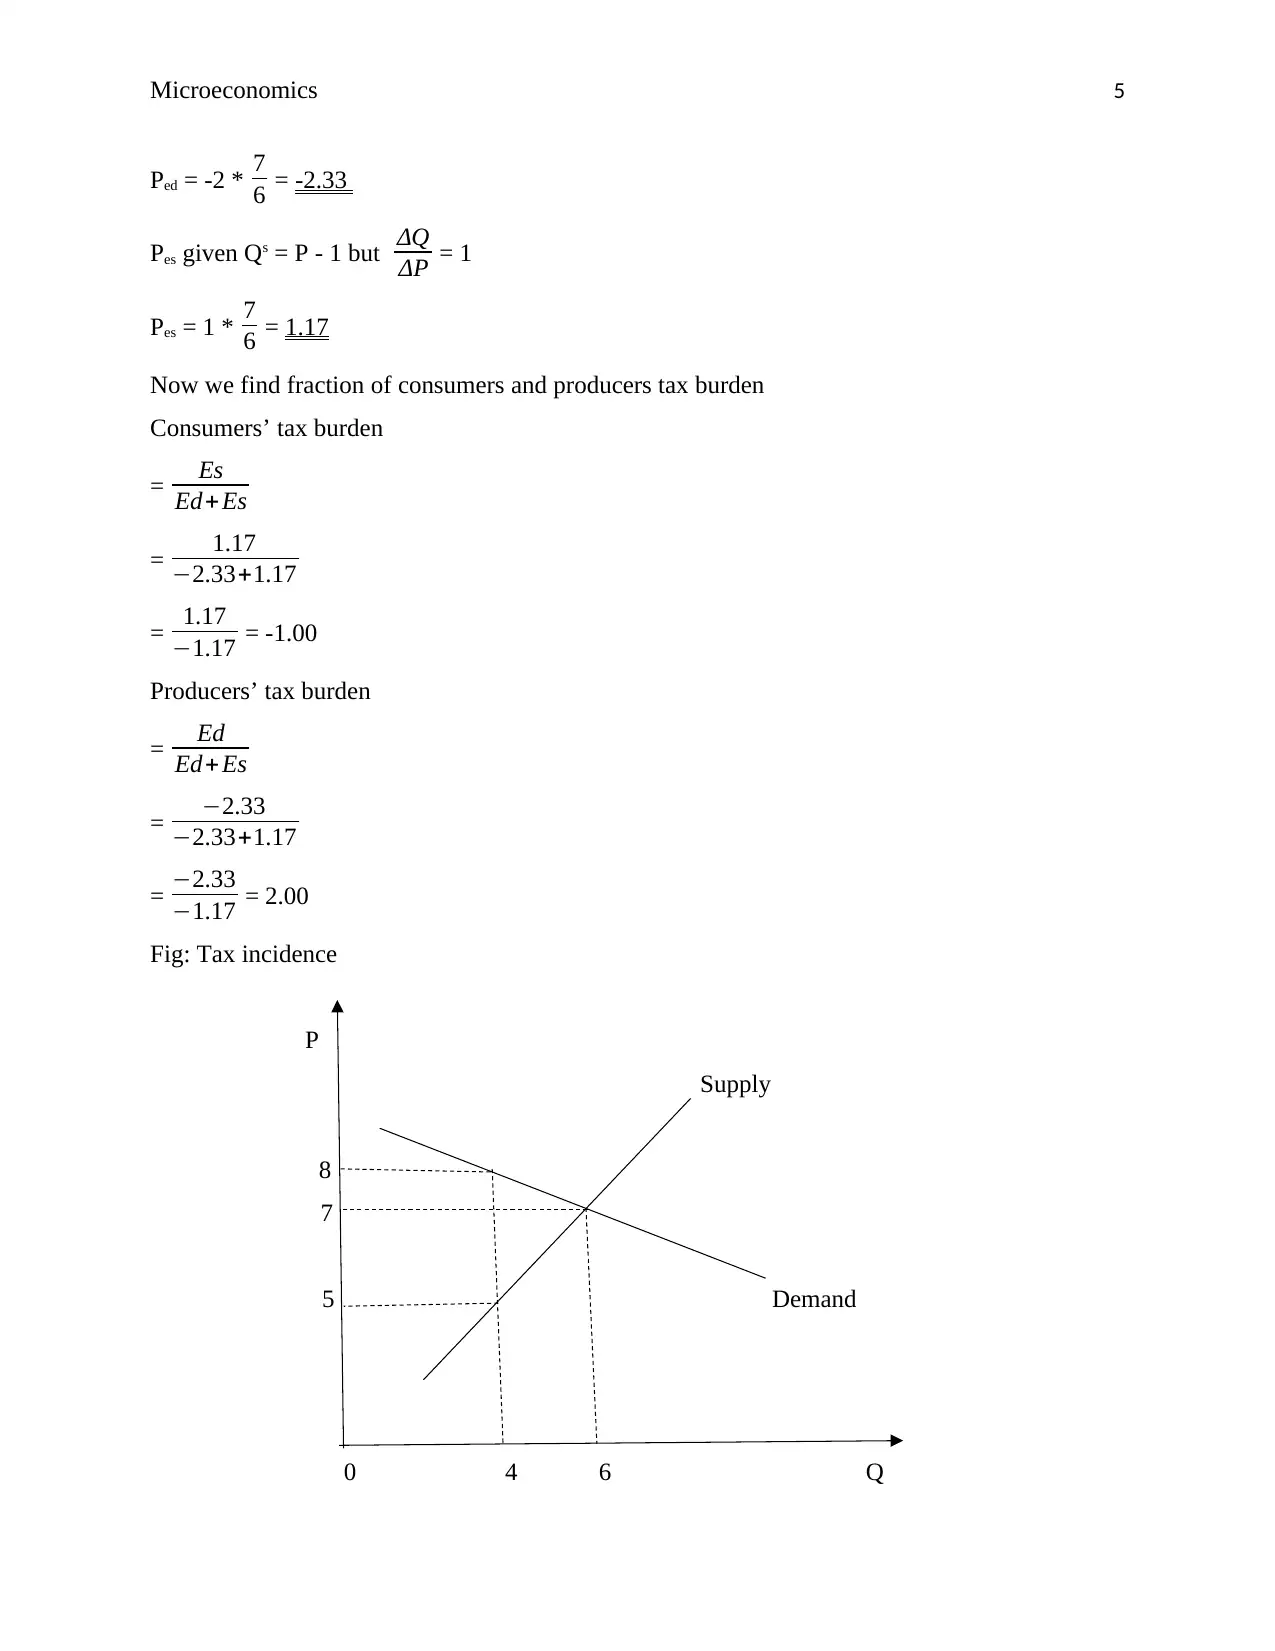
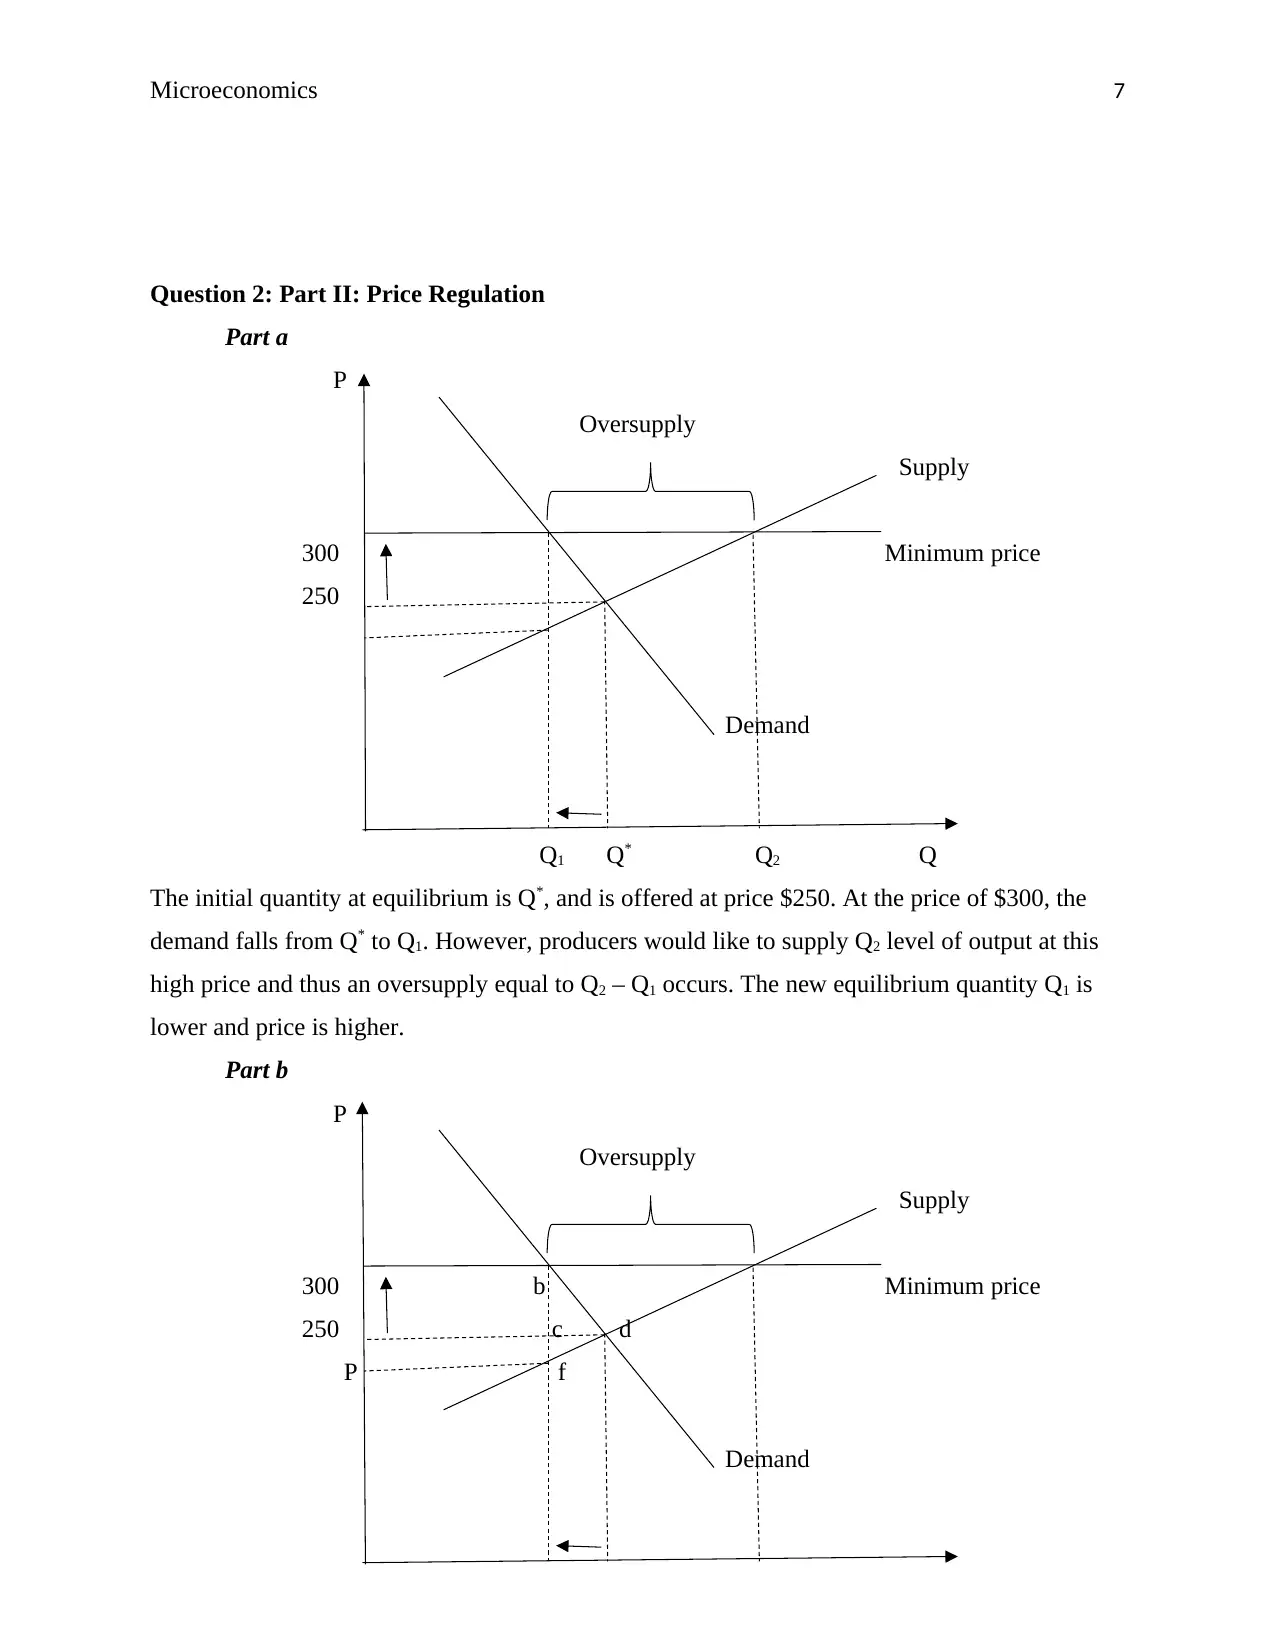
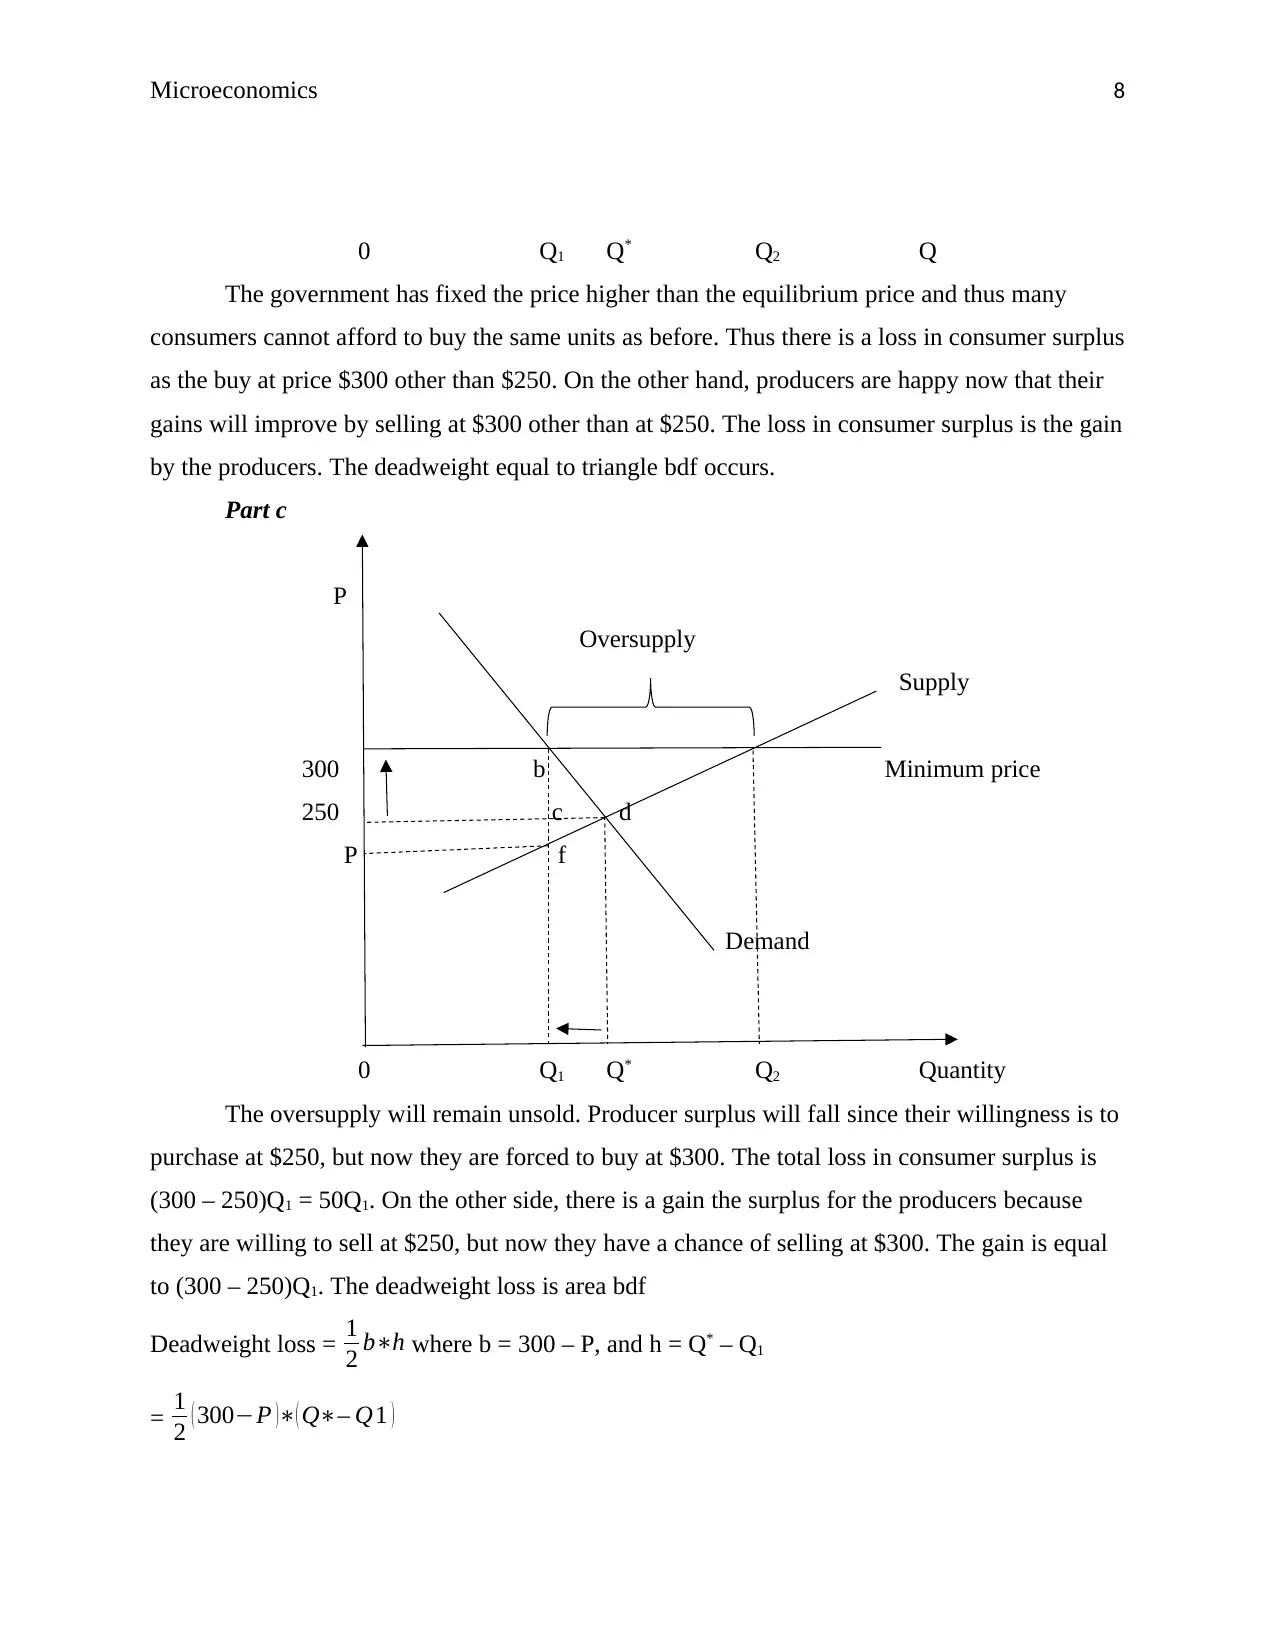
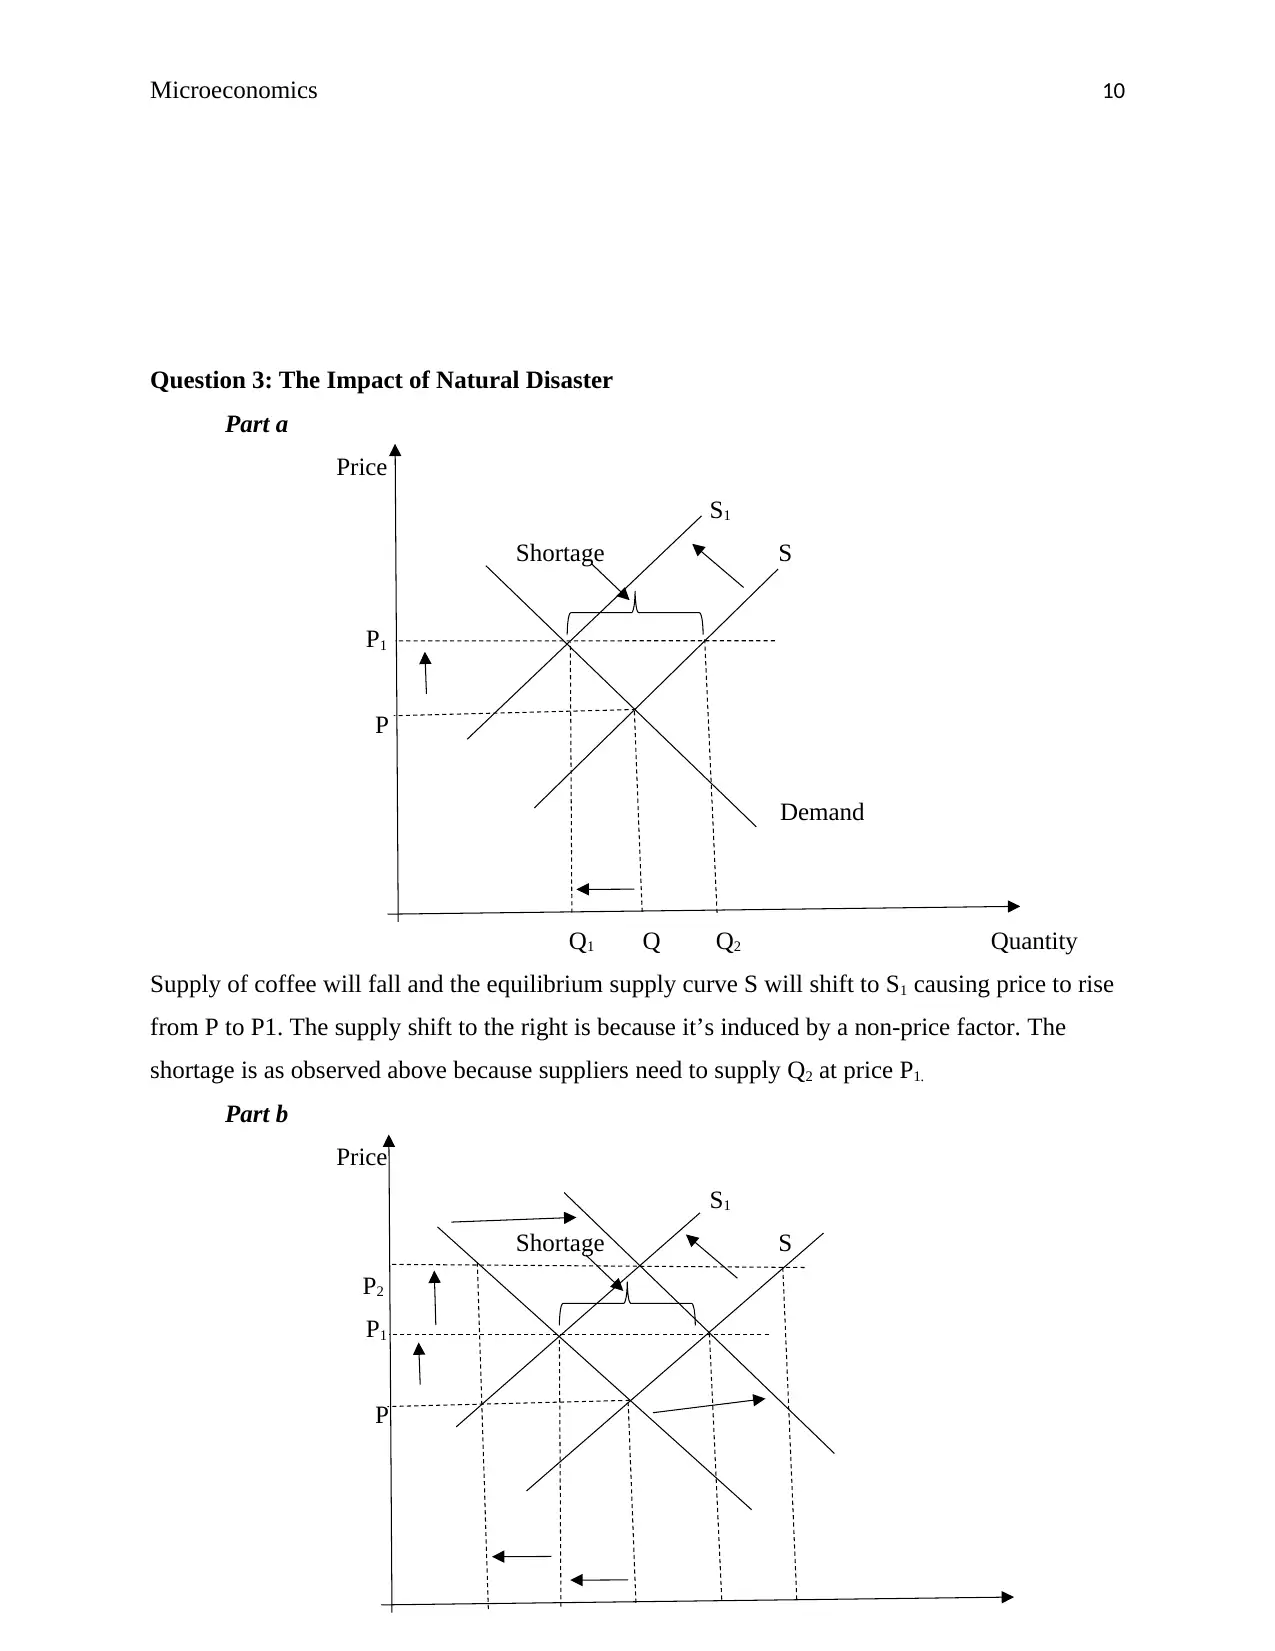
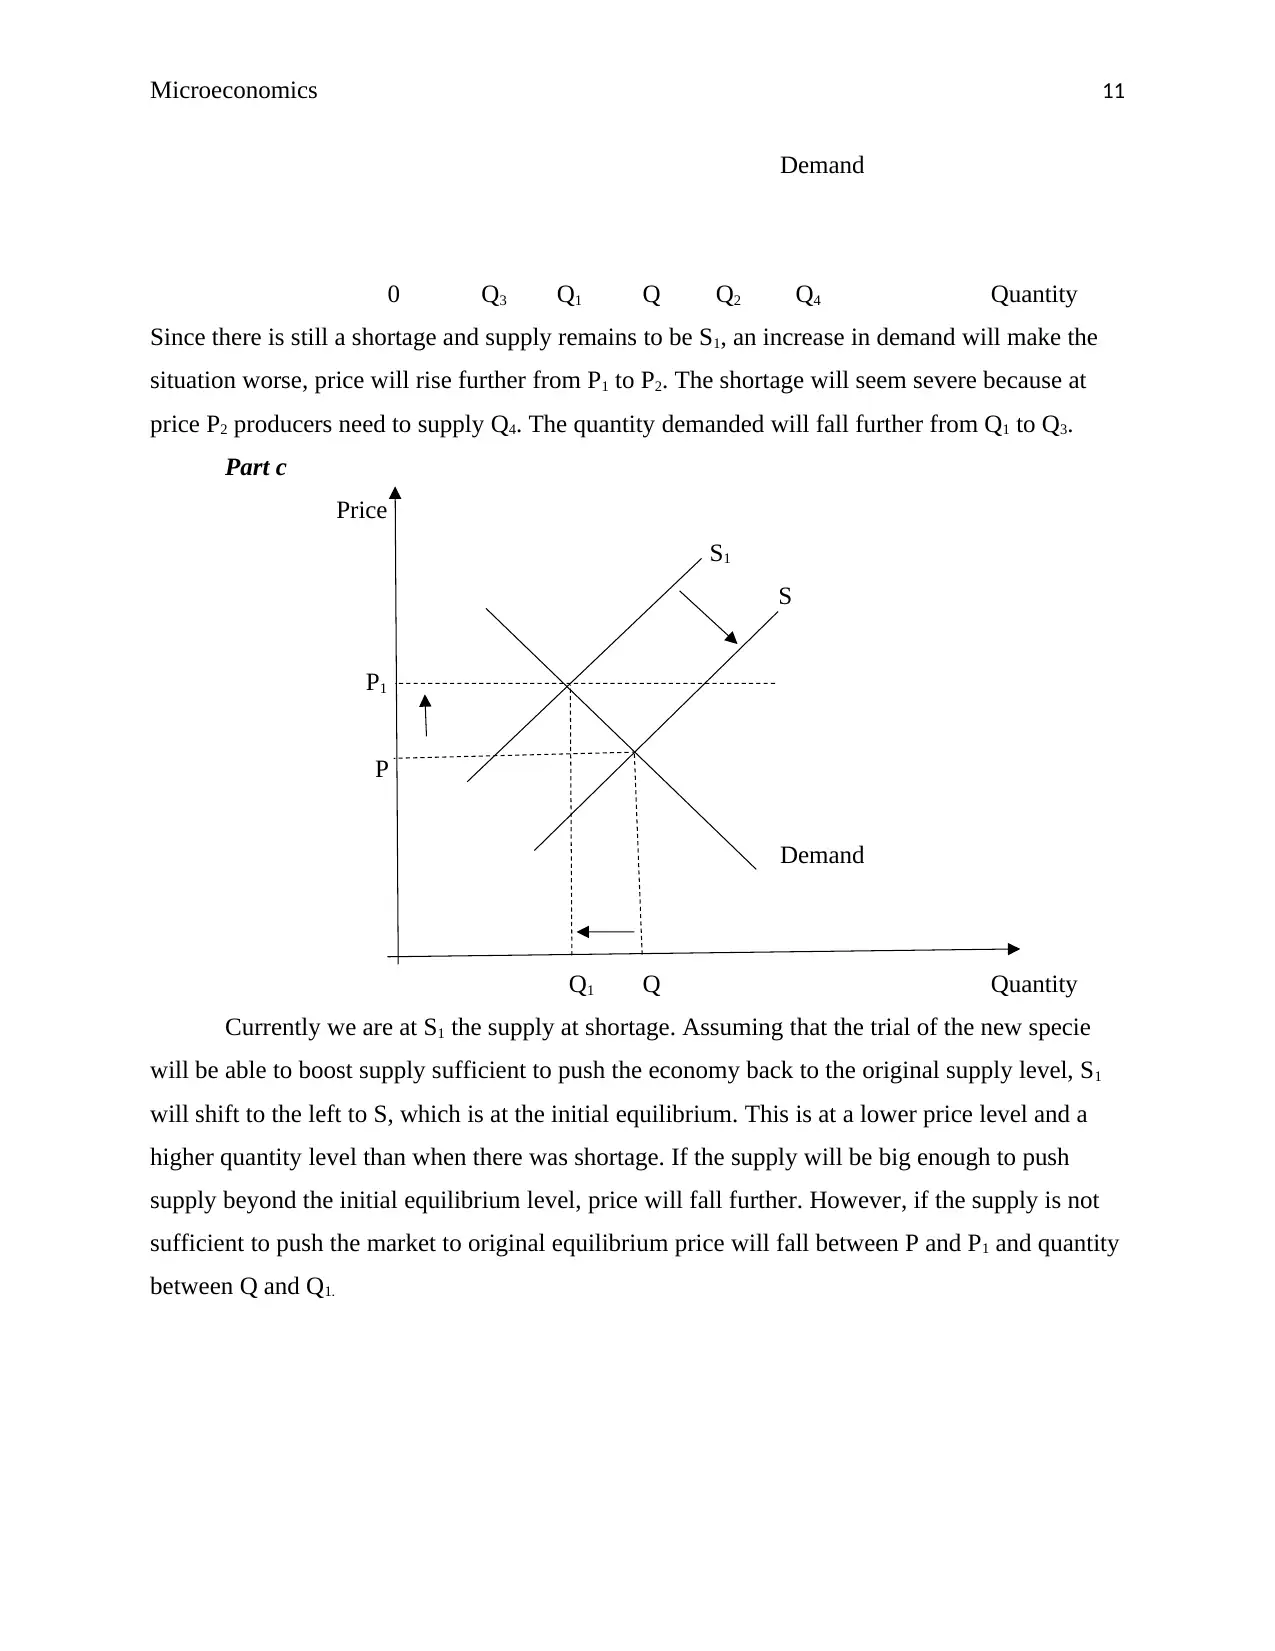
This microeconomics assignment analyzes several key economic concepts. The first question explores the Production Possibility Frontier (PPF), discussing its properties, attainable and unattainable combinations, and opportunity costs. The second question delves into tax incidence, calculating equilibr...
Read More
Contribute Materials
Your contribution can guide someone’s learning journey. Share your
documents today.

Running Head: Microeconomics
Microeconomic Analysis
By (Name)
Student ID
(Tutor)
(University)
(Date)
Microeconomic Analysis
By (Name)
Student ID
(Tutor)
(University)
(Date)
Secure Best Marks with AI Grader
Need help grading? Try our AI Grader for instant feedback on your assignments.

Microeconomics 2
Question 1: The Production Possibility Frontier
Part a
0 1000 2000 3000 4000 5000 6000
0
5,000
10,000
15,000
20,000
25,000
30,000
35,000
Production Possibilities Frontier (PPF) for the
production of the Cars and bicycles
Bicycles
Cars
Part b
The PPF is a curve representing the maximum possible production combinations of two
goods in an economy. It means that production of cars cannot go beyond 30,000 even if zero
bicycles were produced. Similarly, the production of bicycles cannot go beyond 6000 even if
zero cars were produced. The PPF curve makes an assumption that the economy may decide to
only one type of a product e.g. cars and ignore the production of the other good. The PPF also
assumes that all the resources in the economy have been utilized to the maximum capacity. For
this reason, it is assumed that the level outside the PPF curve are unattainable due to the
constraint of resources. On the other hand, the area inside the PPF curve is attainable but an
economy producing on such an area is considered inefficient as it represents underutilization of
resources. It is also assumed that this curve is the same as the Marginal Rate of Transformation
(MRT). The properties of the PPF curve are such that, it has a downward slope from left to right.
This implies that, an increase in the production of one product e.g. cars, it’s at the expense of
producing the other good (bicycle in this case). The opposite is true, when you produce more
bicycles, you incur an opportunity cost of producing cars. The other property is that is has an

Microeconomics 3
increasing slope given its concavity to the origin. Lastly, all the points of combination along the
PPF curve are considered to be efficient.
Part c
The first thing is to accept the fact that this combination is not attainable as it lies outside
the PPF. This is the assumption that resources are scarce and that they have been utilized fully at
the point of PPF curve. There are two possible combinations that can take place in this case. One,
increase the production of cars from 18,000 to 20,000 but this would result in the production of
bicycles falling from 3,000 to 2,700. The second combination would be to raise the number of
bicycles production from 3,000 to 4,000 but this would cause the demand for cars to fall from
18,000 to 10,000. The solution would be to consider the opportunity cost of increasing the
production of the other good and produce that with the lowest opportunity cost. If 4000 bicycles
are produced, the production for cars declines by 8,000. However if 20,000 cars are produced,
the production for bicycles declines by 300. The opportunity cost of producing bicycles is very
high than that of cars production and thus it’s more efficient to produce 20,000 cars and 2700
bicycles. By producing Cars to avoid the high opportunity cost, Newland can import 1300 units
of bicycles to meet the demand for bicycles also.
The second possible way is to increment in productive resources. This will raise the
productivity capacity and the PPF will shift outward accommodating the increase in demand for
both goods1. The third possibility is to improve technology; for Newland to meet both demands,
it should find cheaper ways of production such that the current resources can be able to produce
more of these products; the PPF will shift outwards.
1 Adam Hayes, Economics Basics: Production Possibility Frontier, Growth, Opportunity Cost and Trade.
(Investopedia, 2018).

Microeconomics 4
Question 2: Part I: Tax Incidence
QD = 20 - 2p
Qs = P – 1
At equilibrium, QD= Qs
The imposition of $3 per Pizza is per unit tax
The price change will rise by the amount of tax, however, the rise will not be $3 above
the equilibrium price. Tax incidence tells how much tax burden is borne by consumers and that
borne by the producers. The elasticity of demand determines the tax incidence. When a product
has an elastic demand, the highest tax burden lies on the producers and a small proportion is
shifted to the consumers. Similarly, when a product has an inelastic demand, the highest tax
burden lies on the consumers, and producers only carry a small proportion of the burden2. The
price will rise by $3 above equilibrium price only if the producer is able to shift the tax burden
100% to the consumers. Deadweight will result since there will be a loss in both surplus for the
producer and for the consumer.
We start by calculating equilibrium P and Q
QD= Qs
20 - 2p = P – 1
21 = 3P
P = 7
Since QD= Qs, Q = either QDor Qs
Take Qs = P -1 = Q
But P = 7, therefore Q = 7 – 1 = 6
Q = 6
Now we calculate the elasticity of demand (Ped) and supply (Pes) to price changes given by the
formula
ΔQ
ΔP ∗P
Q
When P = 7 and Q = 6
Ped given QD = 20 - 2p but ΔQ
ΔP = -2
2 Adam Gifford, Tax Incidence: Definition, Formula & Example. (Studycom, 2018).
Secure Best Marks with AI Grader
Need help grading? Try our AI Grader for instant feedback on your assignments.

Microeconomics 5
Ped = -2 * 7
6 = -2.33
Pes given Qs = P - 1 but ΔQ
ΔP = 1
Pes = 1 * 7
6 = 1.17
Now we find fraction of consumers and producers tax burden
Consumers’ tax burden
= Es
Ed+ Es
= 1.17
−2.33+1.17
= 1.17
−1.17 = -1.00
Producers’ tax burden
= Ed
Ed+ Es
= −2.33
−2.33+1.17
= −2.33
−1.17 = 2.00
Fig: Tax incidence
P
Supply
8
7
5 Demand
0 4 6 Q

Microeconomics 6
When price is $ 8, given Qd = 20 – 2P = Q, Q = 20 – 2(8), Q = 4.
Incidence of tax on consumers
= ΔP * new Q
= (8 – 7)4 = $4
Incidence of tax on producers
= ΔP * new Q
= (7 – 5)4 = $8
Deadweight
= 1
2 b∗h where b = 8 – 5 = 3, and h = 6 – 4 = 2
= 1
2 (3)∗2 = $3
When price is $ 8, given Qd = 20 – 2P = Q, Q = 20 – 2(8), Q = 4.
Incidence of tax on consumers
= ΔP * new Q
= (8 – 7)4 = $4
Incidence of tax on producers
= ΔP * new Q
= (7 – 5)4 = $8
Deadweight
= 1
2 b∗h where b = 8 – 5 = 3, and h = 6 – 4 = 2
= 1
2 (3)∗2 = $3

Microeconomics 7
Question 2: Part II: Price Regulation
Part a
P
Oversupply
Supply
300 Minimum price
250
Demand
Q1 Q* Q2 Q
The initial quantity at equilibrium is Q*, and is offered at price $250. At the price of $300, the
demand falls from Q* to Q1. However, producers would like to supply Q2 level of output at this
high price and thus an oversupply equal to Q2 – Q1 occurs. The new equilibrium quantity Q1 is
lower and price is higher.
Part b
P
Oversupply
Supply
300 b Minimum price
250 c d
P f
Demand
Paraphrase This Document
Need a fresh take? Get an instant paraphrase of this document with our AI Paraphraser

Microeconomics 8
0 Q1 Q* Q2 Q
The government has fixed the price higher than the equilibrium price and thus many
consumers cannot afford to buy the same units as before. Thus there is a loss in consumer surplus
as the buy at price $300 other than $250. On the other hand, producers are happy now that their
gains will improve by selling at $300 other than at $250. The loss in consumer surplus is the gain
by the producers. The deadweight equal to triangle bdf occurs.
Part c
P
Oversupply
Supply
300 b Minimum price
250 c d
P f
Demand
0 Q1 Q* Q2 Quantity
The oversupply will remain unsold. Producer surplus will fall since their willingness is to
purchase at $250, but now they are forced to buy at $300. The total loss in consumer surplus is
(300 – 250)Q1 = 50Q1. On the other side, there is a gain the surplus for the producers because
they are willing to sell at $250, but now they have a chance of selling at $300. The gain is equal
to (300 – 250)Q1. The deadweight loss is area bdf
Deadweight loss = 1
2 b∗h where b = 300 – P, and h = Q* – Q1
= 1
2 ( 300−P )∗( Q∗– Q1 )

Microeconomics 9
Part d
The outcome of the U.S. Bill is not fair as it is not producing fair results. The demand has
fallen and consumers have a loss in surplus. This results in a gain in producer surplus, but this
are not fair results given that there is an oversupply that remain unsold. The deadweight loss
represents a welfare loss by the consumers. Even though the producers gain, they are not able to
generate greater revenue due to the deficiency in demand. It is even possible that the profit made
while selling Q1 at $300 could be lower than selling Q* at $250. This Bill could have been fair if
the U.S. trade wheat internationally. The Bill is therefore hurting both the consumers and the
producers. Or rather, if the producers are able to make the same level of revenue as before, the
bill can be argued to make the consumers worse off without making the producers better off.
Other policies need to accompany the Bill to generate some fair results, this could include the
government buying the excess supply.

Microeconomics 10
Question 3: The Impact of Natural Disaster
Part a
Price
S1
Shortage S
P1
P
Demand
Q1 Q Q2 Quantity
Supply of coffee will fall and the equilibrium supply curve S will shift to S1 causing price to rise
from P to P1. The supply shift to the right is because it’s induced by a non-price factor. The
shortage is as observed above because suppliers need to supply Q2 at price P1.
Part b
Price
S1
Shortage S
P2
P1
P
Secure Best Marks with AI Grader
Need help grading? Try our AI Grader for instant feedback on your assignments.

Microeconomics 11
Demand
0 Q3 Q1 Q Q2 Q4 Quantity
Since there is still a shortage and supply remains to be S1, an increase in demand will make the
situation worse, price will rise further from P1 to P2. The shortage will seem severe because at
price P2 producers need to supply Q4. The quantity demanded will fall further from Q1 to Q3.
Part c
Price
S1
S
P1
P
Demand
Q1 Q Quantity
Currently we are at S1 the supply at shortage. Assuming that the trial of the new specie
will be able to boost supply sufficient to push the economy back to the original supply level, S1
will shift to the left to S, which is at the initial equilibrium. This is at a lower price level and a
higher quantity level than when there was shortage. If the supply will be big enough to push
supply beyond the initial equilibrium level, price will fall further. However, if the supply is not
sufficient to push the market to original equilibrium price will fall between P and P1 and quantity
between Q and Q1.
Demand
0 Q3 Q1 Q Q2 Q4 Quantity
Since there is still a shortage and supply remains to be S1, an increase in demand will make the
situation worse, price will rise further from P1 to P2. The shortage will seem severe because at
price P2 producers need to supply Q4. The quantity demanded will fall further from Q1 to Q3.
Part c
Price
S1
S
P1
P
Demand
Q1 Q Quantity
Currently we are at S1 the supply at shortage. Assuming that the trial of the new specie
will be able to boost supply sufficient to push the economy back to the original supply level, S1
will shift to the left to S, which is at the initial equilibrium. This is at a lower price level and a
higher quantity level than when there was shortage. If the supply will be big enough to push
supply beyond the initial equilibrium level, price will fall further. However, if the supply is not
sufficient to push the market to original equilibrium price will fall between P and P1 and quantity
between Q and Q1.

Microeconomics 12
Bibliography
Anand, V, Production Possibility Curve under Constant and Increasing Costs. (Economics Discussion,
2018).
Gifford Adam, Tax Incidence: Definition, Formula & Example. (Studycom, 2018).
Hayes Adam, Economics Basics: Production Possibility Frontier, Growth, Opportunity Cost and Trade.
(Investopedia, 2018).
1 out of 12
Related Documents

Your All-in-One AI-Powered Toolkit for Academic Success.
+13062052269
info@desklib.com
Available 24*7 on WhatsApp / Email
Unlock your academic potential
© 2024 | Zucol Services PVT LTD | All rights reserved.