Microeconomics Assignment: Analyzing Market Structures and Cost Curves
VerifiedAdded on 2022/12/20
|8
|756
|57
Homework Assignment
AI Summary
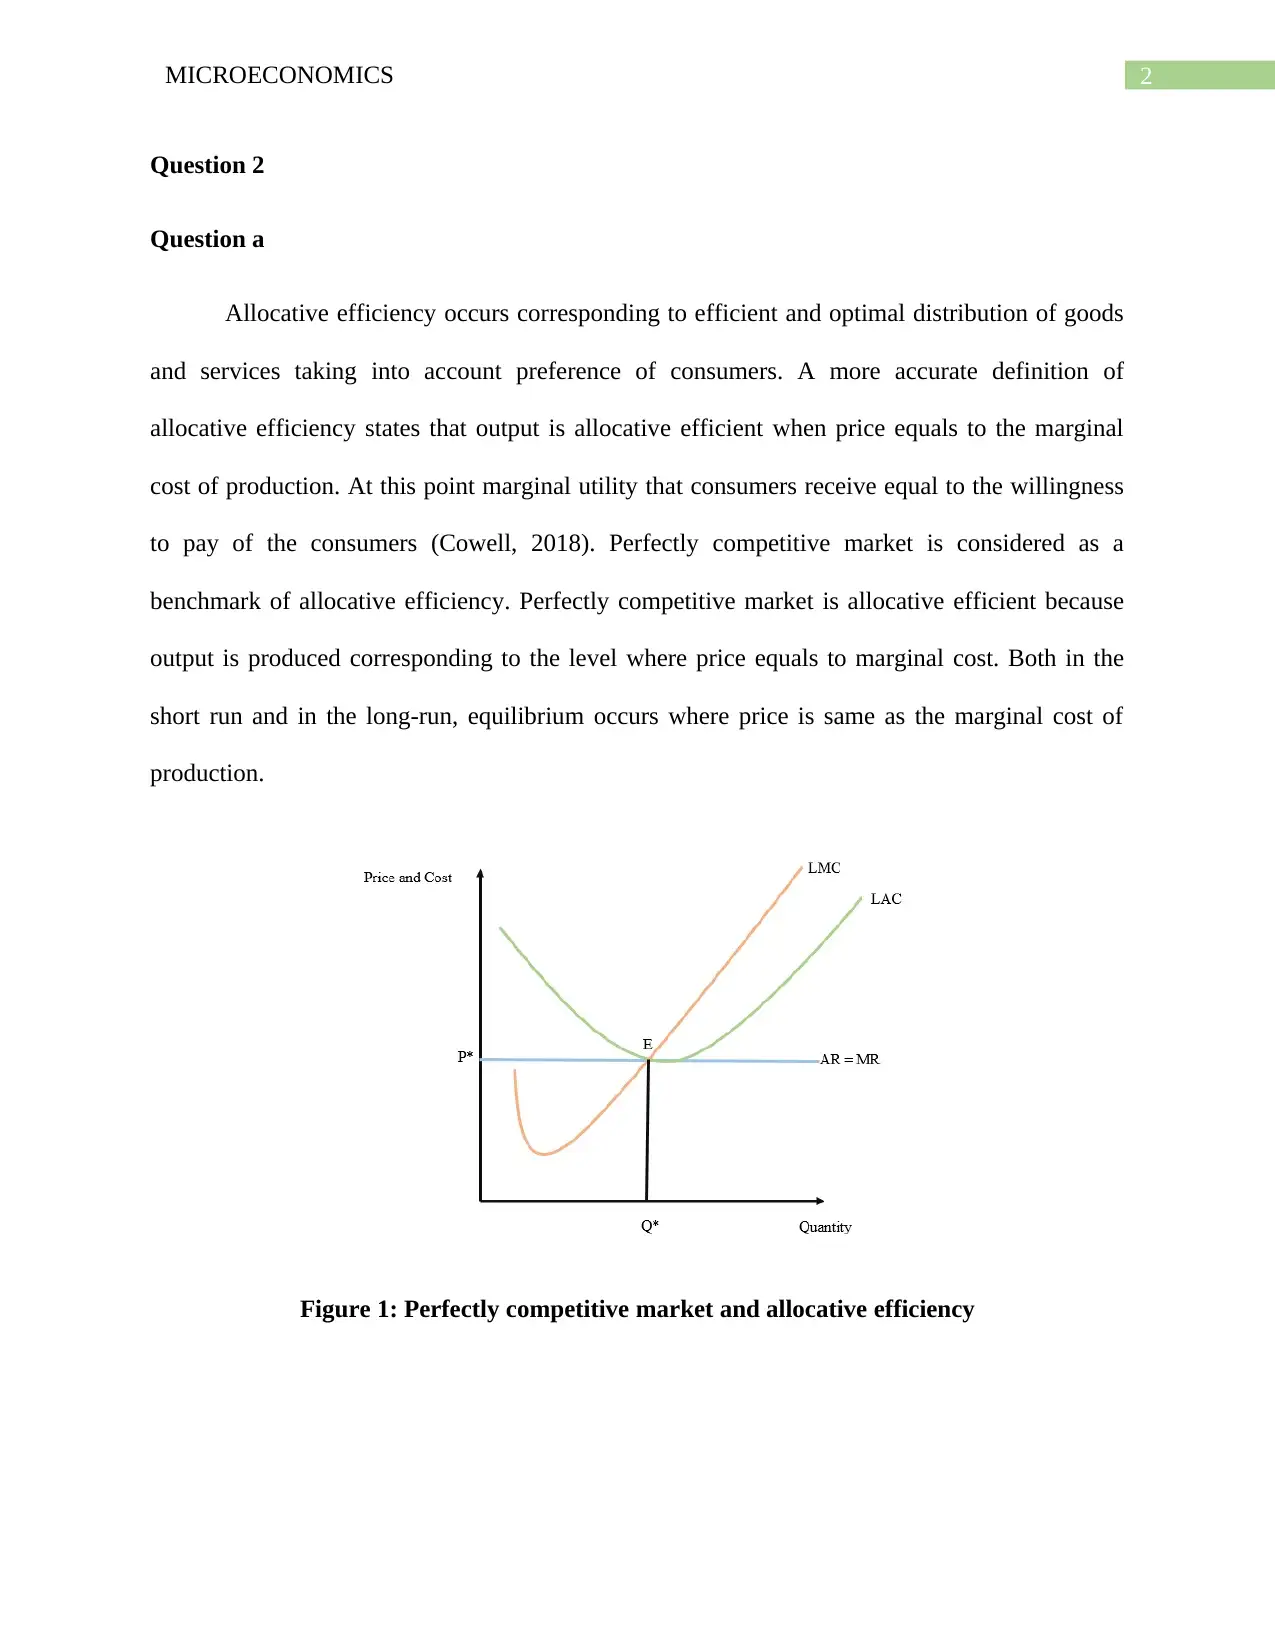
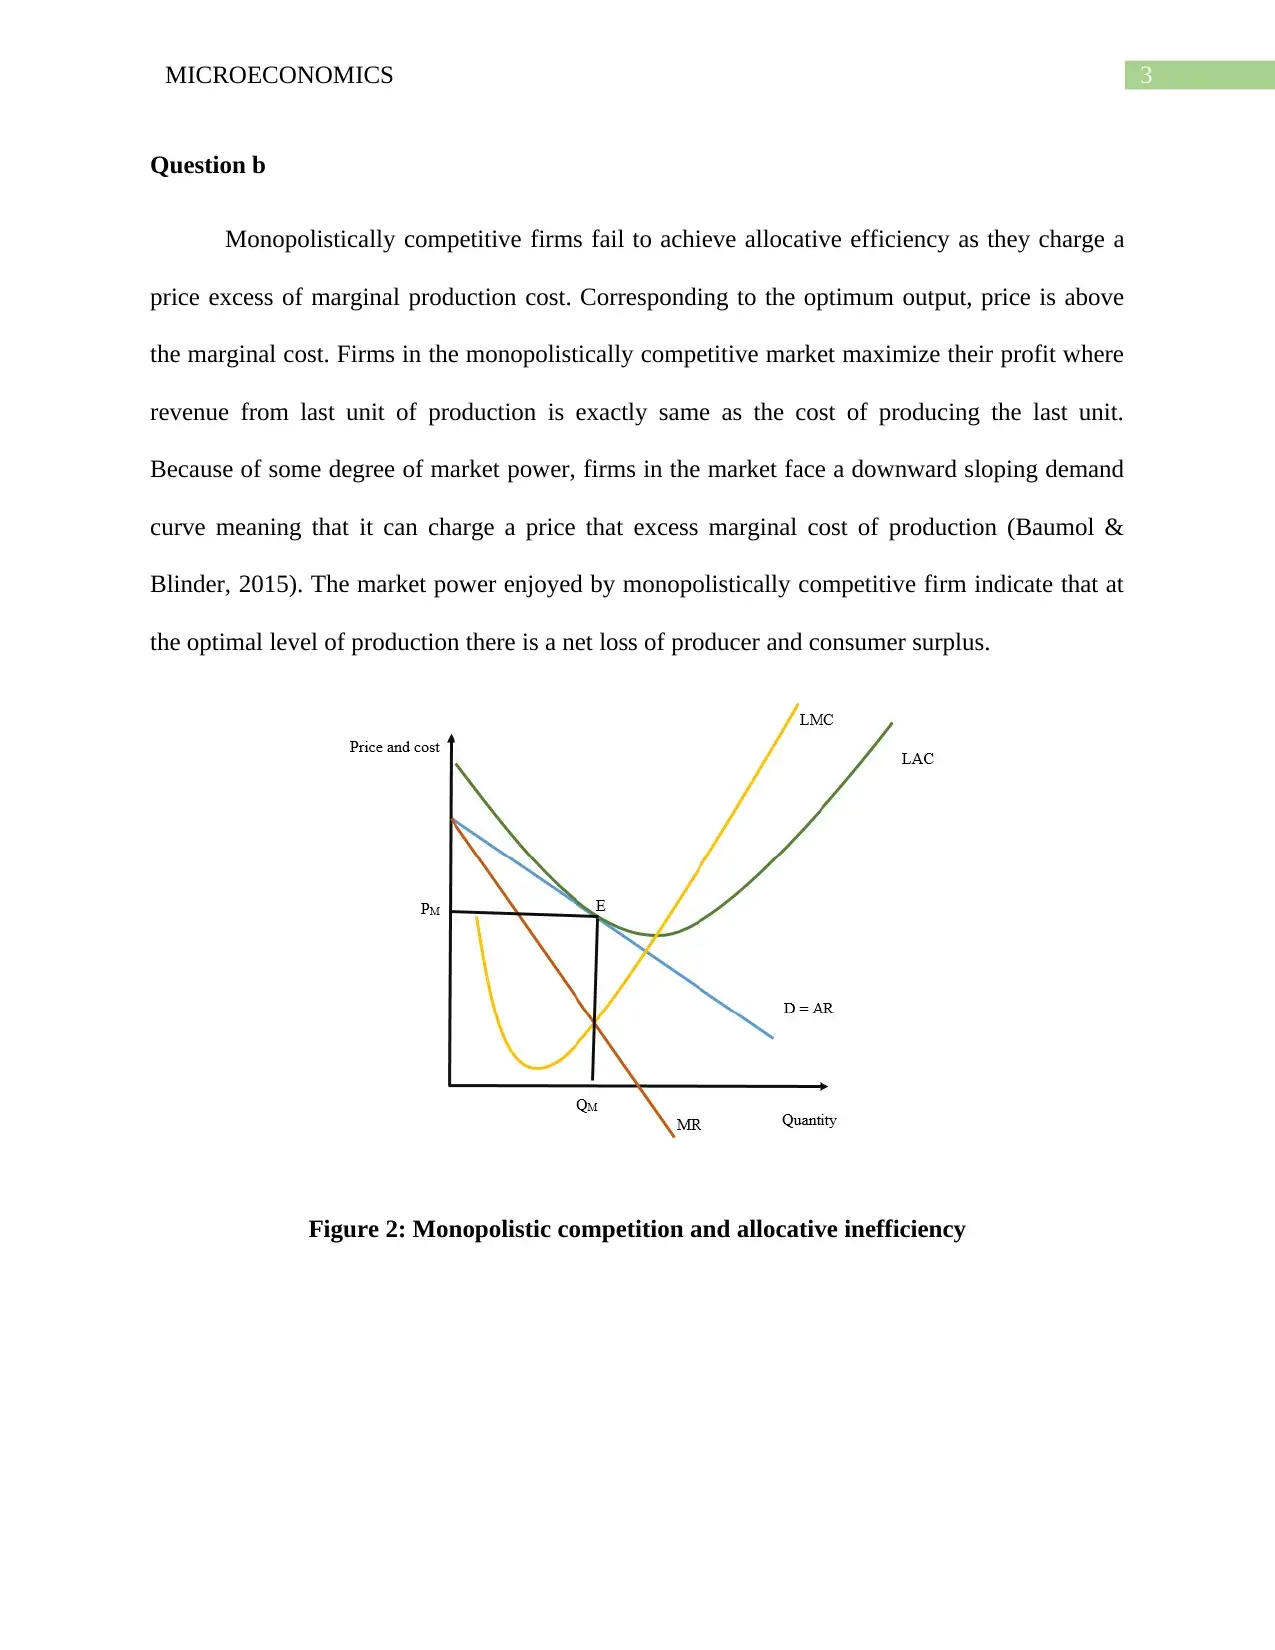
This microeconomics assignment solution addresses key concepts including allocative efficiency and market structures. Question 2 examines allocative efficiency in perfectly competitive markets and why monopolistically competitive firms fail to achieve it, using diagrams to illustrate the concep...
Read More
Contribute Materials
Your contribution can guide someone’s learning journey. Share your
documents today.

Running head: MICROECONOMICS
Microeconomics
Name of the Student
Name of the University
Course ID
Microeconomics
Name of the Student
Name of the University
Course ID
Secure Best Marks with AI Grader
Need help grading? Try our AI Grader for instant feedback on your assignments.

1MICROECONOMICS
Table of Contents
Question 2........................................................................................................................................2
Question a....................................................................................................................................2
Question b....................................................................................................................................3
Question 3........................................................................................................................................4
Question a....................................................................................................................................4
Question b....................................................................................................................................5
Question c....................................................................................................................................6
References........................................................................................................................................7

2MICROECONOMICS
Question 2
Question a
Allocative efficiency occurs corresponding to efficient and optimal distribution of goods
and services taking into account preference of consumers. A more accurate definition of
allocative efficiency states that output is allocative efficient when price equals to the marginal
cost of production. At this point marginal utility that consumers receive equal to the willingness
to pay of the consumers (Cowell, 2018). Perfectly competitive market is considered as a
benchmark of allocative efficiency. Perfectly competitive market is allocative efficient because
output is produced corresponding to the level where price equals to marginal cost. Both in the
short run and in the long-run, equilibrium occurs where price is same as the marginal cost of
production.
Figure 1: Perfectly competitive market and allocative efficiency

3MICROECONOMICS
Question b
Monopolistically competitive firms fail to achieve allocative efficiency as they charge a
price excess of marginal production cost. Corresponding to the optimum output, price is above
the marginal cost. Firms in the monopolistically competitive market maximize their profit where
revenue from last unit of production is exactly same as the cost of producing the last unit.
Because of some degree of market power, firms in the market face a downward sloping demand
curve meaning that it can charge a price that excess marginal cost of production (Baumol &
Blinder, 2015). The market power enjoyed by monopolistically competitive firm indicate that at
the optimal level of production there is a net loss of producer and consumer surplus.
Figure 2: Monopolistic competition and allocative inefficiency
Secure Best Marks with AI Grader
Need help grading? Try our AI Grader for instant feedback on your assignments.

4MICROECONOMICS
Question 3
Question a
Marginal product refers to the addition to total product due to unit change in variable
input of production. Marginal cost indicates the change in total cost following unit change in
produced output. The shape of marginal cost curve related to the shape of marginal product
curve. The rising portion of marginal product is associated with falling part of marginal cost
curve. The decreasing portion of marginal product curve corresponds to the rising part of
marginal cost. The marginal cost is at minimum when marginal product is maximum (Cowen &
Tabarrok, 2015). The law of diminishing marginal return is the key factor explaining the
correspondence between marginal product and marginal cost.
Figure 3: Relation between marginal product and marginal cost

5MICROECONOMICS
Question b
The long run average cost is derived from the short run average cost curve. Suppose there
are three different plants in the industry – small, medium and large. SAC1, SAC2 and SAC3 are
the respective short run average cost curves of small-sized, medium sized and large-sized plants
as shown in the figure below.
Figure 4: SAC curves for three different plants
In the long-run, firm choses plant size that will allow firm to produce output at the least
possible cost. For desired output, level of OQ1, the firm choses the plat size denoted by SAC1.
Plant size of SAC2 and SAC3 are chosen for the respective output levels of OQ2 and OQ3. Now if
the industry faces a large number of different plants, then these curves produce a smooth long
run average cost curve.

6MICROECONOMICS
Figure 5: Long run average cost curve
Question c
Each point on the long run average cost curve shows lowest possible cost for producing
the corresponding output (Mochrie, 2015). The falling part of LAC shows presence of
economies of scale and the rising part of LAC represents diseconomies of scale.
Figure 5: Long run average cost curve
Question c
Each point on the long run average cost curve shows lowest possible cost for producing
the corresponding output (Mochrie, 2015). The falling part of LAC shows presence of
economies of scale and the rising part of LAC represents diseconomies of scale.
Paraphrase This Document
Need a fresh take? Get an instant paraphrase of this document with our AI Paraphraser

7MICROECONOMICS
References
Baumol, W. J., & Blinder, A. S. (2015). Microeconomics: Principles and policy. Nelson
Education.
Cowell, F. (2018). Microeconomics: principles and analysis. Oxford University Press.
Cowen, T., & Tabarrok, A. (2015). Modern principles of microeconomics. Macmillan
International Higher Education.
Mochrie, R. (2015). Intermediate microeconomics. Macmillan International Higher Education.
1 out of 8
Related Documents

Your All-in-One AI-Powered Toolkit for Academic Success.
+13062052269
info@desklib.com
Available 24*7 on WhatsApp / Email
Unlock your academic potential
© 2024 | Zucol Services PVT LTD | All rights reserved.