Microeconomics Assignment: Market Dynamics and Policy Impacts

Verified

Added on  2022/09/07

|11
|1541
|17
Homework Assignment
AI Summary
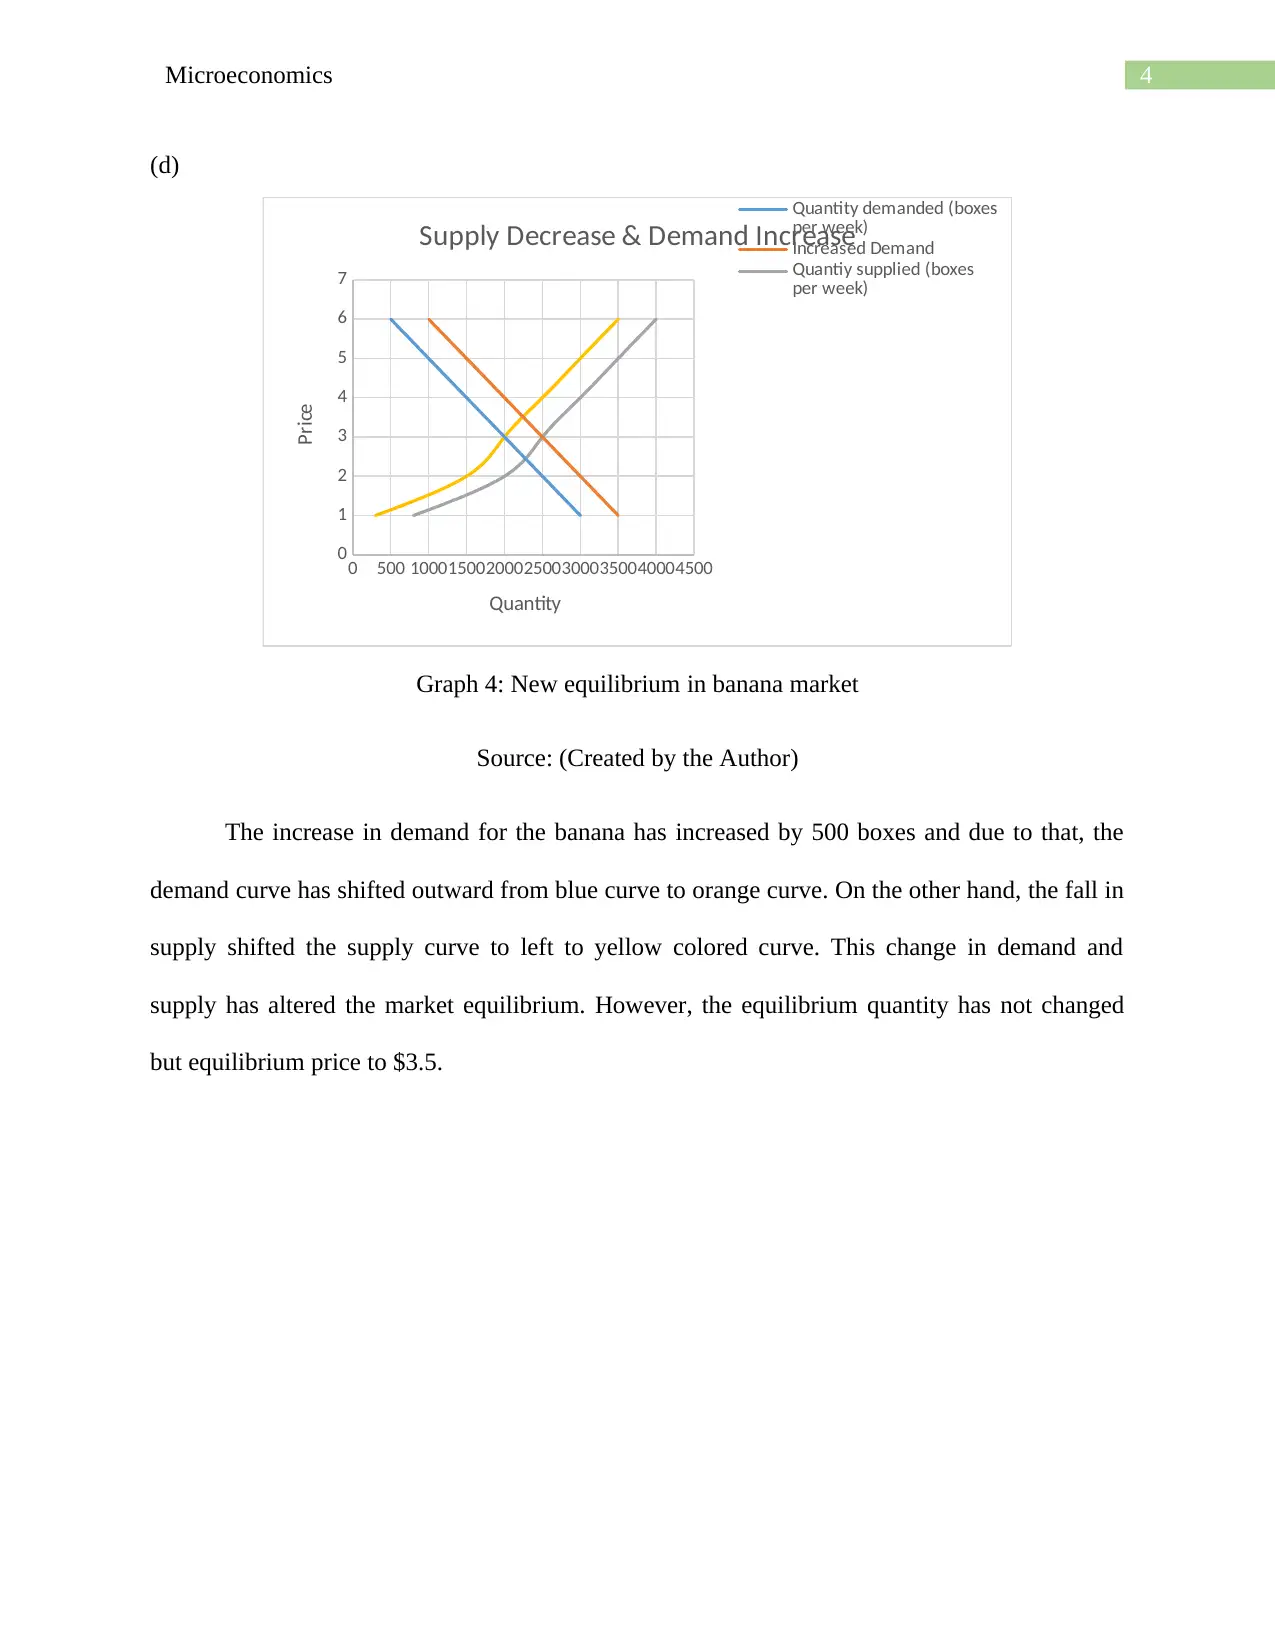
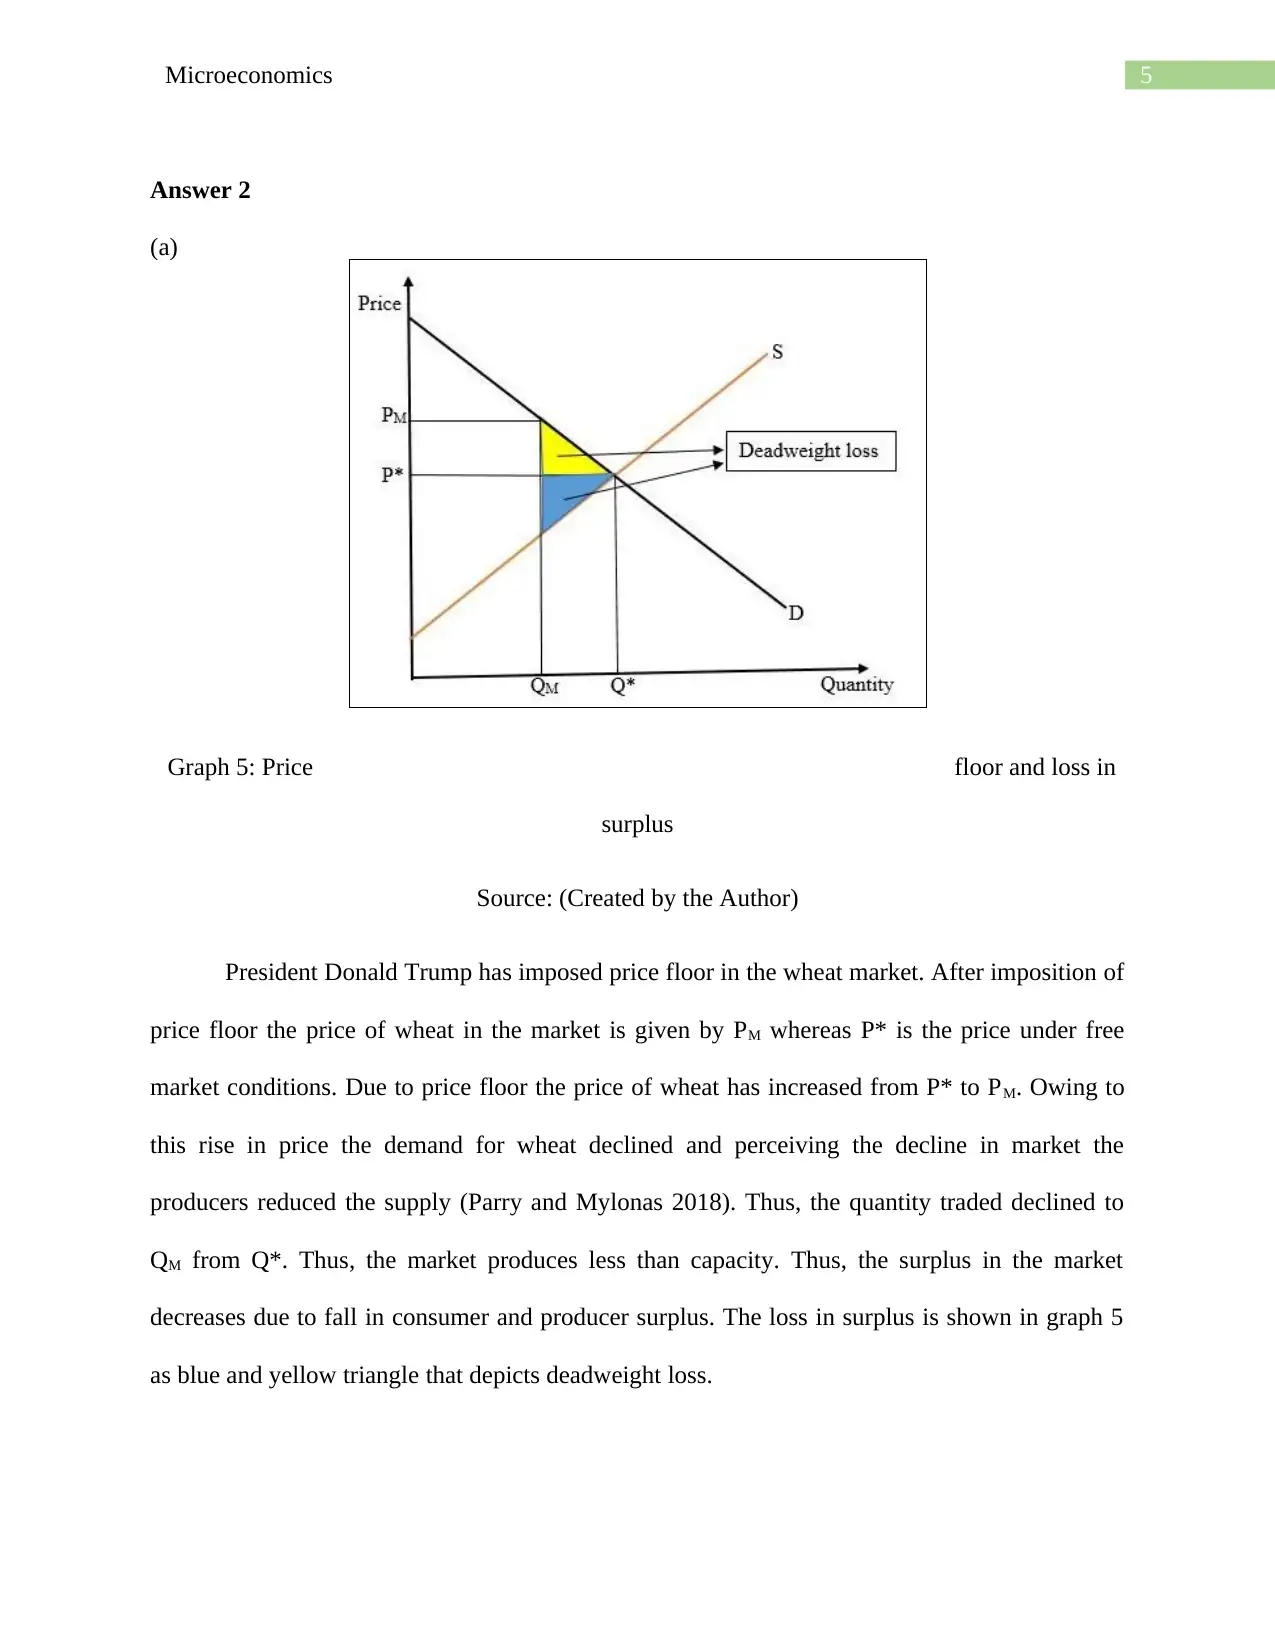
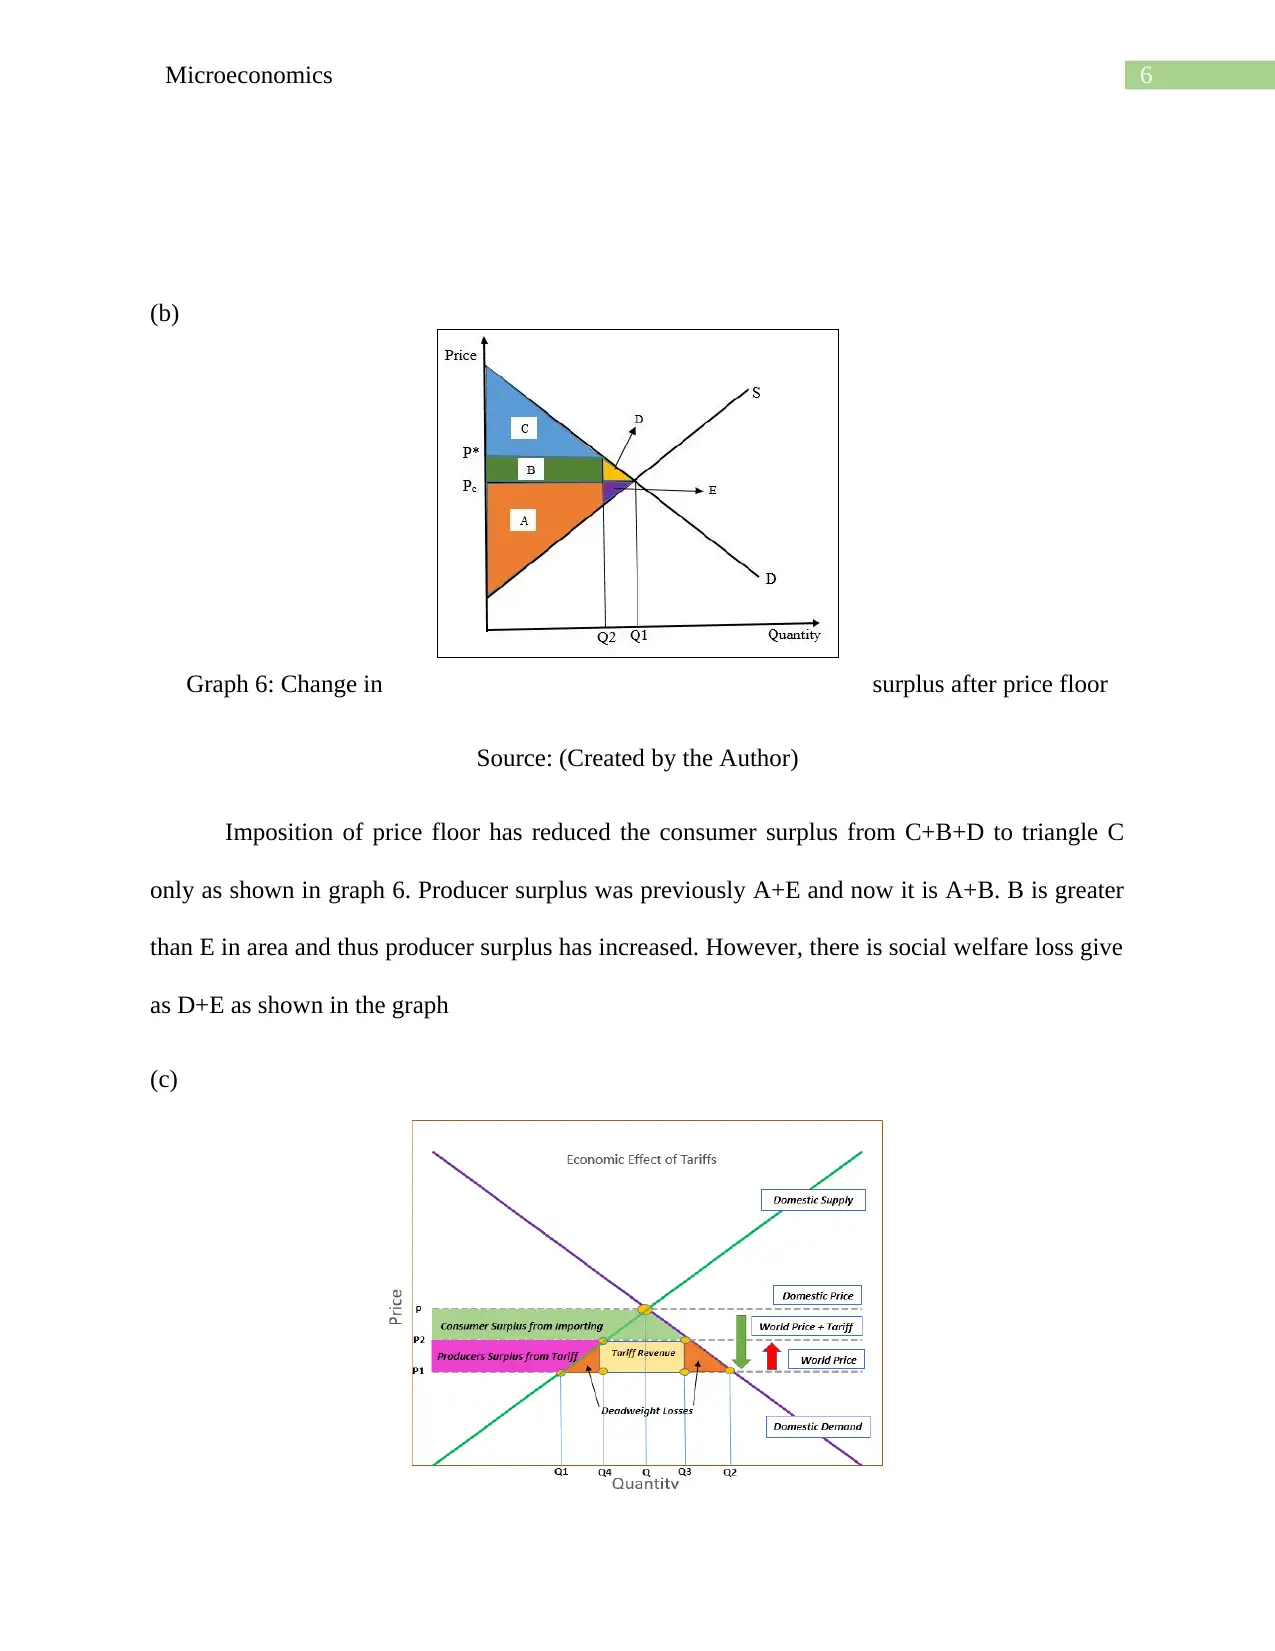
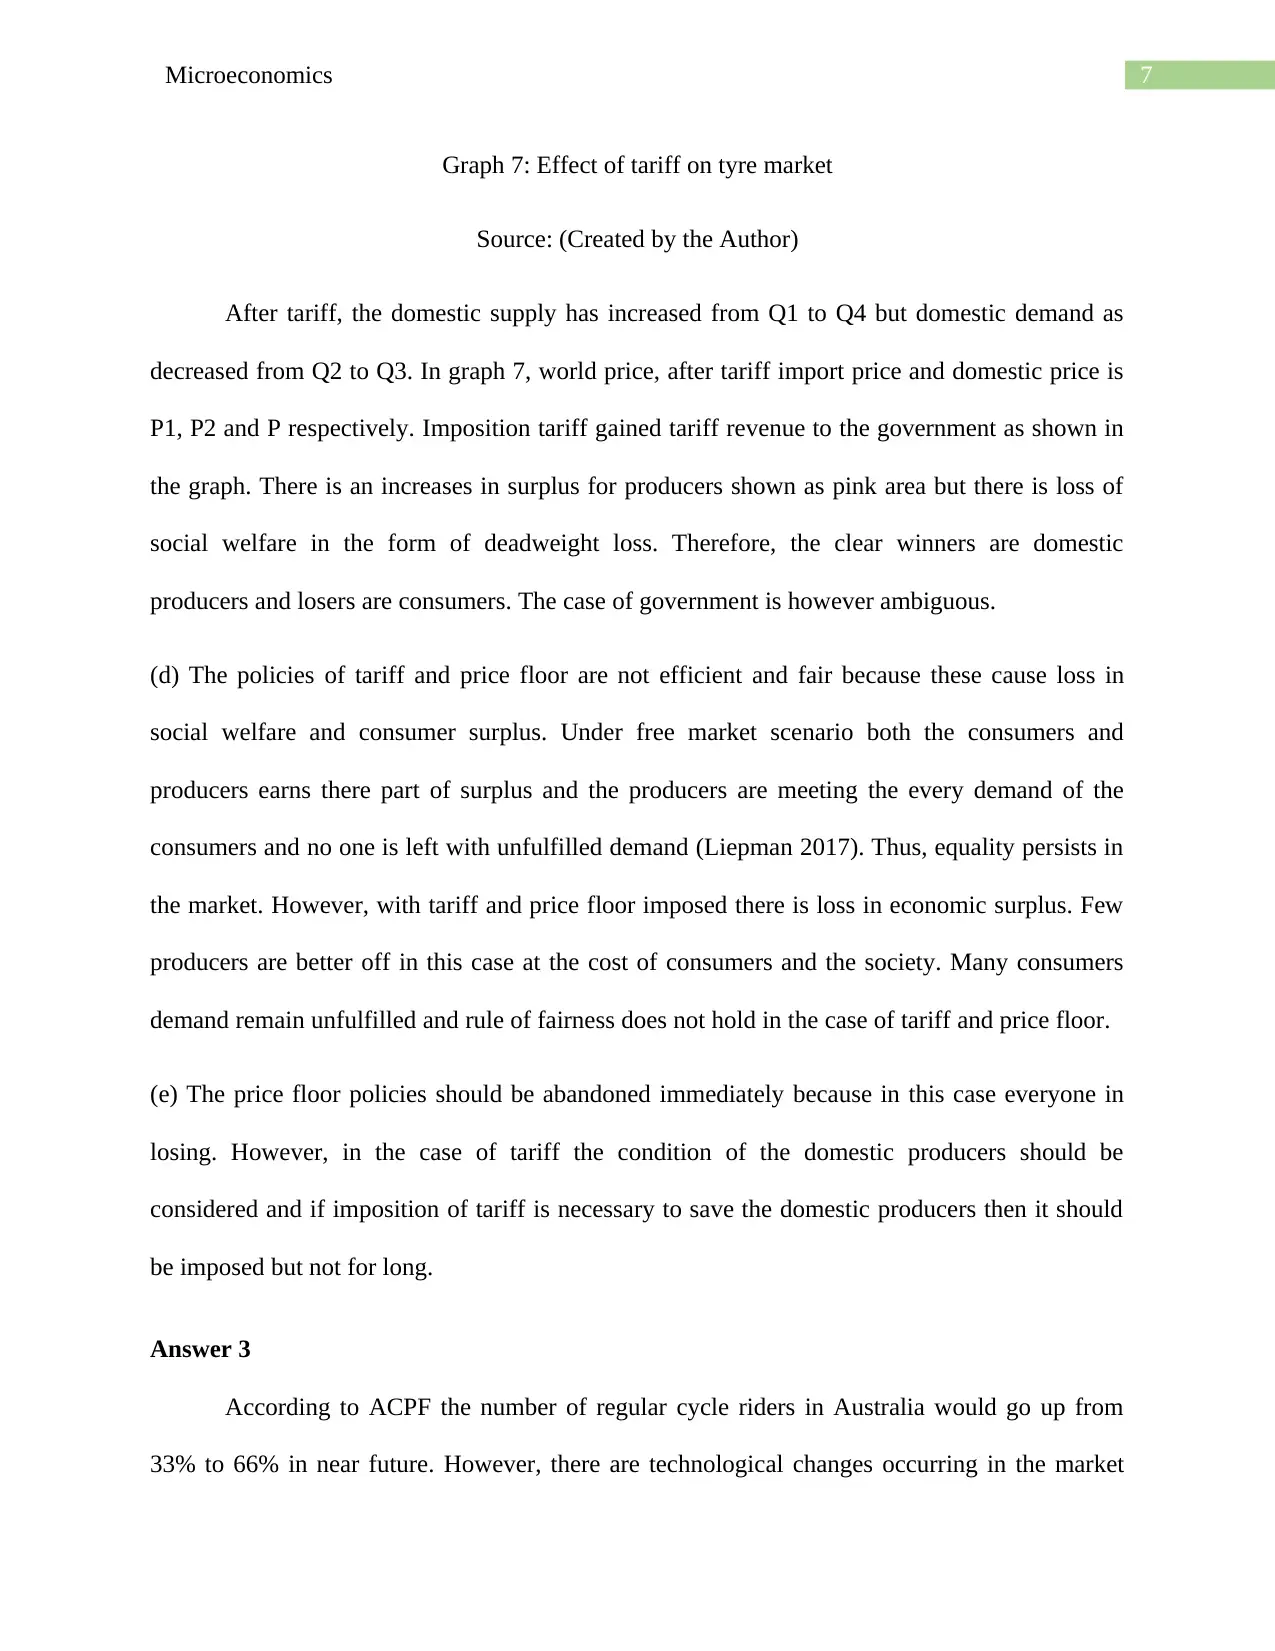
This microeconomics assignment delves into the analysis of market dynamics and the impacts of various economic policies. The assignment begins with an examination of market equilibrium using the banana market as an example, illustrating how changes in supply and demand affect prices and quantities. It then explores the implications of price floors, specifically using the wheat market, and tariffs, focusing on the tyre market, evaluating their effects on consumer and producer surplus, and identifying deadweight loss. Finally, the assignment examines the bicycle market, considering factors such as motor vehicle prices, income levels, public transport, and road conditions to assess the market's future and the factors affecting demand. The analysis incorporates graphical representations to illustrate key economic concepts and policy impacts. The assignment aims to provide a comprehensive understanding of microeconomic principles through real-world examples and policy evaluations.
Document Page
Running head: Microeconomics
Microeconomics
Name of the Student
Name of the University
Student ID
tabler-icon-diamond-filled.svg

Paraphrase This Document

Need a fresh take? Get an instant paraphrase of this document with our AI Paraphraser
Document Page
1Microeconomics
Table of Contents
Answer 1..........................................................................................................................................2
Answer 2..........................................................................................................................................5
Answer 3..........................................................................................................................................7
Reference.......................................................................................................................................10
Document Page
2Microeconomics
Answer 1
(a)
Graph 1: Banana market equilibrium
Source: (Created by the Author)
The equilibrium price and quantity are $2.5 and 2250 boxes respectively. Equilibrium in
a market is decided at the point where total amount of quantity demanded is equal to the total
amount of quantity supplied (Tian 2016). The price and quantity traded in the market at this
point is thus regarded as equilibrium price and quantity.
(b) The market for banana would have faced excess demand if the price of banana becomes
$1.50 a box because this price is below the level of equilibrium price $2.5 of the market. Thus,
the supply is lower than the demand (Basu and Pak 2016). Thus, the firms will increase their
price to gain more revenue and the quantity of banana traded. Thus, both the price and quantity
will increase in the market.
0 500 1000 1500 2000 2500 3000 3500 4000 4500
0
1
2
3
4
5
6
7
Banana Market
Quantity demanded (boxes per week) Quantiy supplied (boxes per week)
Quantity
Price
Document Page
3Microeconomics
(c)
Diagram 2: Fall in supply in banana market
Source: (Created by the Author)
Due to cyclone, the supply of banana has declined. The amount of fall in supply per week
is 500 boxes. As a result, the supply curve shifted to the left and thereby the price of banana
increased. After fall in supply, the equilibrium price and quantity of the banana market is $3 and
2000 boxes per week.
0 500 10001500200025003000350040004500
0
1
2
3
4
5
6
7
Banana Market After Decrease in Supply
Quantity demanded (boxes
per week)
Quantiy supplied (boxes
per week)
Quantity
Price
tabler-icon-diamond-filled.svg

Paraphrase This Document

Need a fresh take? Get an instant paraphrase of this document with our AI Paraphraser
Document Page
4Microeconomics
(d)
Graph 4: New equilibrium in banana market
Source: (Created by the Author)
The increase in demand for the banana has increased by 500 boxes and due to that, the
demand curve has shifted outward from blue curve to orange curve. On the other hand, the fall in
supply shifted the supply curve to left to yellow colored curve. This change in demand and
supply has altered the market equilibrium. However, the equilibrium quantity has not changed
but equilibrium price to $3.5.
0 500 10001500200025003000350040004500
0
1
2
3
4
5
6
7
Supply Decrease & Demand Increase
Quantity demanded (boxes
per week)
Increased Demand
Quantiy supplied (boxes
per week)
Quantity
Price
Document Page
5Microeconomics
Answer 2
(a)
Graph 5: Price floor and loss in
surplus
Source: (Created by the Author)
President Donald Trump has imposed price floor in the wheat market. After imposition of
price floor the price of wheat in the market is given by PM whereas P* is the price under free
market conditions. Due to price floor the price of wheat has increased from P* to PM. Owing to
this rise in price the demand for wheat declined and perceiving the decline in market the
producers reduced the supply (Parry and Mylonas 2018). Thus, the quantity traded declined to
QM from Q*. Thus, the market produces less than capacity. Thus, the surplus in the market
decreases due to fall in consumer and producer surplus. The loss in surplus is shown in graph 5
as blue and yellow triangle that depicts deadweight loss.
Document Page
6Microeconomics
(b)
Graph 6: Change in surplus after price floor
Source: (Created by the Author)
Imposition of price floor has reduced the consumer surplus from C+B+D to triangle C
only as shown in graph 6. Producer surplus was previously A+E and now it is A+B. B is greater
than E in area and thus producer surplus has increased. However, there is social welfare loss give
as D+E as shown in the graph
(c)
tabler-icon-diamond-filled.svg

Paraphrase This Document

Need a fresh take? Get an instant paraphrase of this document with our AI Paraphraser
Document Page
7Microeconomics
Graph 7: Effect of tariff on tyre market
Source: (Created by the Author)
After tariff, the domestic supply has increased from Q1 to Q4 but domestic demand as
decreased from Q2 to Q3. In graph 7, world price, after tariff import price and domestic price is
P1, P2 and P respectively. Imposition tariff gained tariff revenue to the government as shown in
the graph. There is an increases in surplus for producers shown as pink area but there is loss of
social welfare in the form of deadweight loss. Therefore, the clear winners are domestic
producers and losers are consumers. The case of government is however ambiguous.
(d) The policies of tariff and price floor are not efficient and fair because these cause loss in
social welfare and consumer surplus. Under free market scenario both the consumers and
producers earns there part of surplus and the producers are meeting the every demand of the
consumers and no one is left with unfulfilled demand (Liepman 2017). Thus, equality persists in
the market. However, with tariff and price floor imposed there is loss in economic surplus. Few
producers are better off in this case at the cost of consumers and the society. Many consumers
demand remain unfulfilled and rule of fairness does not hold in the case of tariff and price floor.
(e) The price floor policies should be abandoned immediately because in this case everyone in
losing. However, in the case of tariff the condition of the domestic producers should be
considered and if imposition of tariff is necessary to save the domestic producers then it should
be imposed but not for long.
Answer 3
According to ACPF the number of regular cycle riders in Australia would go up from
33% to 66% in near future. However, there are technological changes occurring in the market
Document Page
8Microeconomics
that might affect this prediction. The cycling is the healthiest mode of transport as it demands
physical activity which is untrue for other mode of transport such as driving car or book a cab.
On the other hand, increasing income of individuals will have impact on the demand of cycles.
The report thus discusses the market factors of bicycle and thereby explains why it is important
to provide more incentive to encourage cycling.
The motor vehicle market is changing significantly. Cars are getting cheaper and thus
they are becoming more affordable even to the people with less fortune (Jawad et al. 2016).
Motor vehicles are faster mode of travel than bicycles and people likes to save time and thus a
fall in price and decline in maintenance cost of the motor vehicles would reduce the overall price
of vehicles and thus the demand for bicycles would fall since they are substitute products.
Graph 8: Price of motor vehicles and demand for
cycles
Source: (Created by the Author)
On the other hand if price of motor vehicles increase demand for cycles would increase
as well due to effect of cross price elasticity. Thus, motor vehicle market significantly impact the
Document Page
9Microeconomics
bicycle market and to promote bicycle riding the incentive of bicycle should be increased more
than the health benefit only.
Moreover, the income of individuals has direct impact on the consumption habits. With
increase in income people consume more and become more prone to pleasure and consumption
of unhealthy foods. Australia is a developed country and is growing and thus with increase in
income they will tend to consume more luxury products than a normal product like bicycle.
Therefore, it is sales of cars will increase instead of bicycles with rise in income. There are other
factors that impact the demand for bicycles and that are public transport and road conditions.
Bicycle is a slower mode of transport and if the traffic is high then it will take more time to reach
the place of work. Thus, people would avoid riding bicycle. Therefore, it is suggested that to
improve the road conditions. Additionally, the fare of public transport should be increased such
that people get encouraged to use bicycle more often.
tabler-icon-diamond-filled.svg

Paraphrase This Document

Need a fresh take? Get an instant paraphrase of this document with our AI Paraphraser
Document Page
10Microeconomics
Reference
Basu, K. and Pak, M., 2016. Will the Needs‐Based Planning of Health Human Resources
Currently Undertaken in Several Countries Lead to Excess Supply and Inefficiency?. Health
economics, 25(1), pp.101-110.
Jawad, M., Lee, J.T., Glantz, S. and Millett, C., 2018. Price elasticity of demand of non-cigarette
tobacco products: a systematic review and meta-analysis. Tobacco control, 27(6), pp.689-695.
Liepmann, H., 2017. Tariff levels and the economic unity of Europe: an examination of tariff
policy, export movements and the economic integration of Europe, 1913-1931. Routledge.
Parry, I.W. and Mylonas, V., 2018. Canada’s Carbon Price Floor. International Monetary Fund.
Tian, G. (2016). On the existence of price equilibrium in economies with excess demand
functions. Economic Theory Bulletin, 4(1), 5-16.
chevron_up_icon
1 out of 11
circle_padding
hide_on_mobile
zoom_out_icon