Microeconomics Assignment: Demand, Supply and Apple Market Analysis

Verified

Added on  2021/11/08

|6
|461
|90
Homework Assignment
AI Summary
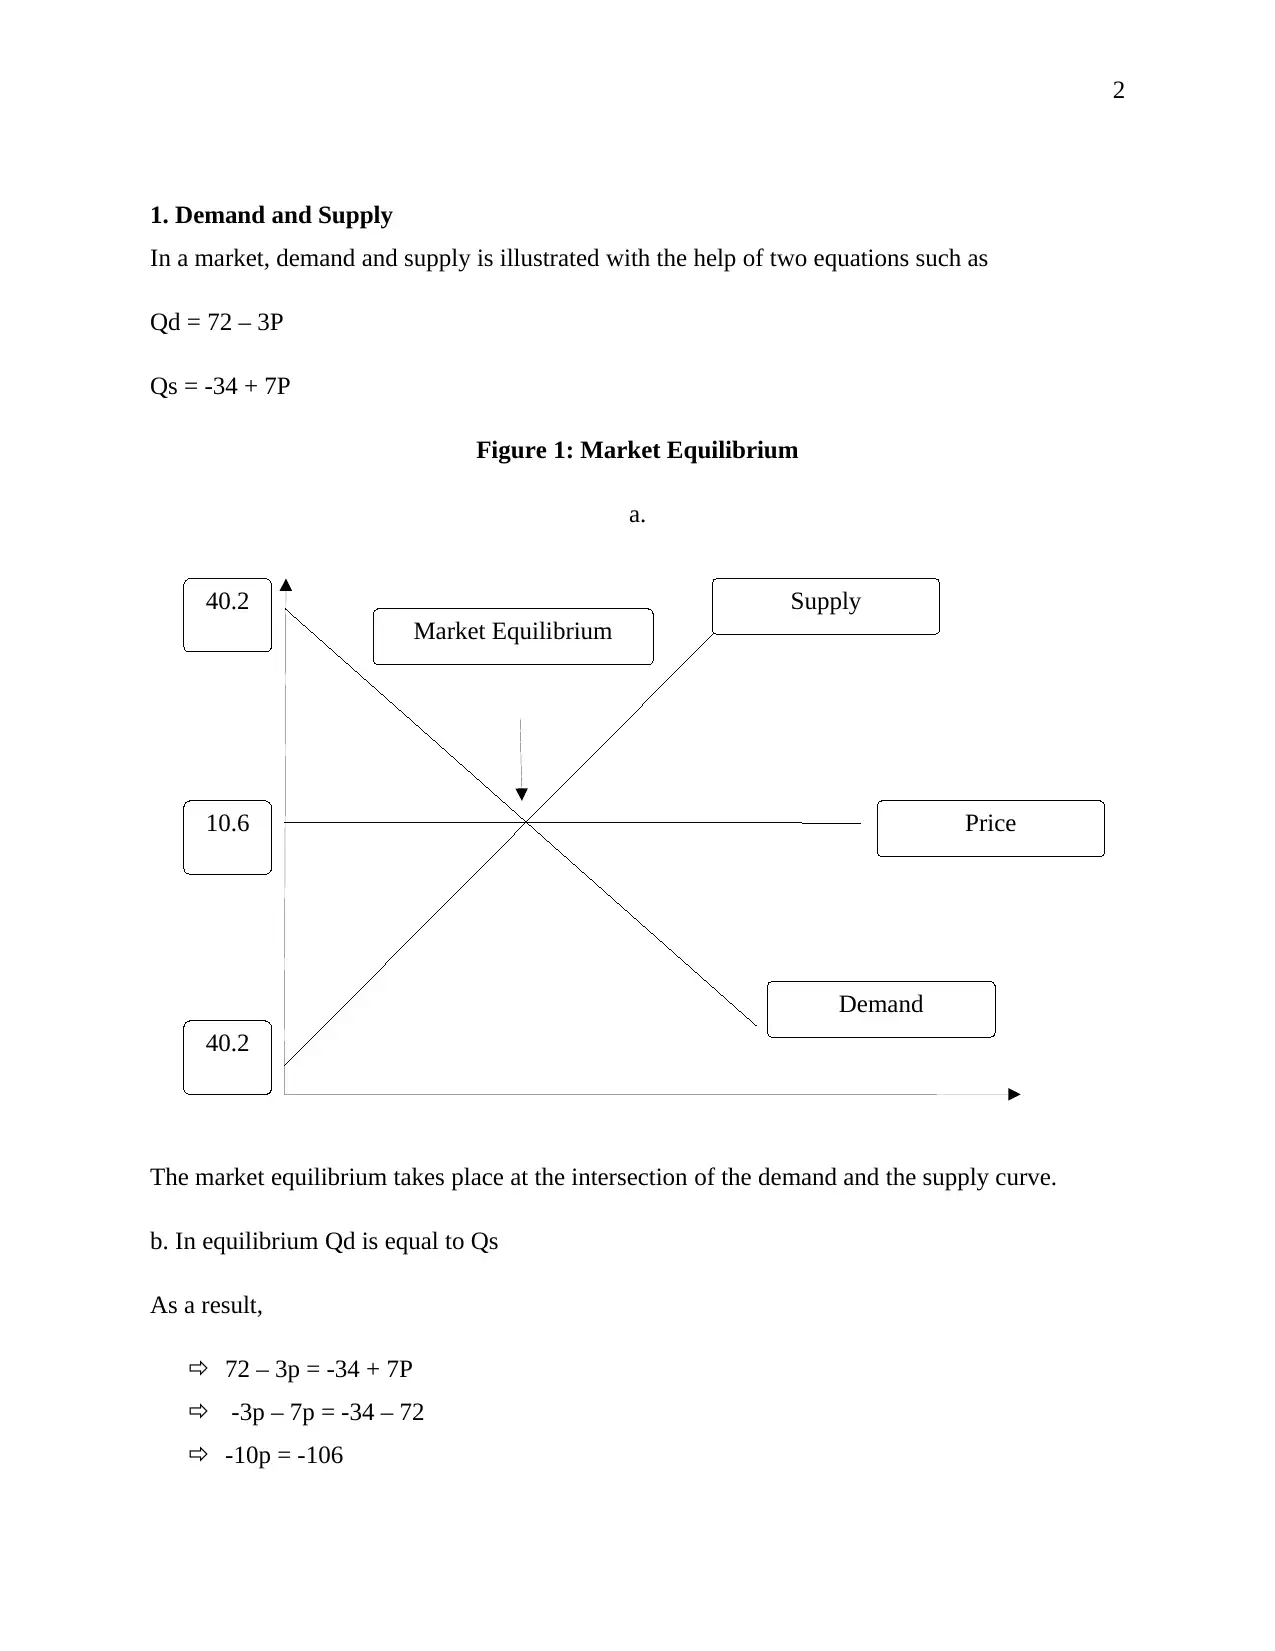
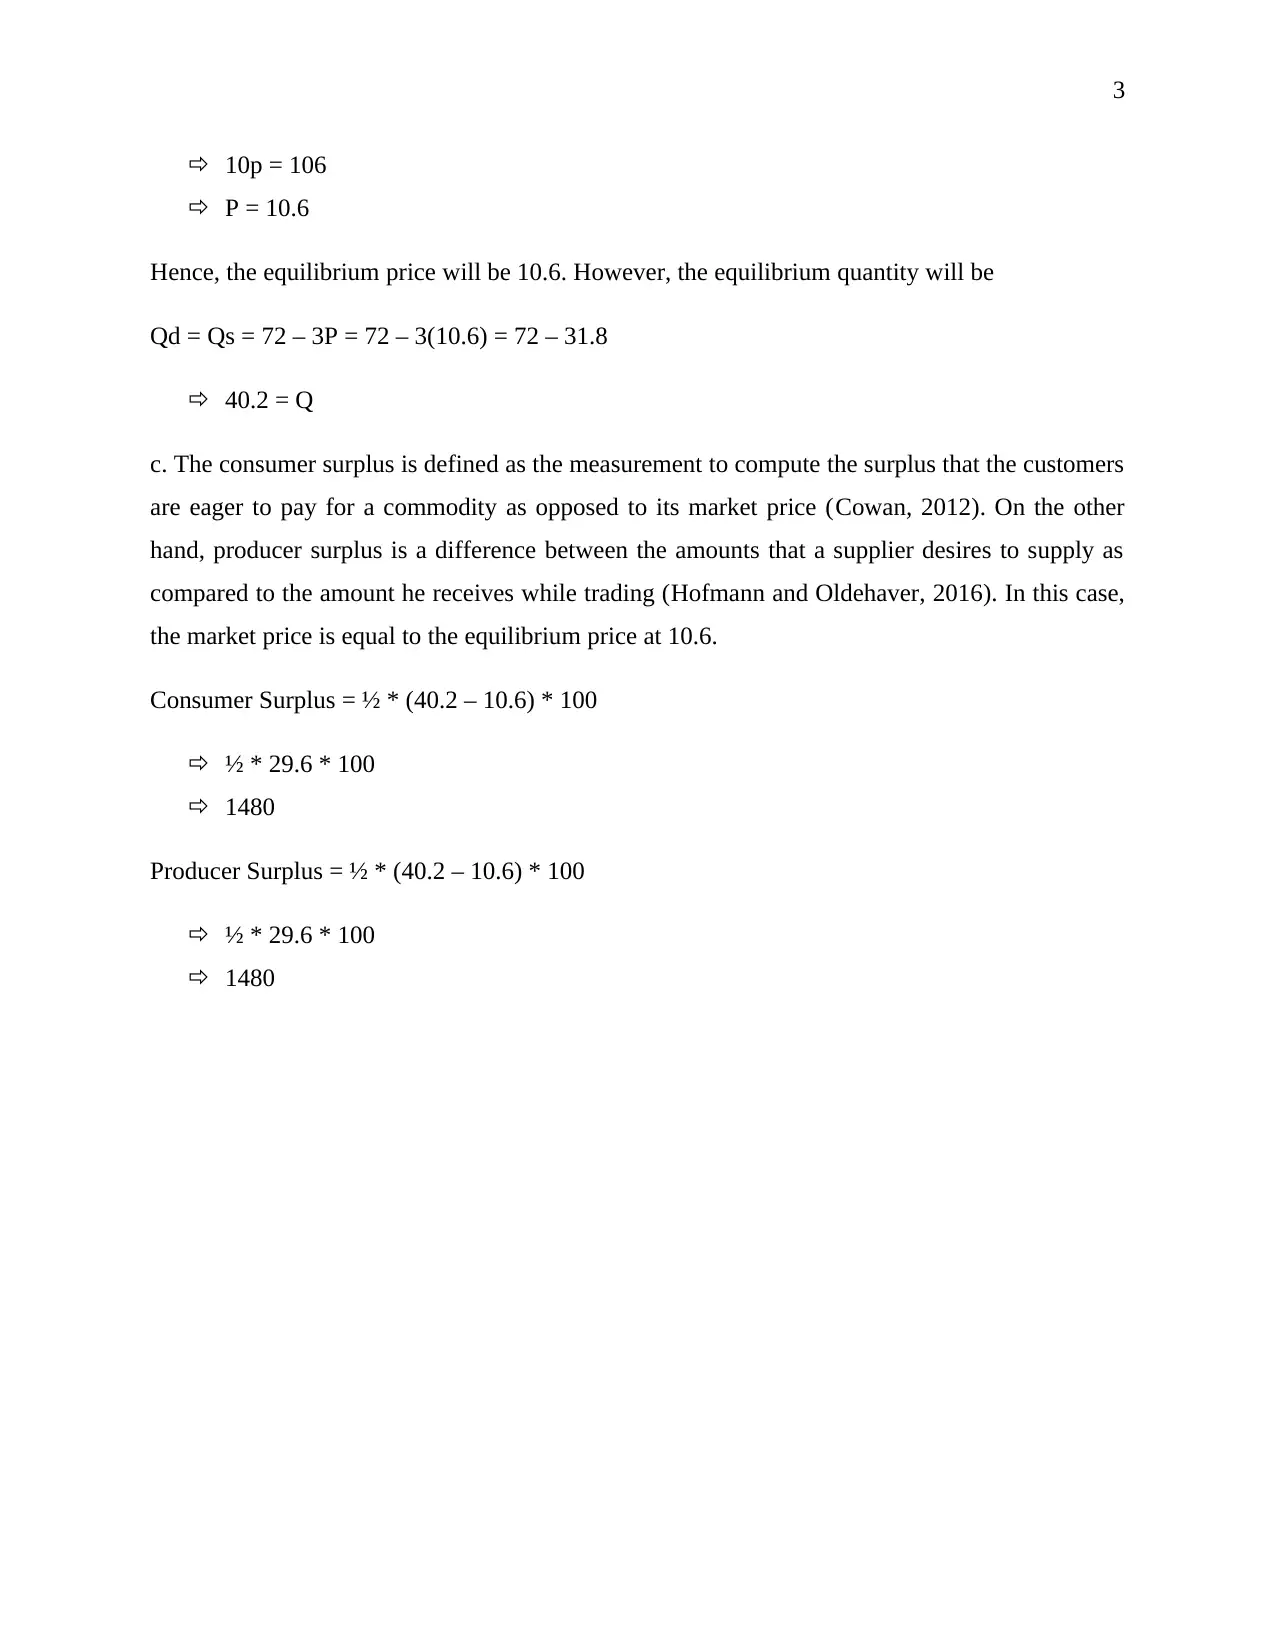
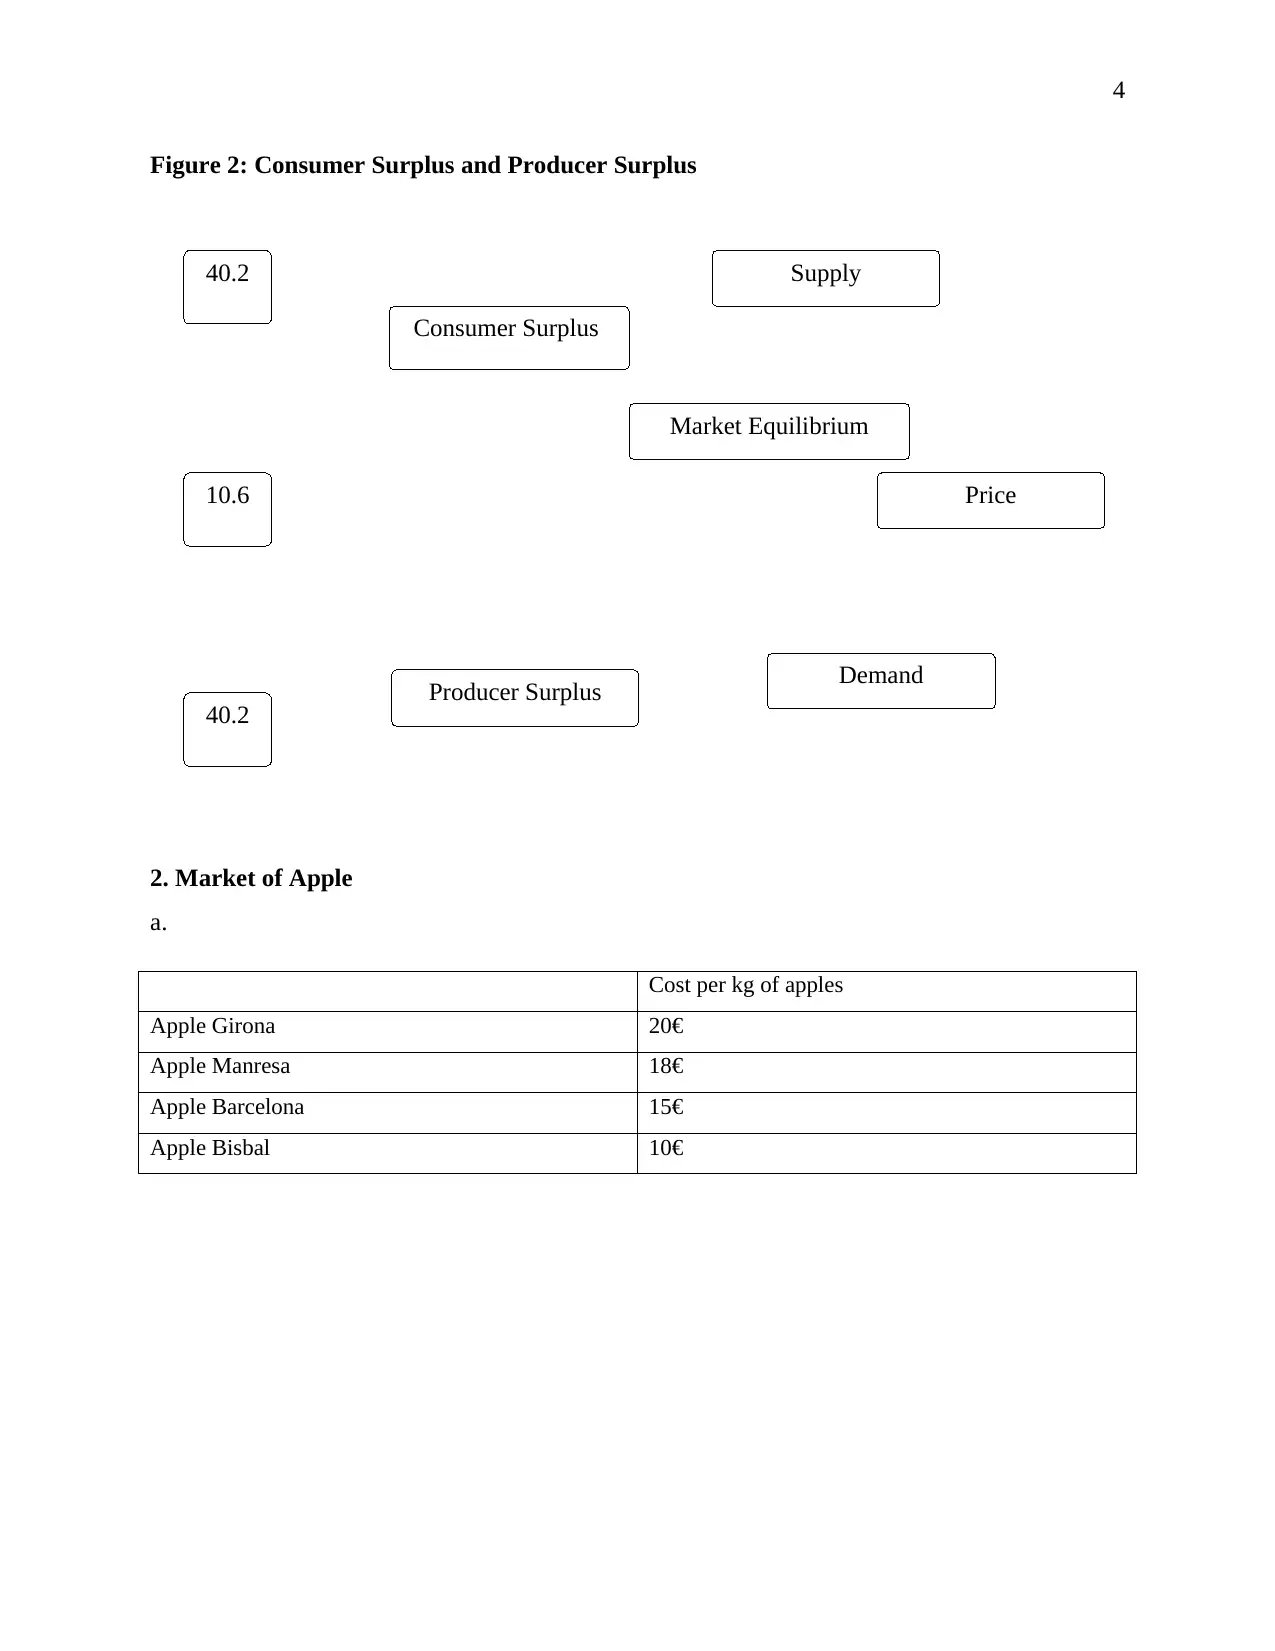
This microeconomics assignment examines the concepts of demand and supply, market equilibrium, and consumer/producer surplus. The assignment begins by calculating the equilibrium price and quantity using given demand and supply equations. It then calculates consumer and producer surpluses. The second part of the assignment presents a case study of the apple market, analyzing the stepped supply curve and determining producer surplus at different price points. The assignment provides detailed calculations and explanations of the concepts discussed, offering a comprehensive analysis of market dynamics. This assignment is contributed to Desklib, a platform providing AI-based study tools for students.
Document Page
1
Microeconomics
tabler-icon-diamond-filled.svg

Paraphrase This Document

Need a fresh take? Get an instant paraphrase of this document with our AI Paraphraser
Document Page
Supply
Demand
Price
Market Equilibrium
10.6
40.2
40.2
2
1. Demand and Supply
In a market, demand and supply is illustrated with the help of two equations such as
Qd = 72 – 3P
Qs = -34 + 7P
Figure 1: Market Equilibrium
a.
The market equilibrium takes place at the intersection of the demand and the supply curve.
b. In equilibrium Qd is equal to Qs
As a result,
72 – 3p = -34 + 7P
-3p – 7p = -34 – 72
-10p = -106
Document Page
3
10p = 106
P = 10.6
Hence, the equilibrium price will be 10.6. However, the equilibrium quantity will be
Qd = Qs = 72 – 3P = 72 – 3(10.6) = 72 – 31.8
40.2 = Q
c. The consumer surplus is defined as the measurement to compute the surplus that the customers
are eager to pay for a commodity as opposed to its market price (Cowan, 2012). On the other
hand, producer surplus is a difference between the amounts that a supplier desires to supply as
compared to the amount he receives while trading (Hofmann and Oldehaver, 2016). In this case,
the market price is equal to the equilibrium price at 10.6.
Consumer Surplus = ½ * (40.2 – 10.6) * 100
½ * 29.6 * 100
1480
Producer Surplus = ½ * (40.2 – 10.6) * 100
½ * 29.6 * 100
1480
Document Page
Supply
Demand
Price
Market Equilibrium
10.6
40.2
40.2
Producer Surplus
Consumer Surplus
4
Figure 2: Consumer Surplus and Producer Surplus
2. Market of Apple
a.
Cost per kg of apples
Apple Girona 20
Apple Manresa 18
Apple Barcelona 15
Apple Bisbal 10
tabler-icon-diamond-filled.svg

Paraphrase This Document

Need a fresh take? Get an instant paraphrase of this document with our AI Paraphraser
Document Page
20€
18€
15€
10€
1kg 2kgs 3kgs 4kgs
5
The diagram shows stepped supply of apples.
b. If the price of apple is at 16€, a total of 2.5 per kgs of apple will be sold.
Producer Surplus = ½*(16€ - 15€)*100
½ * € *100
50€
c. If the price decreases to 12€, the total apples that will be sold will be 3.6 per kgs.
Producer Surplus = ½*(15€ - 12€)*100
½ *3€ *100
150€
The producer surplus will increase by 100€.
Document Page
6
References
Cowan, S., 2012. ThirdDegree Price Discrimination and Consumer Surplus. The Journal of
Industrial Economics, 60(2), pp.333-345.
Hofmann, A. and Oldehaver, G., 2016. Vertically linked industries, product quality and
minimum quality standards. German Economic Review, 17(1), pp.92-103.
chevron_up_icon
1 out of 6
circle_padding
hide_on_mobile
zoom_out_icon
[object Object]