Economics Assignment: Course ID, Analyzing Water, Pizza, and Sugar Tax
VerifiedAdded on 2021/05/31
|12
|2176
|37
Homework Assignment
AI Summary
This economics assignment delves into three key areas of microeconomics. Firstly, it examines the impact of increased water demand on price and the elasticity of demand, including the effects of an excise tax on water suppliers. Secondly, it analyzes pizza production costs, including fixed, variable, marginal, and average costs, and explores returns to scale. Finally, the assignment investigates the economic effects of a sugar tax on sugary drinks, discussing its potential to reduce obesity, the elasticity of demand for soft drinks, and alternative intervention strategies like community-based programs and awareness campaigns, while also considering the arguments against such taxes and their limitations. The assignment uses figures and tables to illustrate economic concepts and includes a comprehensive reference list.
Running Head: ECONOMICS ASSIGNMENT
Economics Assignment
Name of the Student
Name of the University
Course ID
Economics Assignment
Name of the Student
Name of the University
Course ID
Paraphrase This Document
Need a fresh take? Get an instant paraphrase of this document with our AI Paraphraser
1ECONOMICS ASSIGNMENT
Table of Contents
Answer 1..........................................................................................................................................2
Answer a......................................................................................................................................2
Answer b......................................................................................................................................2
Answer c......................................................................................................................................3
Answer 2..........................................................................................................................................4
Answer a......................................................................................................................................4
Answer b......................................................................................................................................5
Answer c......................................................................................................................................6
Answer d......................................................................................................................................6
Answer 3..........................................................................................................................................6
Reference list.................................................................................................................................10
2ECONOMICS ASSIGNMENT
Answer 1
Answer a
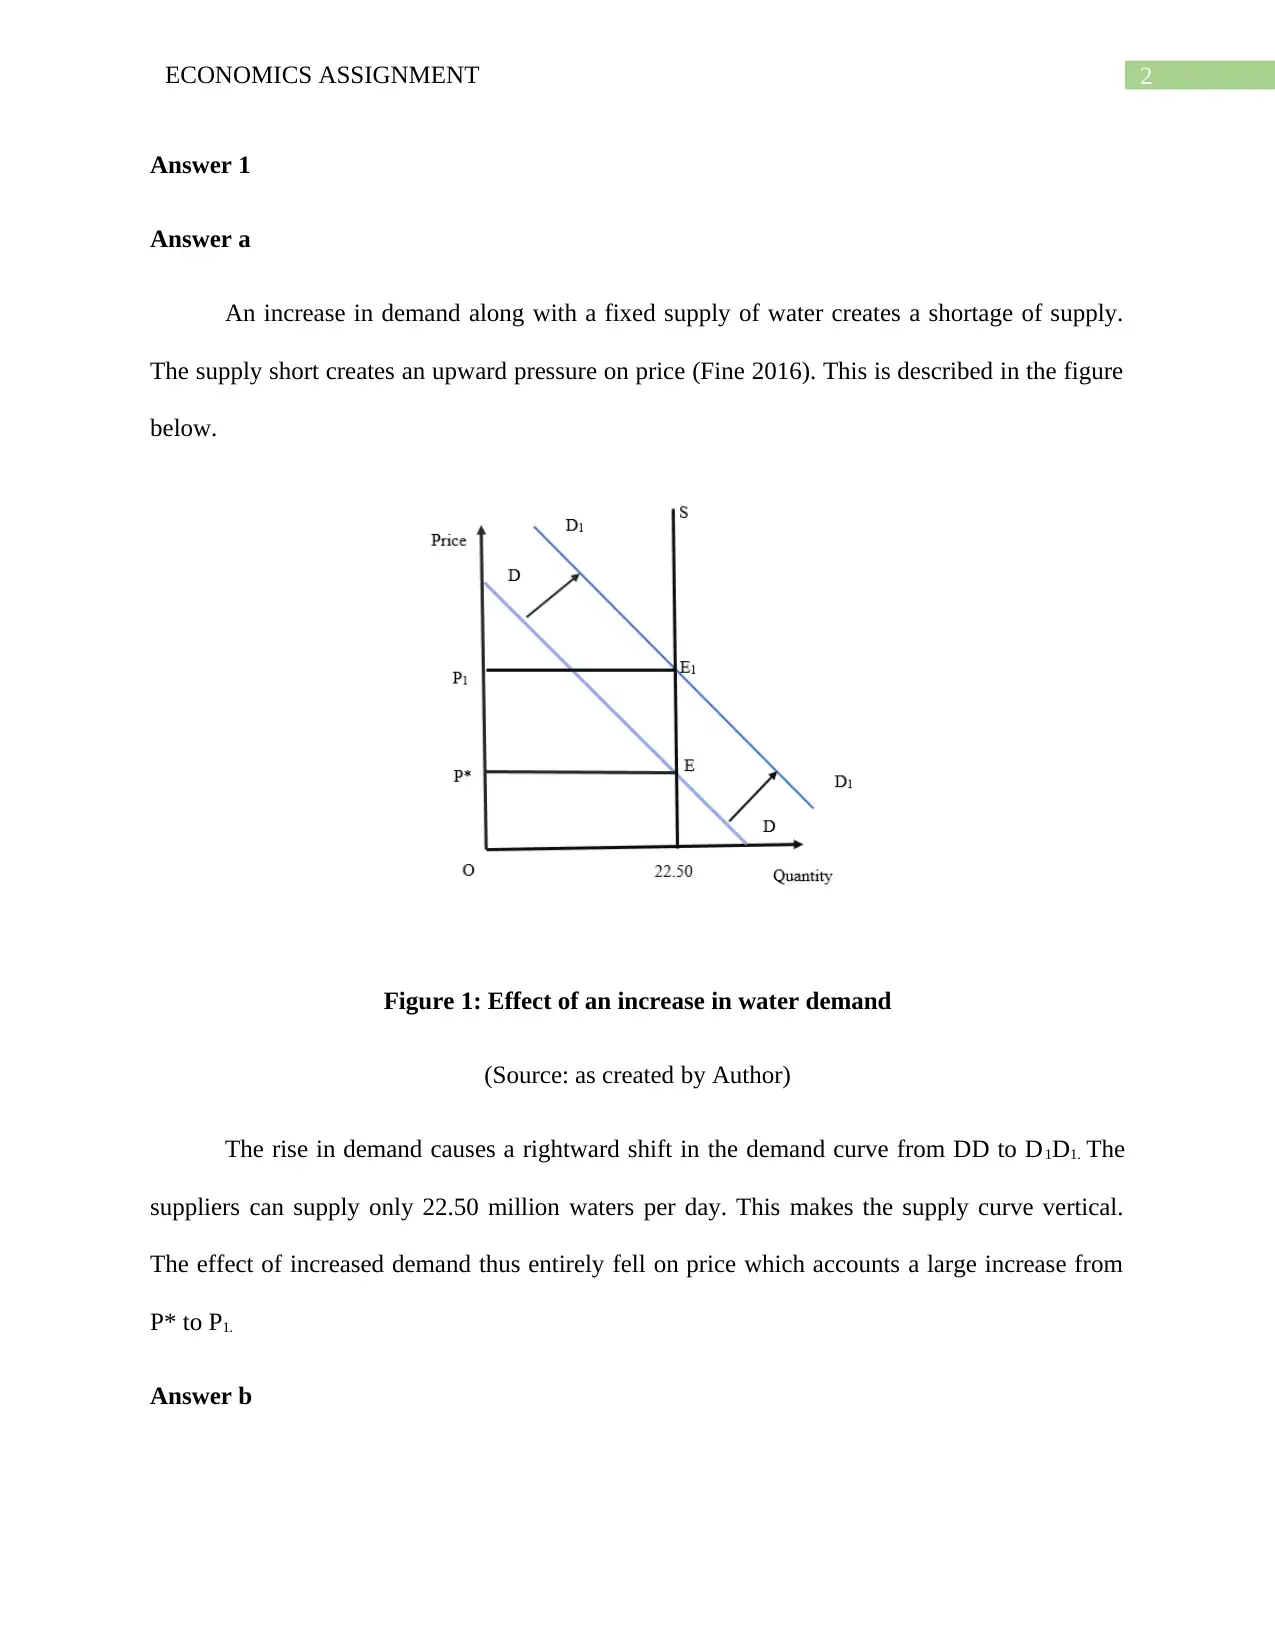
An increase in demand along with a fixed supply of water creates a shortage of supply.
The supply short creates an upward pressure on price (Fine 2016). This is described in the figure
below.
Figure 1: Effect of an increase in water demand
(Source: as created by Author)
The rise in demand causes a rightward shift in the demand curve from DD to D1D1. The
suppliers can supply only 22.50 million waters per day. This makes the supply curve vertical.
The effect of increased demand thus entirely fell on price which accounts a large increase from
P* to P1.
Answer b
Answer 1
Answer a
An increase in demand along with a fixed supply of water creates a shortage of supply.
The supply short creates an upward pressure on price (Fine 2016). This is described in the figure
below.
Figure 1: Effect of an increase in water demand
(Source: as created by Author)
The rise in demand causes a rightward shift in the demand curve from DD to D1D1. The
suppliers can supply only 22.50 million waters per day. This makes the supply curve vertical.
The effect of increased demand thus entirely fell on price which accounts a large increase from
P* to P1.
Answer b
⊘ This is a preview!⊘
Do you want full access?
Subscribe today to unlock all pages.
Trusted by 1+ million students worldwide
3ECONOMICS ASSIGNMENT
Water being one of the basic necessity generally has an inelastic demand. Even with a
higher price people cannot adjust their demand for water much. The water however is used for
various purposes. A good that have several alternative uses has a greater flexibility in demand.
When price of water rises to a very high level people stop wastage of water and reduce use of
water as much as possible. This makes demand elastic after at certain price ranges (Cowen and
Tabarrok 2015). Another factor that might contribute to an increase in elasticity of residential
water is availability of water from alternative sources. If people find, it is less costly to obtain
water from some neighbored region then the residential water demand might become elastic at
certain price range.
Answer c
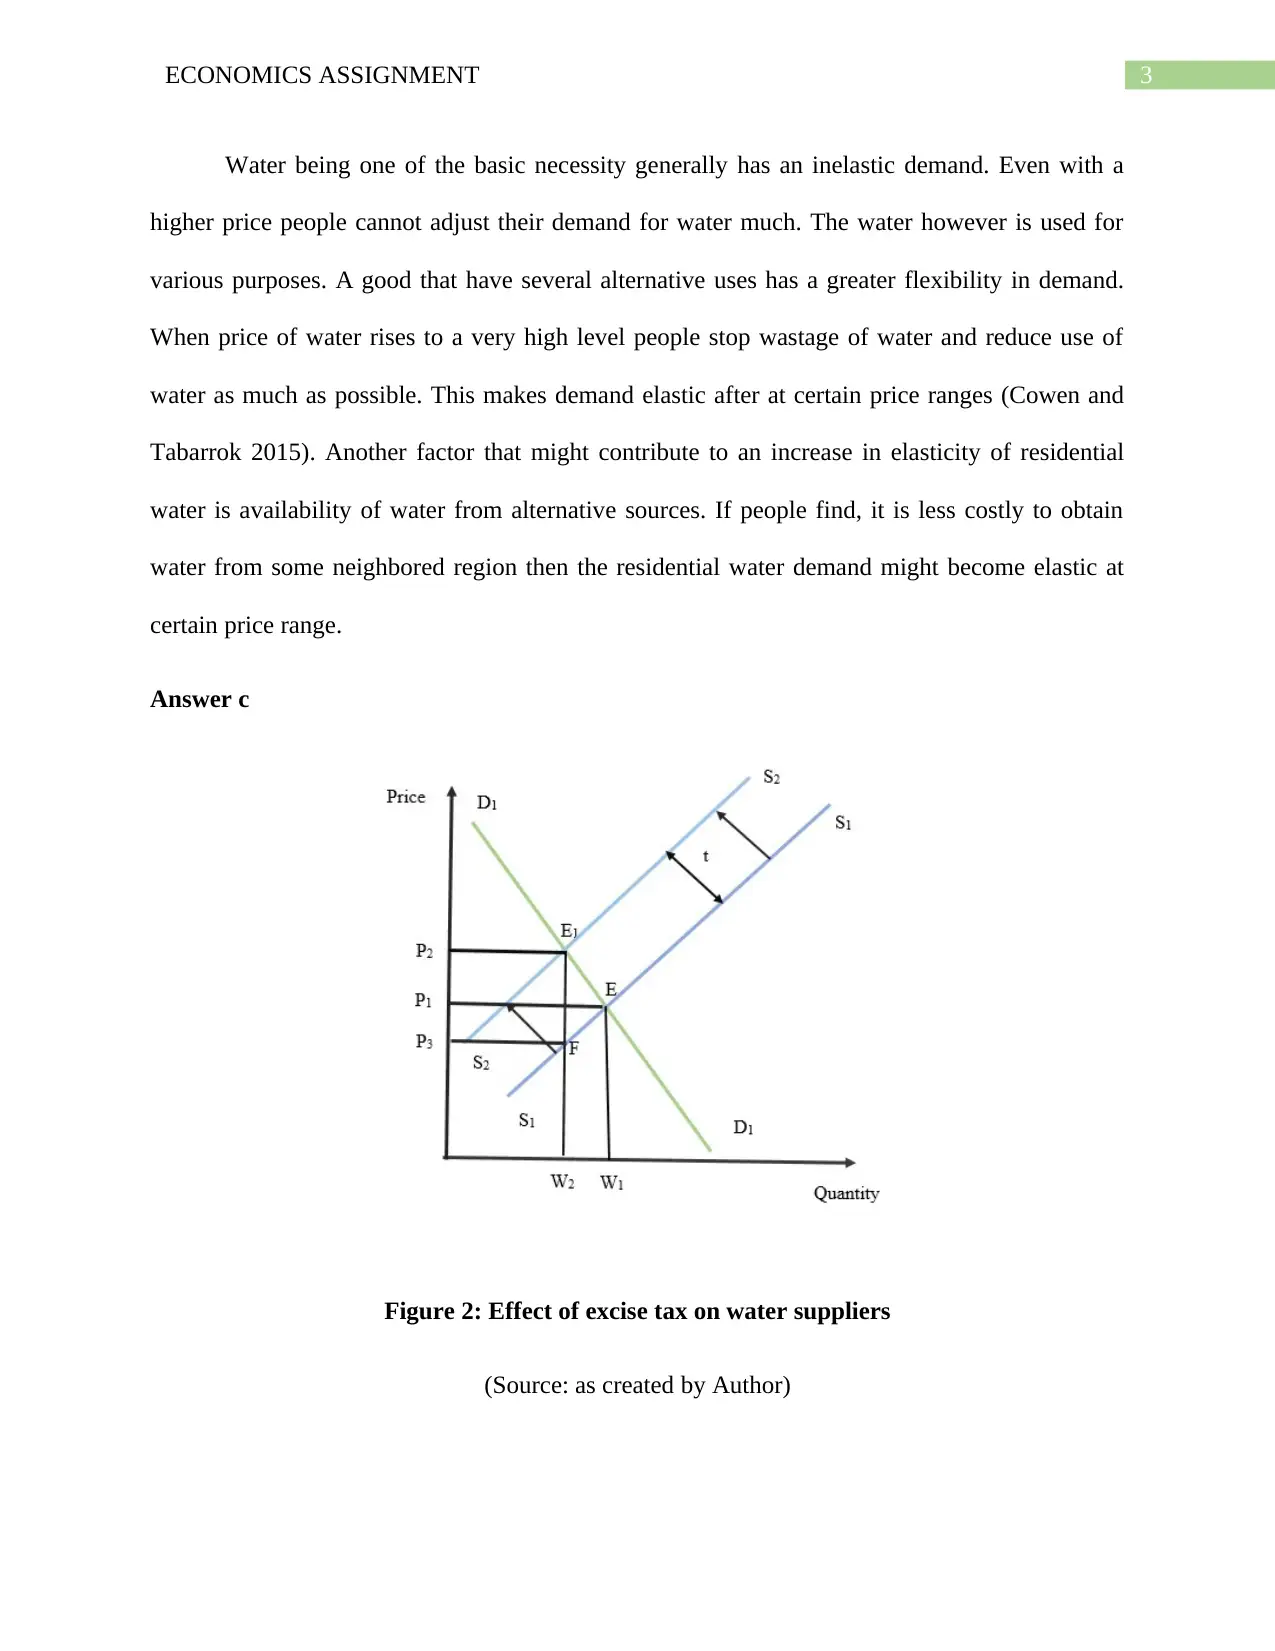
Figure 2: Effect of excise tax on water suppliers
(Source: as created by Author)
Water being one of the basic necessity generally has an inelastic demand. Even with a
higher price people cannot adjust their demand for water much. The water however is used for
various purposes. A good that have several alternative uses has a greater flexibility in demand.
When price of water rises to a very high level people stop wastage of water and reduce use of
water as much as possible. This makes demand elastic after at certain price ranges (Cowen and
Tabarrok 2015). Another factor that might contribute to an increase in elasticity of residential
water is availability of water from alternative sources. If people find, it is less costly to obtain
water from some neighbored region then the residential water demand might become elastic at
certain price range.
Answer c
Figure 2: Effect of excise tax on water suppliers
(Source: as created by Author)
Paraphrase This Document
Need a fresh take? Get an instant paraphrase of this document with our AI Paraphraser
4ECONOMICS ASSIGNMENT
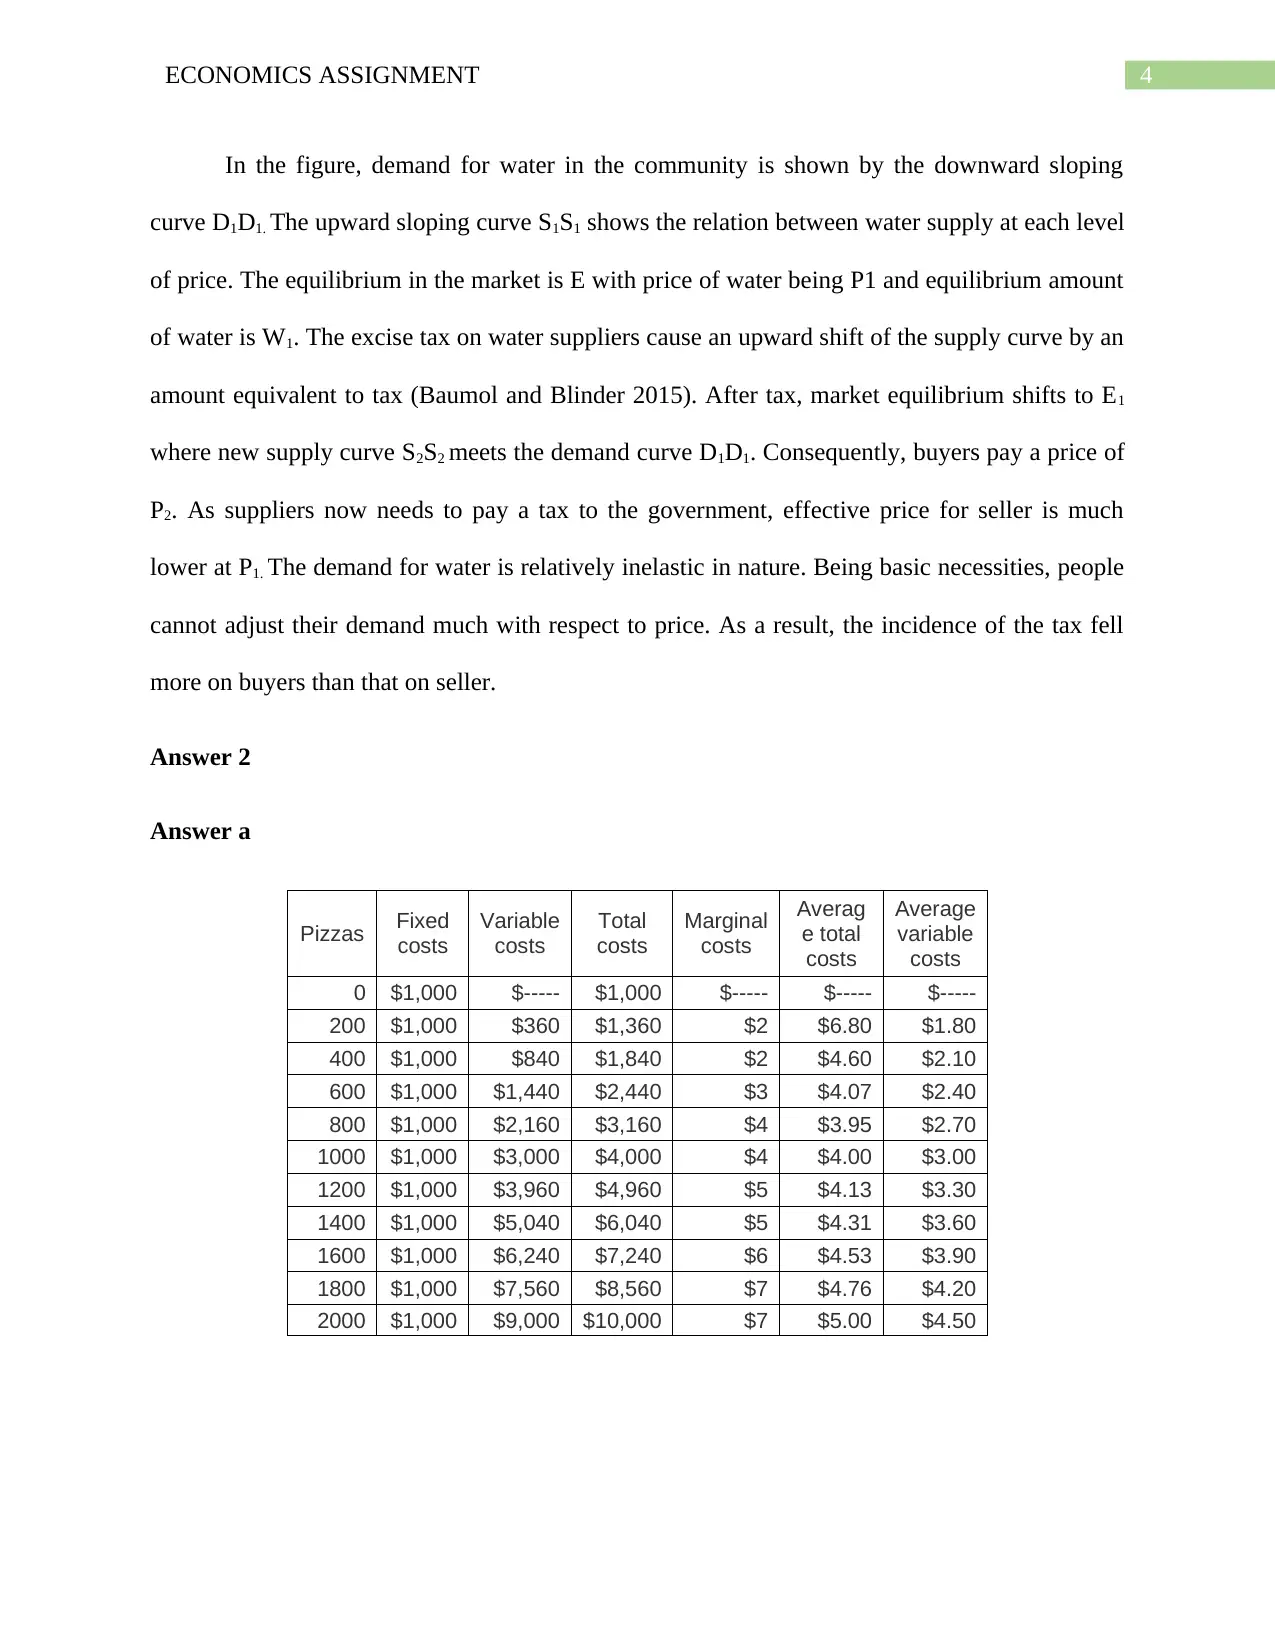
In the figure, demand for water in the community is shown by the downward sloping
curve D1D1. The upward sloping curve S1S1 shows the relation between water supply at each level
of price. The equilibrium in the market is E with price of water being P1 and equilibrium amount
of water is W1. The excise tax on water suppliers cause an upward shift of the supply curve by an
amount equivalent to tax (Baumol and Blinder 2015). After tax, market equilibrium shifts to E1
where new supply curve S2S2 meets the demand curve D1D1. Consequently, buyers pay a price of
P2. As suppliers now needs to pay a tax to the government, effective price for seller is much
lower at P1. The demand for water is relatively inelastic in nature. Being basic necessities, people
cannot adjust their demand much with respect to price. As a result, the incidence of the tax fell
more on buyers than that on seller.
Answer 2
Answer a
Pizzas Fixed
costs
Variable
costs
Total
costs
Marginal
costs
Averag
e total
costs
Average
variable
costs
0 $1,000 $----- $1,000 $----- $----- $-----
200 $1,000 $360 $1,360 $2 $6.80 $1.80
400 $1,000 $840 $1,840 $2 $4.60 $2.10
600 $1,000 $1,440 $2,440 $3 $4.07 $2.40
800 $1,000 $2,160 $3,160 $4 $3.95 $2.70
1000 $1,000 $3,000 $4,000 $4 $4.00 $3.00
1200 $1,000 $3,960 $4,960 $5 $4.13 $3.30
1400 $1,000 $5,040 $6,040 $5 $4.31 $3.60
1600 $1,000 $6,240 $7,240 $6 $4.53 $3.90
1800 $1,000 $7,560 $8,560 $7 $4.76 $4.20
2000 $1,000 $9,000 $10,000 $7 $5.00 $4.50
5ECONOMICS ASSIGNMENT
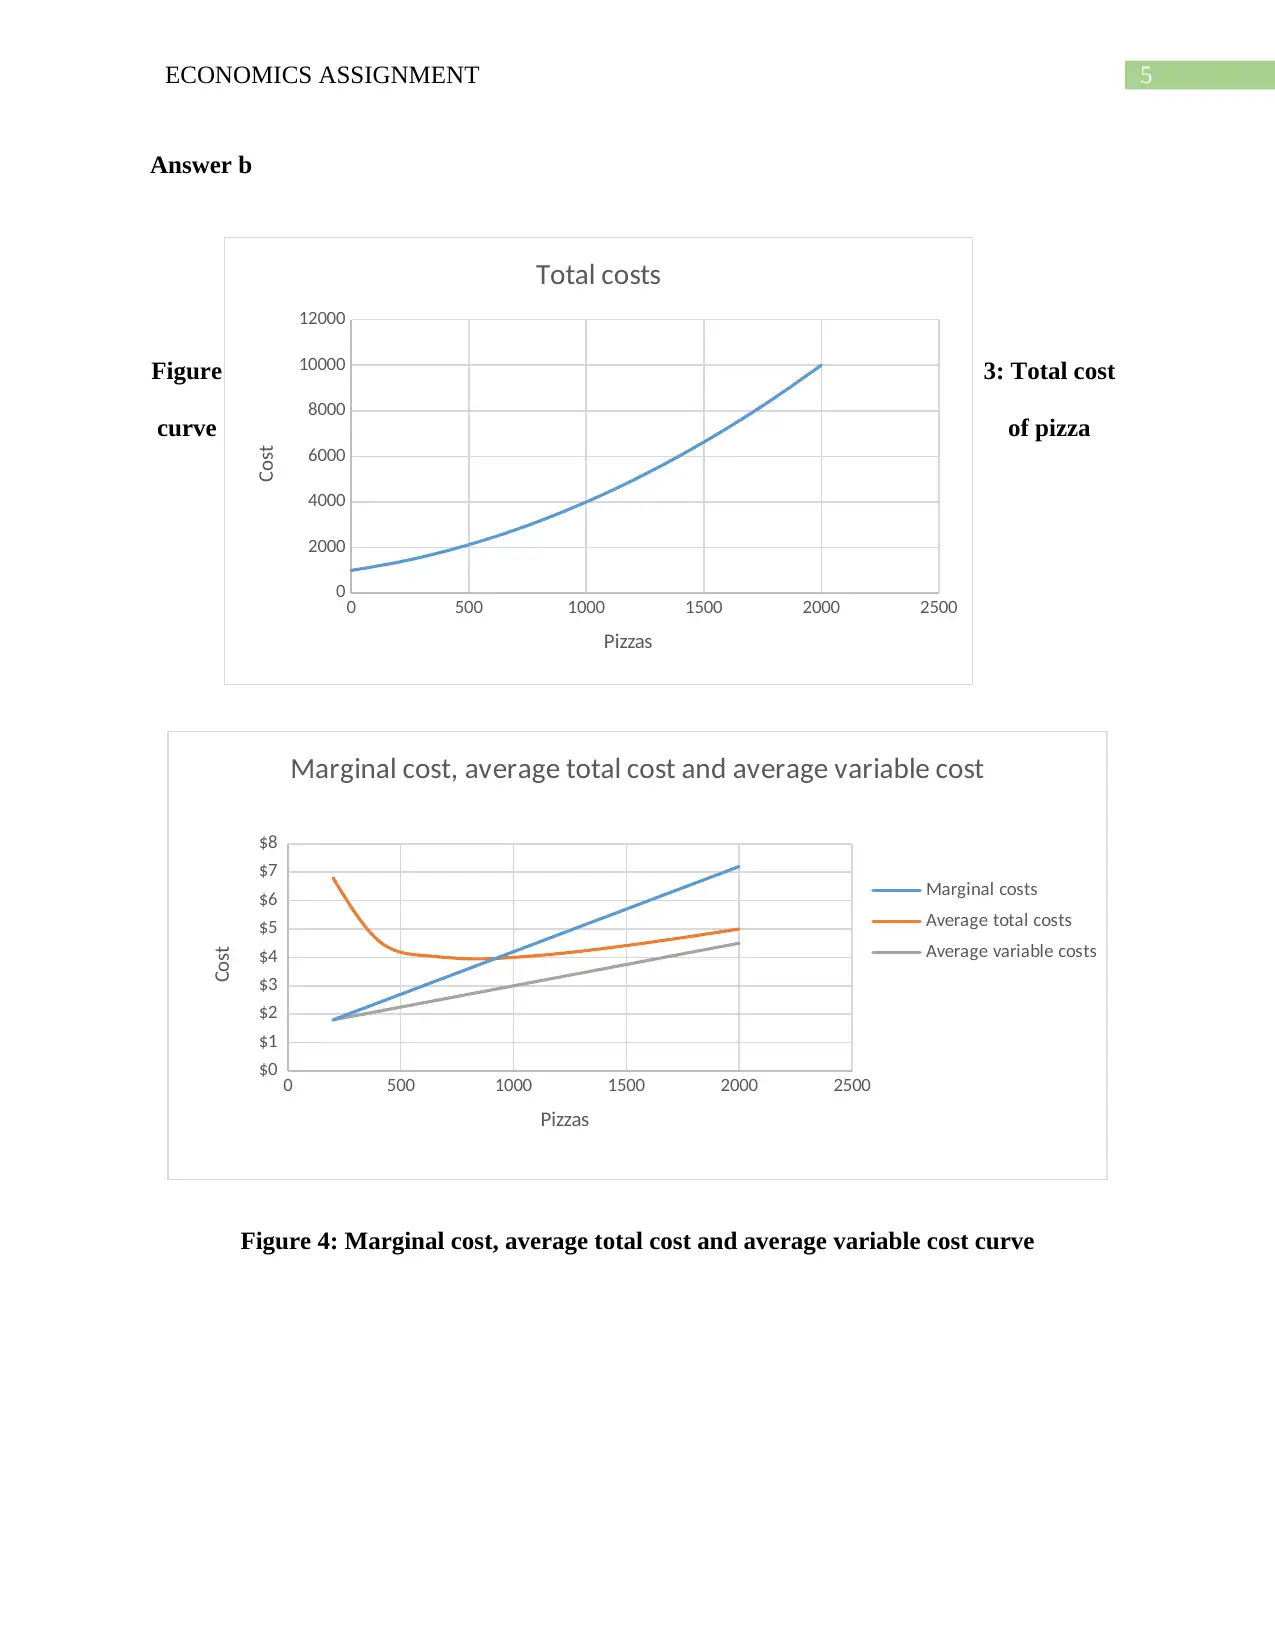
Answer b
Figure 3: Total cost
curve of pizza
0 500 1000 1500 2000 2500
$0
$1
$2
$3
$4
$5
$6
$7
$8
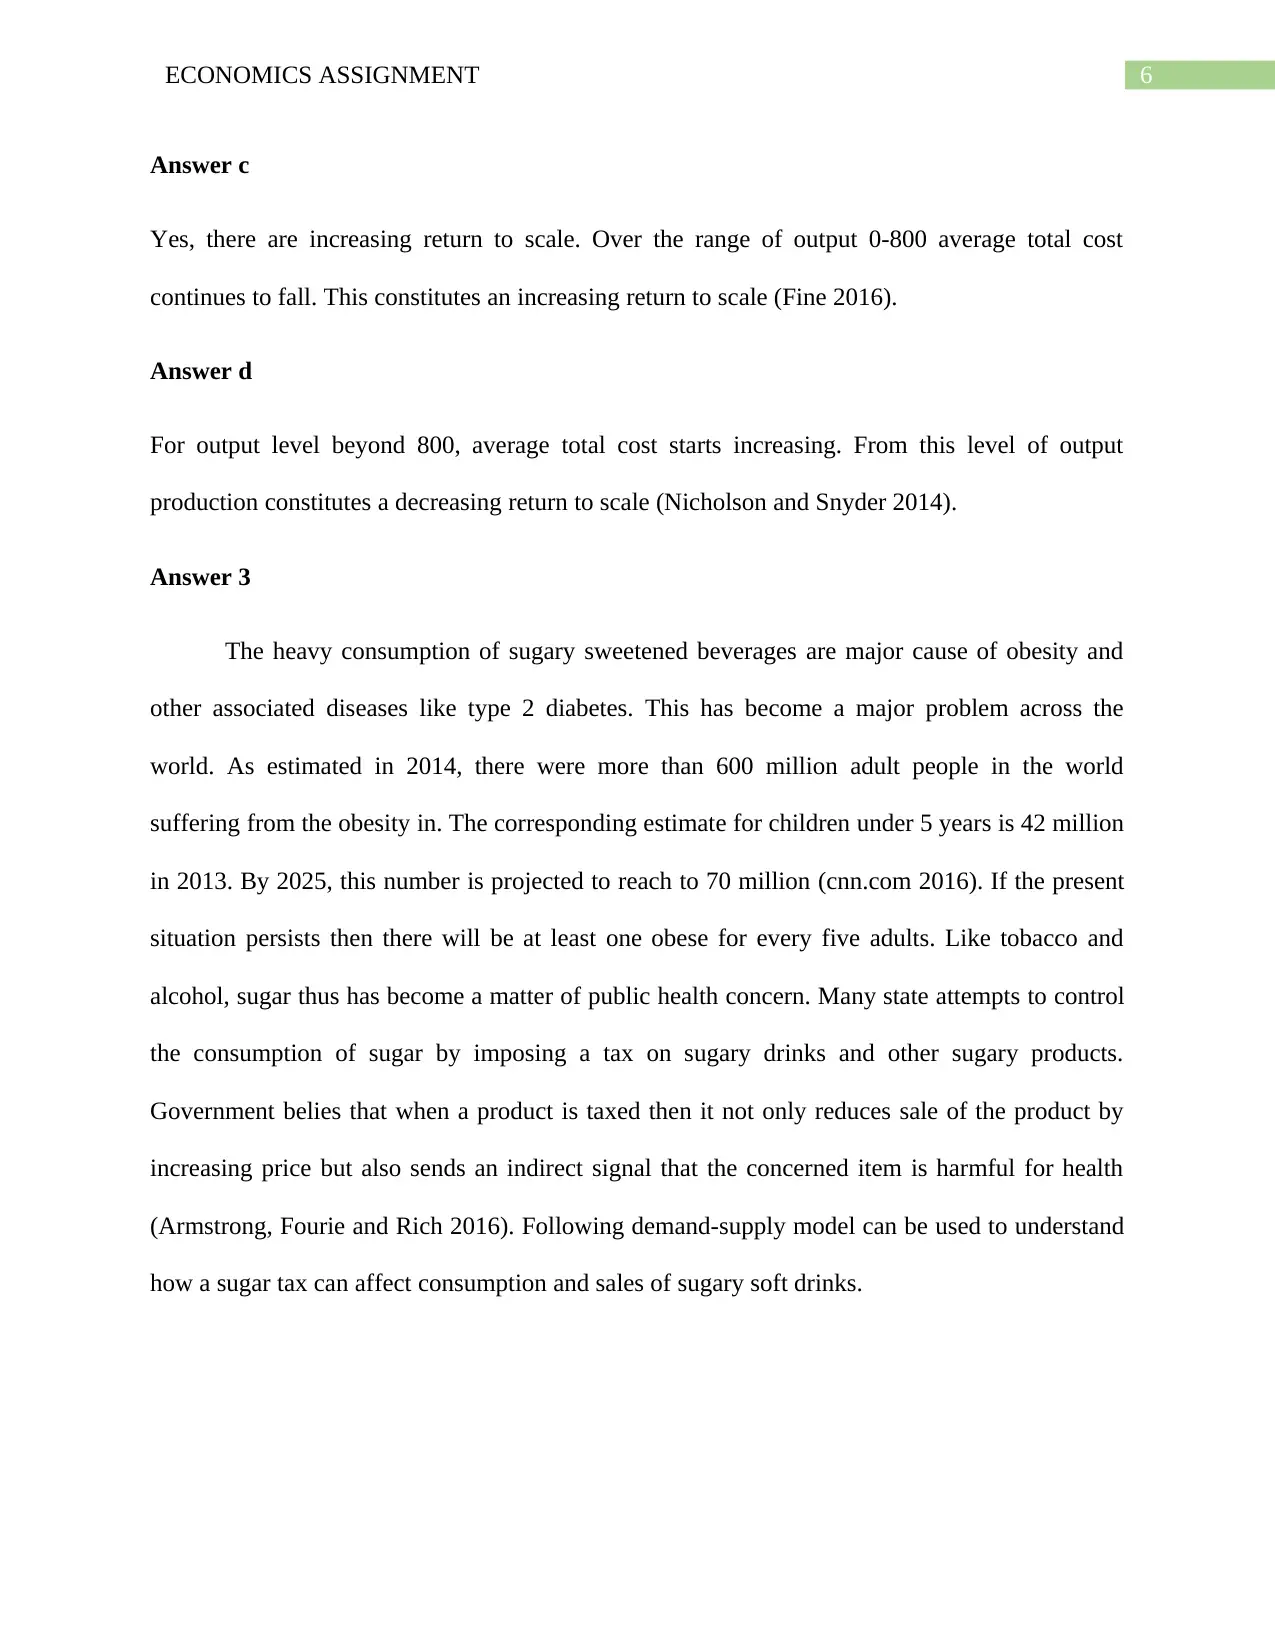
Marginal cost, average total cost and average variable cost
Marginal costs
Average total costs
Average variable costs
Pizzas
Cost
Figure 4: Marginal cost, average total cost and average variable cost curve
0 500 1000 1500 2000 2500
0
2000
4000
6000
8000
10000
12000
Total costs
Pizzas
Cost
Answer b
Figure 3: Total cost
curve of pizza
0 500 1000 1500 2000 2500
$0
$1
$2
$3
$4
$5
$6
$7
$8
Marginal cost, average total cost and average variable cost
Marginal costs
Average total costs
Average variable costs
Pizzas
Cost
Figure 4: Marginal cost, average total cost and average variable cost curve
0 500 1000 1500 2000 2500
0
2000
4000
6000
8000
10000
12000
Total costs
Pizzas
Cost
⊘ This is a preview!⊘
Do you want full access?
Subscribe today to unlock all pages.
Trusted by 1+ million students worldwide
6ECONOMICS ASSIGNMENT
Answer c
Yes, there are increasing return to scale. Over the range of output 0-800 average total cost
continues to fall. This constitutes an increasing return to scale (Fine 2016).
Answer d
For output level beyond 800, average total cost starts increasing. From this level of output
production constitutes a decreasing return to scale (Nicholson and Snyder 2014).
Answer 3
The heavy consumption of sugary sweetened beverages are major cause of obesity and
other associated diseases like type 2 diabetes. This has become a major problem across the
world. As estimated in 2014, there were more than 600 million adult people in the world
suffering from the obesity in. The corresponding estimate for children under 5 years is 42 million
in 2013. By 2025, this number is projected to reach to 70 million (cnn.com 2016). If the present
situation persists then there will be at least one obese for every five adults. Like tobacco and
alcohol, sugar thus has become a matter of public health concern. Many state attempts to control
the consumption of sugar by imposing a tax on sugary drinks and other sugary products.
Government belies that when a product is taxed then it not only reduces sale of the product by
increasing price but also sends an indirect signal that the concerned item is harmful for health
(Armstrong, Fourie and Rich 2016). Following demand-supply model can be used to understand
how a sugar tax can affect consumption and sales of sugary soft drinks.
Paraphrase This Document
Need a fresh take? Get an instant paraphrase of this document with our AI Paraphraser
7ECONOMICS ASSIGNMENT
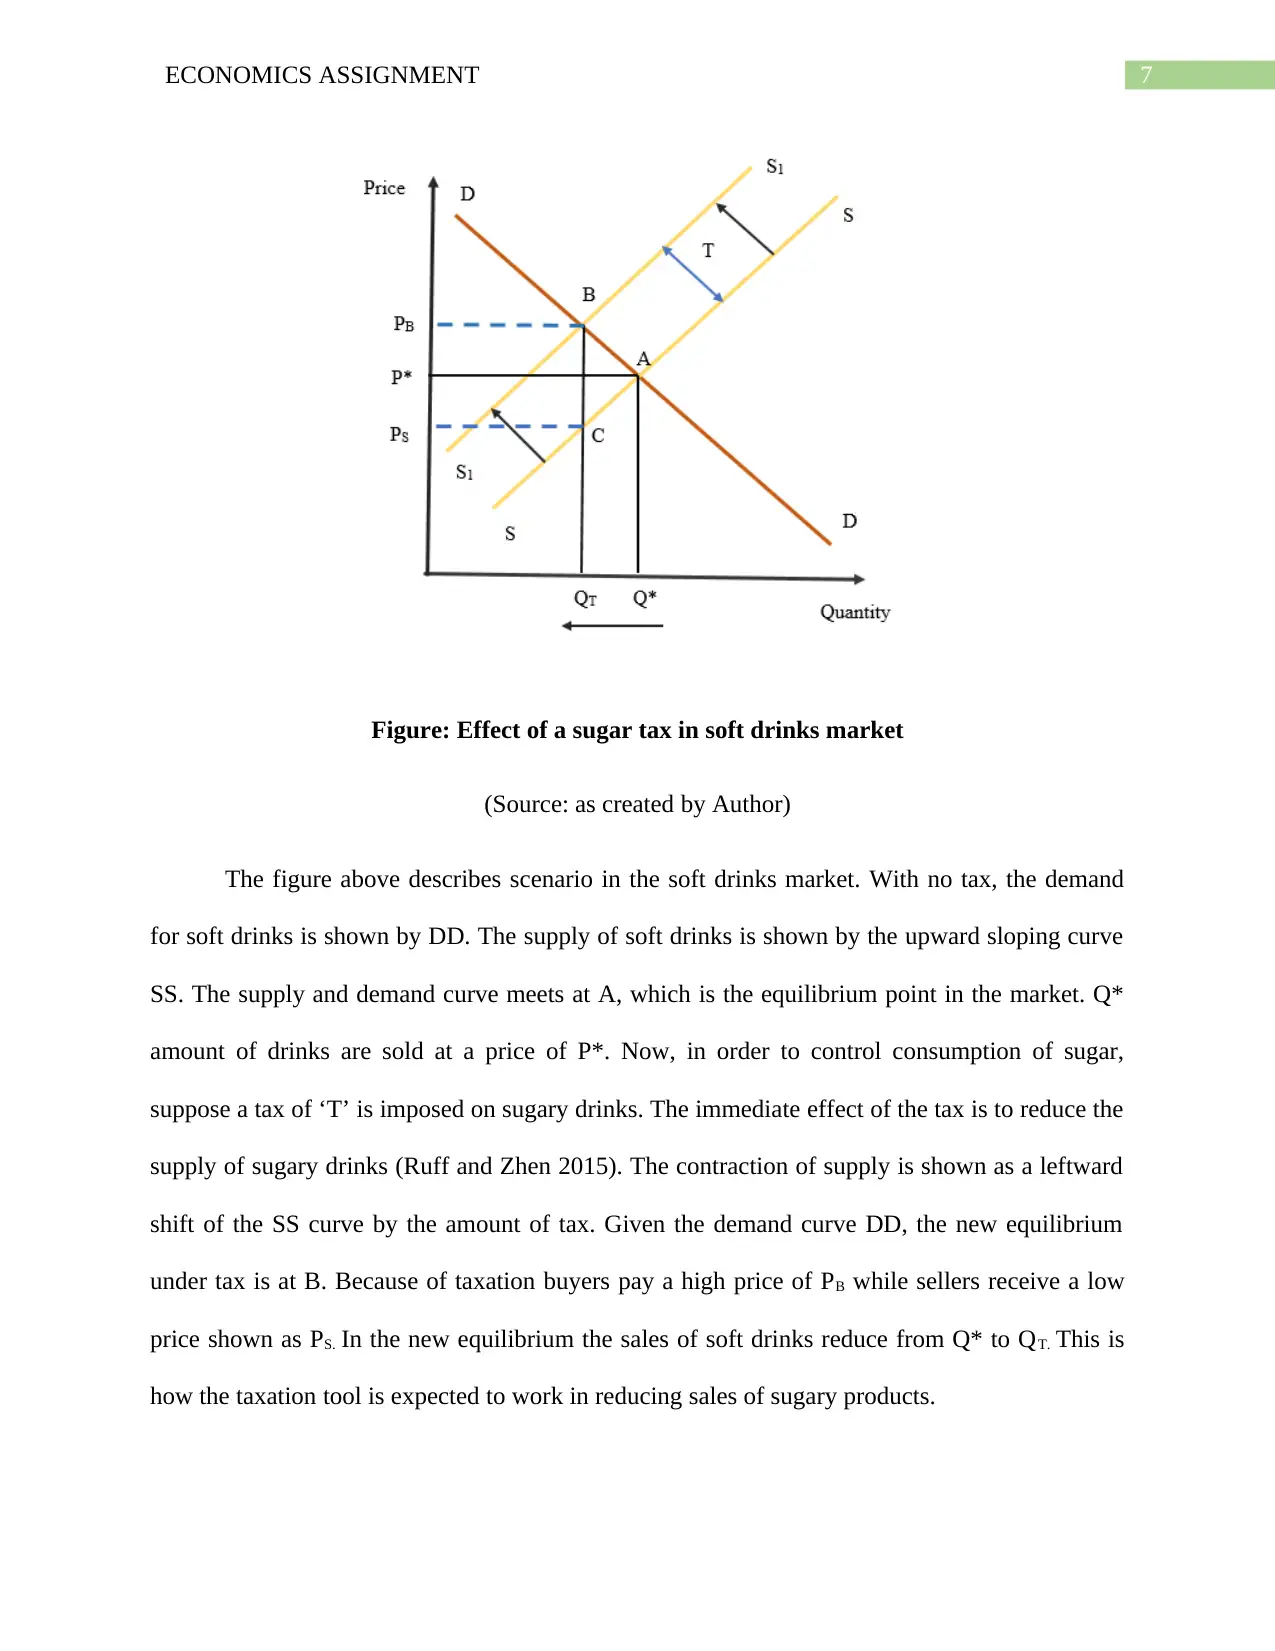
Figure: Effect of a sugar tax in soft drinks market
(Source: as created by Author)
The figure above describes scenario in the soft drinks market. With no tax, the demand
for soft drinks is shown by DD. The supply of soft drinks is shown by the upward sloping curve
SS. The supply and demand curve meets at A, which is the equilibrium point in the market. Q*
amount of drinks are sold at a price of P*. Now, in order to control consumption of sugar,
suppose a tax of ‘T’ is imposed on sugary drinks. The immediate effect of the tax is to reduce the
supply of sugary drinks (Ruff and Zhen 2015). The contraction of supply is shown as a leftward
shift of the SS curve by the amount of tax. Given the demand curve DD, the new equilibrium
under tax is at B. Because of taxation buyers pay a high price of PB while sellers receive a low
price shown as PS. In the new equilibrium the sales of soft drinks reduce from Q* to QT. This is
how the taxation tool is expected to work in reducing sales of sugary products.
8ECONOMICS ASSIGNMENT
In order to fully understand the effect of a sugar tax, the study of elasticity is important.
The incidence of tax and division of tax burden depends on the elasticity of soft drinks and other
sugary items. The elasticity of soft drinks in most of the cases is found to be price elastic. That is
demand is more sensitive to a change in price (Wordley et al. 2017). The elasticity though varies
across developing and developed nations, but overall the demand is price elastic. Studies found
that in Chile, price elasticity of demand is -1.37 while in Australia demand elasticity is estimated
to be -0.63 (theconversation.com 2018). One reason for soft drink demand to be price elastic is
the availability of substitute for sugary soft drinks. The cross price elasticity of demand for soft
drink or other sugar sweetened beverages is generally high. The elastic demand results in a larger
reduction in consumption following an increase in price after imposition of tax.
In order to reduce consumption of sugary drinks, the alternatives of taxation are
community based intervention programs and social awareness programs like health or education
campaign. The community based interventionist strategies aim to engage the whole community
in activities that can address the factors contributing to weight gain. Such strategies include
building playground or sport facilities, arranging counselling for families at risk and encouraging
overweight children to go visit doctor and others. Several countries have adapted obesity
prevention campaign to fight against obesity (Johnson 2017) In these campaign people are
informed in a humorous and thoughtful way that a one can of soft drinks can contain up to
sixteen pack of sugars. A combination of mass media campaign, regulation and policies could be
undertaken to prevent obesity. The awareness programs inform people about the problem of
obesity and identifies potential areas of changes in the lifestyle to restrict weight gain
(theguardian.com 2018). These policies as against taxation can reduce obesity without
imposition additional price burden or social distortion associated with tax.
⊘ This is a preview!⊘
Do you want full access?
Subscribe today to unlock all pages.
Trusted by 1+ million students worldwide
9ECONOMICS ASSIGNMENT
Several countries have already undertaken a policy of taxing sugary drinks. In 2013 for
example, Mexico implemented a 10% tax on sugar sweetened beverages. As a result of tax cost
of production of such products raised by 10%. A study by British journal has found that
following tax the purchase of sugary drinks decreased by 6% within the next year of tax
implementation. The tax raised the sales of substitute like water or non-tax beverages by 4%
(cnn.com 2016). The result of sugar tax though offers beneficial result in some countries, there is
another side of such policy. After tax, some people might switch to produce drinks at home. The
main problem with taxation is that it does not improve health condition of poor families rather
they become unhealthier and poorer than pre-tax situation. In 2011, Denmark imposed a tax on
saturated fats. The tax however failed to reduce the demand of targeted product group
(Nakhimovsky et al. 2016). The government therefore abolished the tax. The tax on sugary
drinks is often highly contested by the beverage industry group who fight against such tax. The
tax should be implemented in combination with awareness programs to fight against the mass
problem of obesity.
Paraphrase This Document
Need a fresh take? Get an instant paraphrase of this document with our AI Paraphraser
10ECONOMICS ASSIGNMENT
Reference list
Armstrong, P., Fourie, H. and Rich, E., 2016. The impact of a sugar tax on SSBs on the
prevalence of obesity. Research Note 41. Stellenbosch: ECONEX.
Baumol, W.J. and Blinder, A.S., 2015. Microeconomics: Principles and policy. Cengage
Learning.
Cowen, T. and Tabarrok, A., 2015. Modern Principles of Microeconomics. Palgrave Macmillan.
Davey, M. (2018). Sugar tax: why health experts want it but politicians and industry are
resisting. [online] the Guardian. Available at:
https://www.theguardian.com/australia-news/2018/jan/10/sugar-tax-why-health-experts-want-it-
but-politicians-and-industry-are-resisting [Accessed 5 May 2018].
Fine, B., 2016. Microeconomics. University of Chicago Press Economics Books.
Johnson, C., 2017. Taxing times over sugar. Australian Medicine, 29(3), p.10.
Nakhimovsky, S.S., Feigl, A.B., Avila, C., O’Sullivan, G., Macgregor-Skinner, E. and Spranca,
M., 2016. Taxes on sugar-sweetened beverages to reduce overweight and obesity in middle-
income countries: a systematic review. PloS one, 11(9), p.e0163358.
Nicholson, W. and Snyder, C.M., 2014. Intermediate microeconomics and its application.
Cengage Learning.
Ruff, R.R. and Zhen, C., 2015. Estimating the effects of a calorie-based sugar-sweetened
beverage tax on weight and obesity in New York City adults using dynamic loss models. Annals
of epidemiology, 25(5), pp.350-357.
11ECONOMICS ASSIGNMENT
Senthilingam, M. (2016). Can a sugar tax stop obesity?. [online] CNN. Available at:
https://edition.cnn.com/2016/08/31/health/sugar-tax-obesity/index.html [Accessed 5 May 2018].
The Conversation. (2018). Another day, another anti-obesity campaign, but will this one work?.
[online] Available at: https://theconversation.com/another-day-another-anti-obesity-campaign-
but-will-this-one-work-11724 [Accessed 5 May 2018].
Wordley, V., Lee, H., Lomazzi, M. and Bedi, R., 2017. The sugar tax–An opportunity to advance
oral health. British dental journal, 223(1), p.11.
⊘ This is a preview!⊘
Do you want full access?
Subscribe today to unlock all pages.
Trusted by 1+ million students worldwide
1 out of 12
Related Documents


Your All-in-One AI-Powered Toolkit for Academic Success.
+13062052269
info@desklib.com
Available 24*7 on WhatsApp / Email
![[object Object]](/_next/static/media/star-bottom.7253800d.svg)
Unlock your academic potential
Copyright © 2020–2026 A2Z Services. All Rights Reserved. Developed and managed by ZUCOL.