Microeconomics Assignment 2 - Analysis of Market Dynamics and Forces
VerifiedAdded on  2022/08/18
|6
|732
|12
Homework Assignment
AI Summary
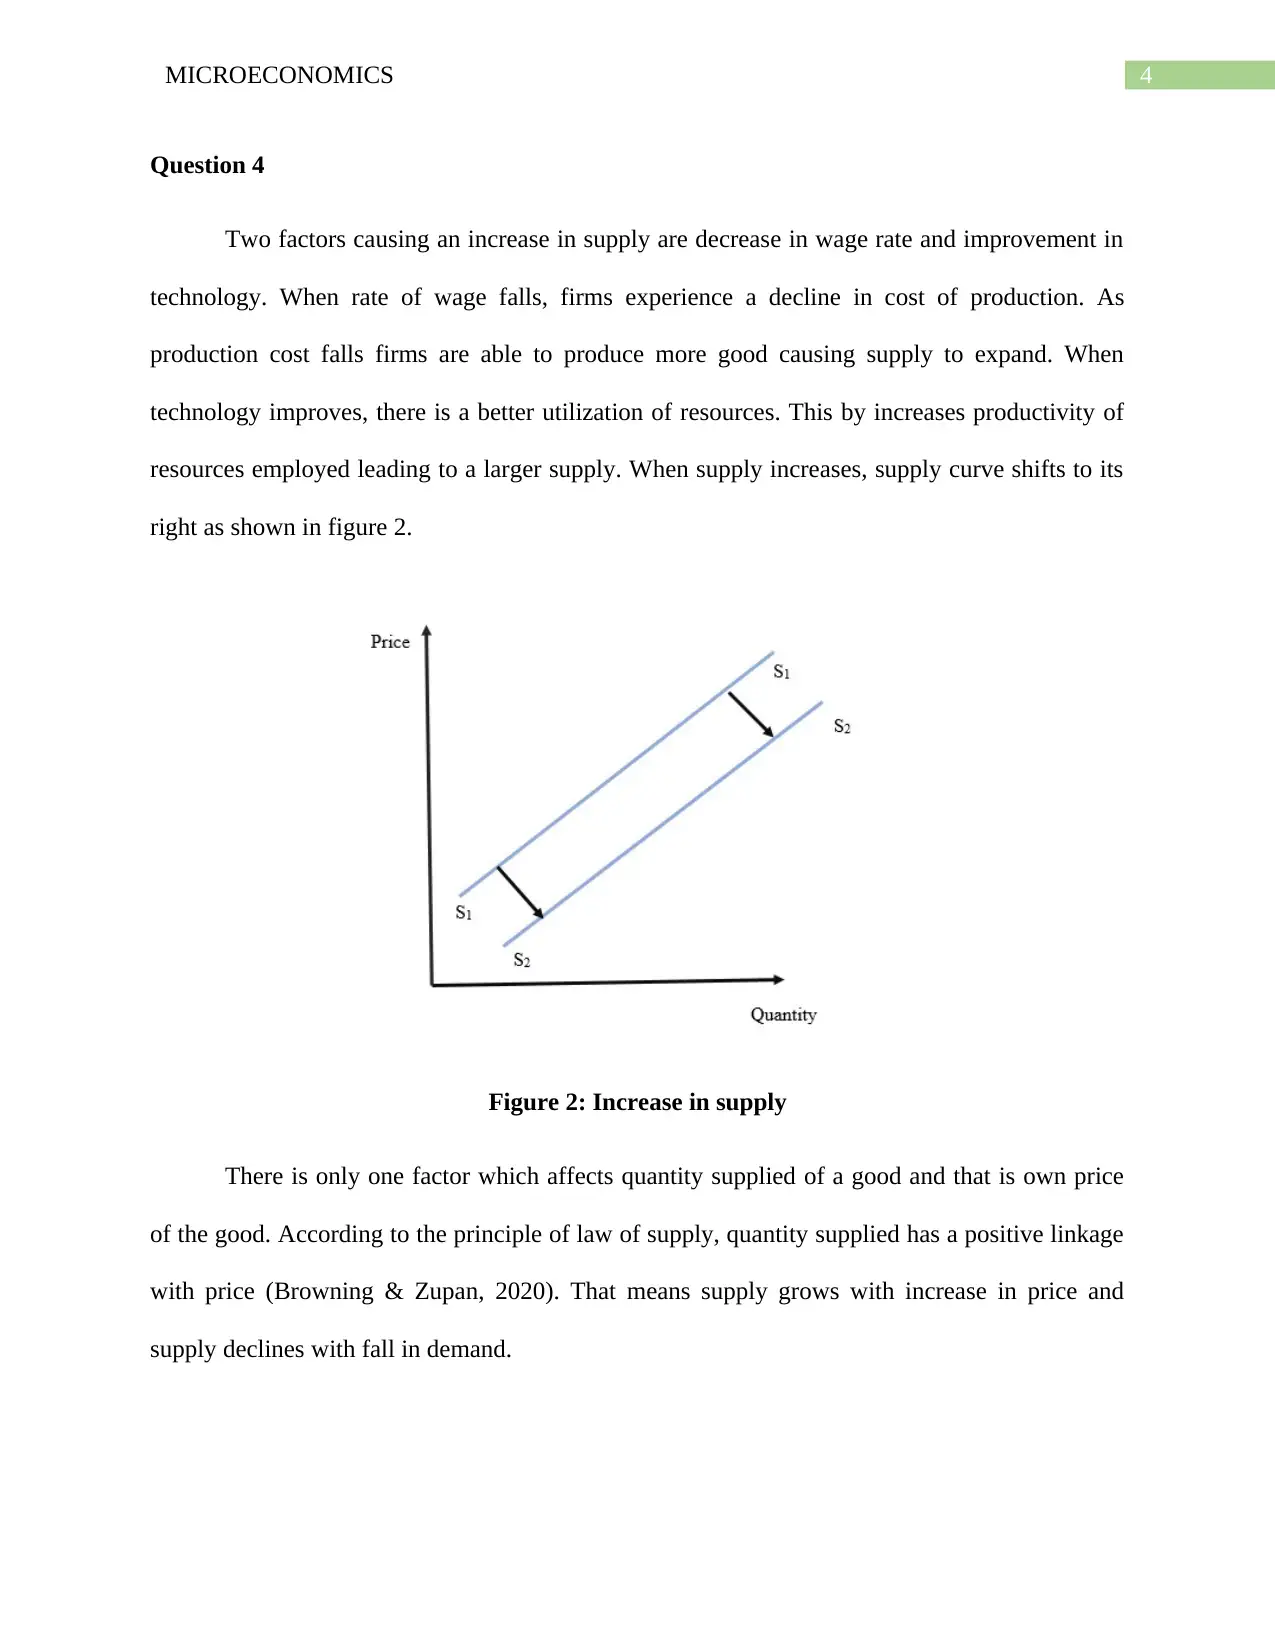
This microeconomics assignment analyzes key concepts of supply and demand, market equilibrium, and factors influencing price changes. The assignment includes the analysis of a scenario involving crop production, demonstrating the impact of supply-side factors on price fluctuations. It explores the concepts of change in quantity demanded versus change in demand, using examples like Christmas tree sales. The assignment also includes a table to determine the new equilibrium price and quantity of avocado oil. Furthermore, it discusses factors causing an increase in supply, such as wage rates and technological advancements. The assignment provides graphical representations to illustrate shifts in demand and supply curves, enhancing the understanding of market dynamics and economic principles.

Running head: MICROECONOMICS
Microeconomics
Name of the Student
Name of the University
Course ID
Microeconomics
Name of the Student
Name of the University
Course ID
Paraphrase This Document
Need a fresh take? Get an instant paraphrase of this document with our AI Paraphraser

1MICROECONOMICS
Table of Contents
Question 1........................................................................................................................................2
Question a....................................................................................................................................2
Question b....................................................................................................................................2
Question 2........................................................................................................................................2
Question a....................................................................................................................................2
Question b....................................................................................................................................3
Question 3........................................................................................................................................3
Question 4........................................................................................................................................4
References........................................................................................................................................5

2MICROECONOMICS
Question 1
Question a
From the given table it is obtained that equilibrium as determined from the forces of
demand and supply was settled at a price of $8.00 per kg and that of quantity of 165 million of
tonnes crops per year. In the next year, price falls to $6.00 while equilibrium quantity increases
to 175 million of tonnes. This suggests an increase in supply forces over the demand. The excess
supply lowers equilibrium price while increases equilibrium quantity.
Question b
The supply side factors are responsible for a price change in this example. The favorable
weather condition contributes to an increase in crop production which in turn causes an increase
in supply and lowers price (Cowell, 2018). Along with favorable weather supply may be increase
due to fall in price of other inputs used in crop production.
Question 2
Question a
Price in
dollars
Quantity
Demanded
Quantity
Demanded 2
Quantity
Supplied
Quantity
Supplied 2
1 90 100 10 40
2 80 90 20 50
3 70 80 30 60
4 60 70 40 70
5 50 60 50 80
6 40 50 60 90
7 30 40 70 100
8 20 30 80 110
⊘ This is a preview!⊘
Do you want full access?
Subscribe today to unlock all pages.

Trusted by 1+ million students worldwide

3MICROECONOMICS
Question b
With changes in demanded and supplies quantity, the market for avocado oil will attain a
new equilibrium. New equilibrium corresponds to the point where new quantity demanded
matches with new supplied quantity (Mankiw, 2020). From the above table, it is observed that at
a price of 4 dollars both quantity supplied and quantity demanded of avocado is 70. Therefore,
the new equilibrium quantity of avocado oil is 70 and the new equilibrium price of avocado oil is
$4.
Question 3
When demand for a good change because of a change in own price of the good given all
other determinant factors, it is called change in quantity demanded. On the other hand, when
demand change is caused by factors other than own price such as income, tastes and preferences,
price of related goods and others then it is known as change in demand. In the holiday season
during Christmas both quantity demanded of Christmas tree and price of Christmas tree
increases. The increase in price here is the result of increase in quantity demanded for Christmas
indicating a change in demand (Kolmar, 2017). The increase in demand here shifts the demand
curve right leading to an increase in price of Christmas tree as shown in the figure below.
Figure 1: Increase in demand of Christmas tree
Paraphrase This Document
Need a fresh take? Get an instant paraphrase of this document with our AI Paraphraser

4MICROECONOMICS
Question 4
Two factors causing an increase in supply are decrease in wage rate and improvement in
technology. When rate of wage falls, firms experience a decline in cost of production. As
production cost falls firms are able to produce more good causing supply to expand. When
technology improves, there is a better utilization of resources. This by increases productivity of
resources employed leading to a larger supply. When supply increases, supply curve shifts to its
right as shown in figure 2.
Figure 2: Increase in supply
There is only one factor which affects quantity supplied of a good and that is own price
of the good. According to the principle of law of supply, quantity supplied has a positive linkage
with price (Browning & Zupan, 2020). That means supply grows with increase in price and
supply declines with fall in demand.

5MICROECONOMICS
References
Browning, E. K., & Zupan, M. A. (2020). Microeconomics: Theory and Applications. John
Wiley & Sons.
Cowell, F. (2018). Microeconomics: principles and analysis. Oxford University Press.
Kolmar, M. (2017). Principles of Microeconomics. Springer International Publishing.
Mankiw, N. G. (2020). Principles of microeconomics. Cengage Learning.
⊘ This is a preview!⊘
Do you want full access?
Subscribe today to unlock all pages.

Trusted by 1+ million students worldwide
1 out of 6
Related Documents

Your All-in-One AI-Powered Toolkit for Academic Success.
 +13062052269
info@desklib.com
Available 24*7 on WhatsApp / Email
Unlock your academic potential
Copyright © 2020–2025 A2Z Services. All Rights Reserved. Developed and managed by ZUCOL.