Microeconomics Assignment - Module 2: Demand, Elasticity, and Wages

Verified

Added on  2022/10/10

|5
|1004
|68
Homework Assignment
AI Summary
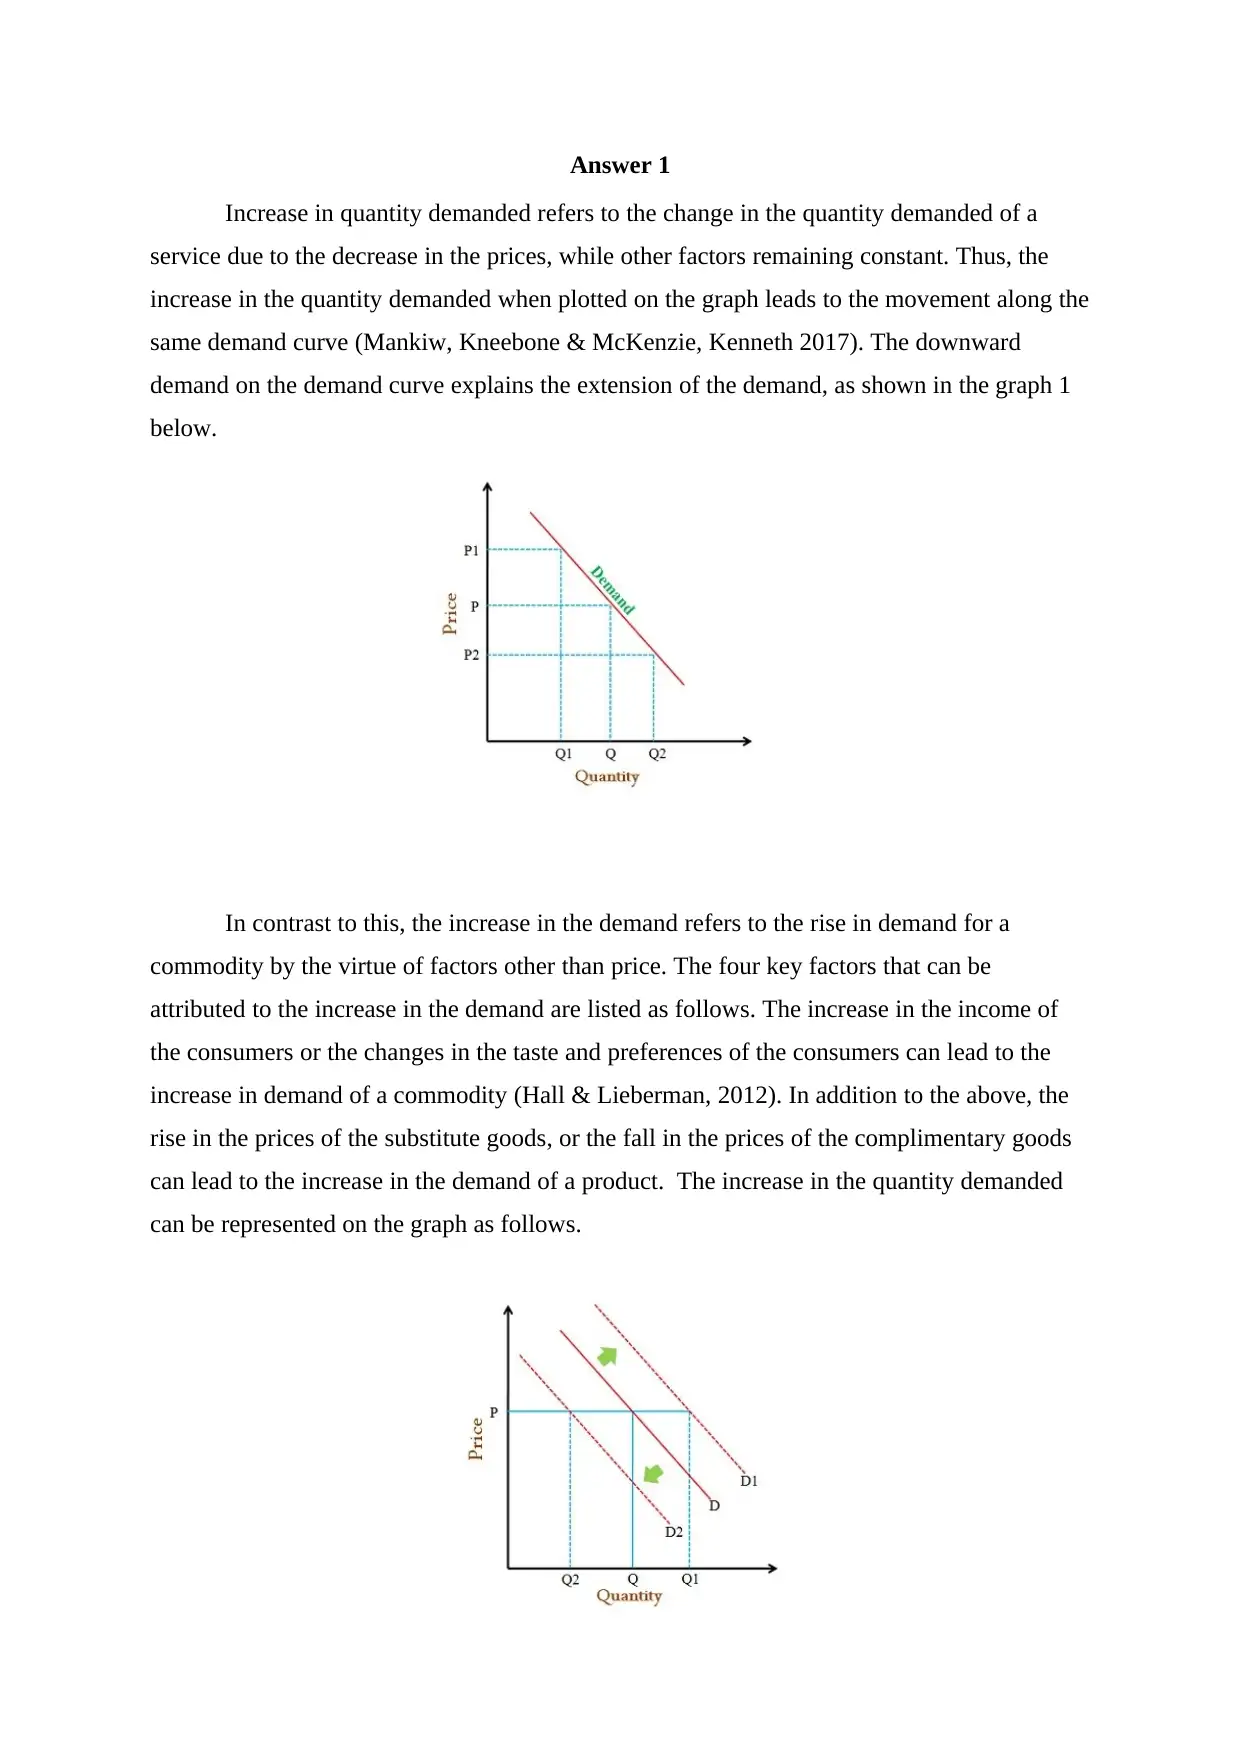
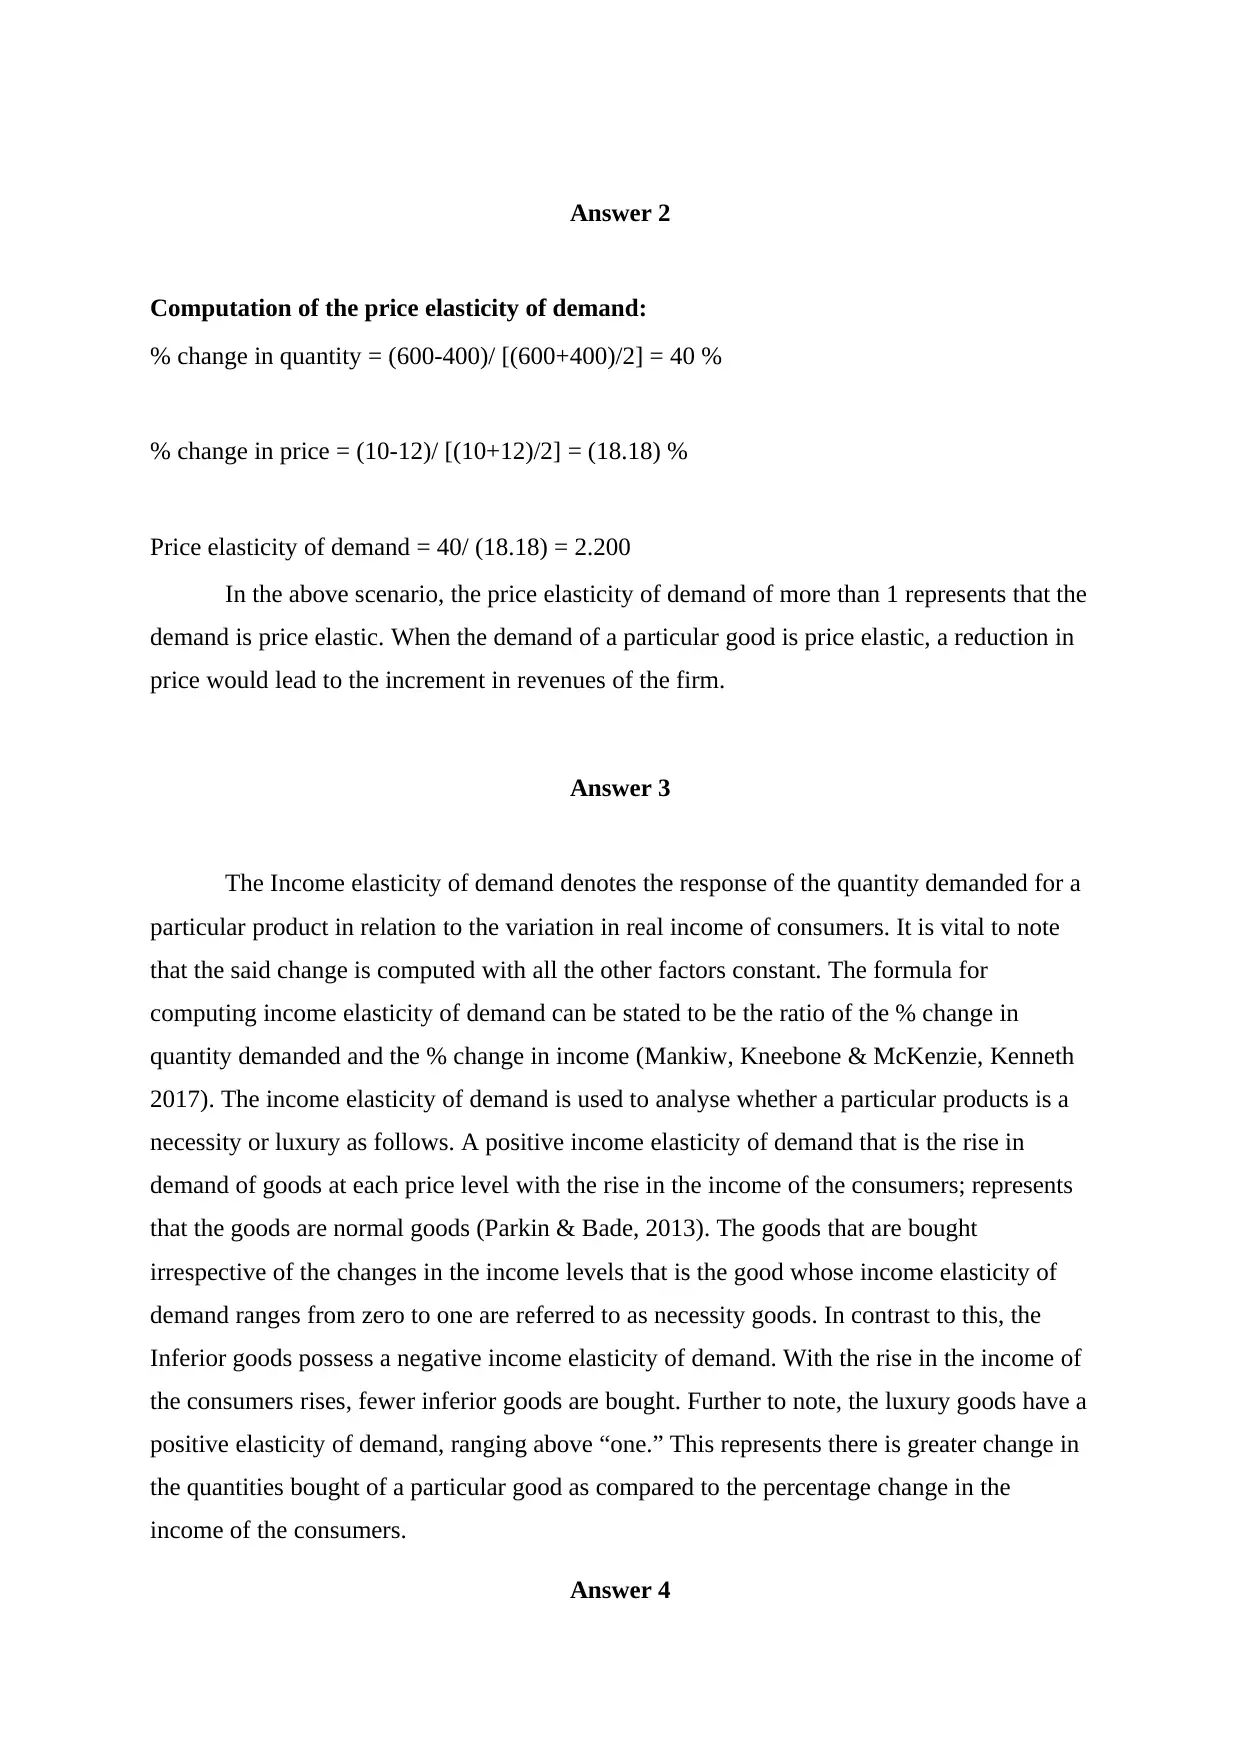
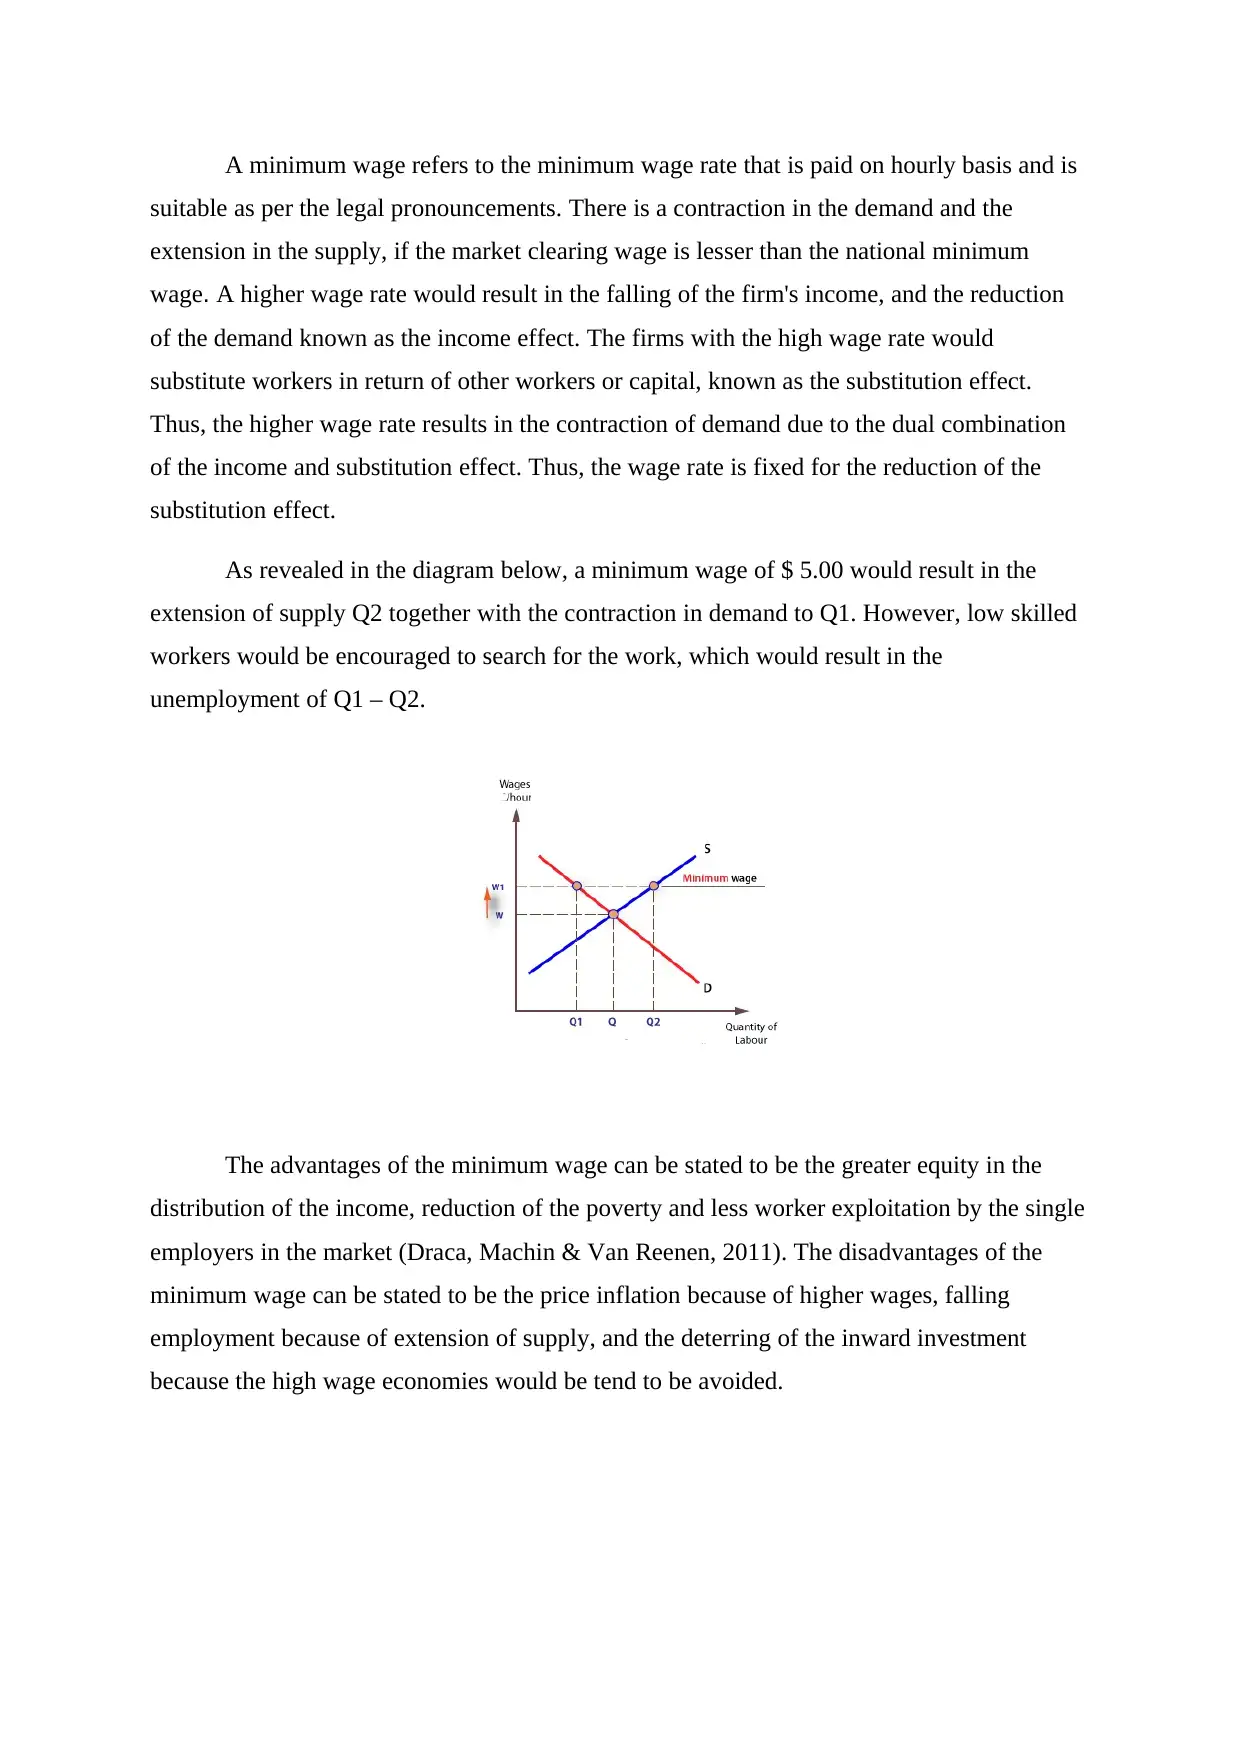
This microeconomics assignment addresses key concepts including the distinction between an increase in demand and an increase in quantity demanded, explaining the factors that shift the demand curve and illustrating these concepts with graphs. It then calculates the price elasticity of demand, determining the relationship between price changes and total revenue. The assignment also explores income elasticity of demand, differentiating between normal, luxury, necessity, and inferior goods based on consumer income changes. Finally, it analyzes the economic effects of a minimum wage, discussing its advantages and disadvantages using supply and demand analysis, and illustrating the impact on employment and market equilibrium.
Document Page
MICROECONOMICS
tabler-icon-diamond-filled.svg

Secure Best Marks with AI Grader

Need help grading? Try our AI Grader for instant feedback on your assignments.
Document Page
Answer 1
Increase in quantity demanded refers to the change in the quantity demanded of a
service due to the decrease in the prices, while other factors remaining constant. Thus, the
increase in the quantity demanded when plotted on the graph leads to the movement along the
same demand curve (Mankiw, Kneebone & McKenzie, Kenneth 2017). The downward
demand on the demand curve explains the extension of the demand, as shown in the graph 1
below.
In contrast to this, the increase in the demand refers to the rise in demand for a
commodity by the virtue of factors other than price. The four key factors that can be
attributed to the increase in the demand are listed as follows. The increase in the income of
the consumers or the changes in the taste and preferences of the consumers can lead to the
increase in demand of a commodity (Hall & Lieberman, 2012). In addition to the above, the
rise in the prices of the substitute goods, or the fall in the prices of the complimentary goods
can lead to the increase in the demand of a product. The increase in the quantity demanded
can be represented on the graph as follows.
Document Page
Answer 2
Computation of the price elasticity of demand:
% change in quantity = (600-400)/ [(600+400)/2] = 40 %
% change in price = (10-12)/ [(10+12)/2] = (18.18) %
Price elasticity of demand = 40/ (18.18) = 2.200
In the above scenario, the price elasticity of demand of more than 1 represents that the
demand is price elastic. When the demand of a particular good is price elastic, a reduction in
price would lead to the increment in revenues of the firm.
Answer 3
The Income elasticity of demand denotes the response of the quantity demanded for a
particular product in relation to the variation in real income of consumers. It is vital to note
that the said change is computed with all the other factors constant. The formula for
computing income elasticity of demand can be stated to be the ratio of the % change in
quantity demanded and the % change in income (Mankiw, Kneebone & McKenzie, Kenneth
2017). The income elasticity of demand is used to analyse whether a particular products is a
necessity or luxury as follows. A positive income elasticity of demand that is the rise in
demand of goods at each price level with the rise in the income of the consumers; represents
that the goods are normal goods (Parkin & Bade, 2013). The goods that are bought
irrespective of the changes in the income levels that is the good whose income elasticity of
demand ranges from zero to one are referred to as necessity goods. In contrast to this, the
Inferior goods possess a negative income elasticity of demand. With the rise in the income of
the consumers rises, fewer inferior goods are bought. Further to note, the luxury goods have a
positive elasticity of demand, ranging above “one.” This represents there is greater change in
the quantities bought of a particular good as compared to the percentage change in the
income of the consumers.
Answer 4
Document Page
A minimum wage refers to the minimum wage rate that is paid on hourly basis and is
suitable as per the legal pronouncements. There is a contraction in the demand and the
extension in the supply, if the market clearing wage is lesser than the national minimum
wage. A higher wage rate would result in the falling of the firm's income, and the reduction
of the demand known as the income effect. The firms with the high wage rate would
substitute workers in return of other workers or capital, known as the substitution effect.
Thus, the higher wage rate results in the contraction of demand due to the dual combination
of the income and substitution effect. Thus, the wage rate is fixed for the reduction of the
substitution effect.
As revealed in the diagram below, a minimum wage of $ 5.00 would result in the
extension of supply Q2 together with the contraction in demand to Q1. However, low skilled
workers would be encouraged to search for the work, which would result in the
unemployment of Q1 – Q2.
The advantages of the minimum wage can be stated to be the greater equity in the
distribution of the income, reduction of the poverty and less worker exploitation by the single
employers in the market (Draca, Machin & Van Reenen, 2011). The disadvantages of the
minimum wage can be stated to be the price inflation because of higher wages, falling
employment because of extension of supply, and the deterring of the inward investment
because the high wage economies would be tend to be avoided.
tabler-icon-diamond-filled.svg

Secure Best Marks with AI Grader

Need help grading? Try our AI Grader for instant feedback on your assignments.
Document Page
References
Draca, M., Machin, S., & Van Reenen, J. (2011). Minimum wages and firm profitability.
American economic journal: applied economics, 3(1), 129-51.
Hall, R. E., & Lieberman, M. (2012). Microeconomics: Principles and applications. Boston
MA: Cengage Learning.
Mankiw, N. G., Kneebone, R. D., & McKenzie, Kenneth J. (2017). Principles of
Microeconomics. (7th Cdn ed.). Toronto: Nelson Education Ltd.
Parkin, M., & Bade, R. (2013). Foundations of microeconomics. UK: Pearson.
chevron_up_icon
1 out of 5
circle_padding
hide_on_mobile
zoom_out_icon
logo.png

Your All-in-One AI-Powered Toolkit for Academic Success.

Available 24*7 on WhatsApp / Email

[object Object]