Microeconomics Assignment: PPF, Demand, Supply, and Taxes

Verified

Added on  2020/02/24

|7
|1066
|54
Homework Assignment
AI Summary
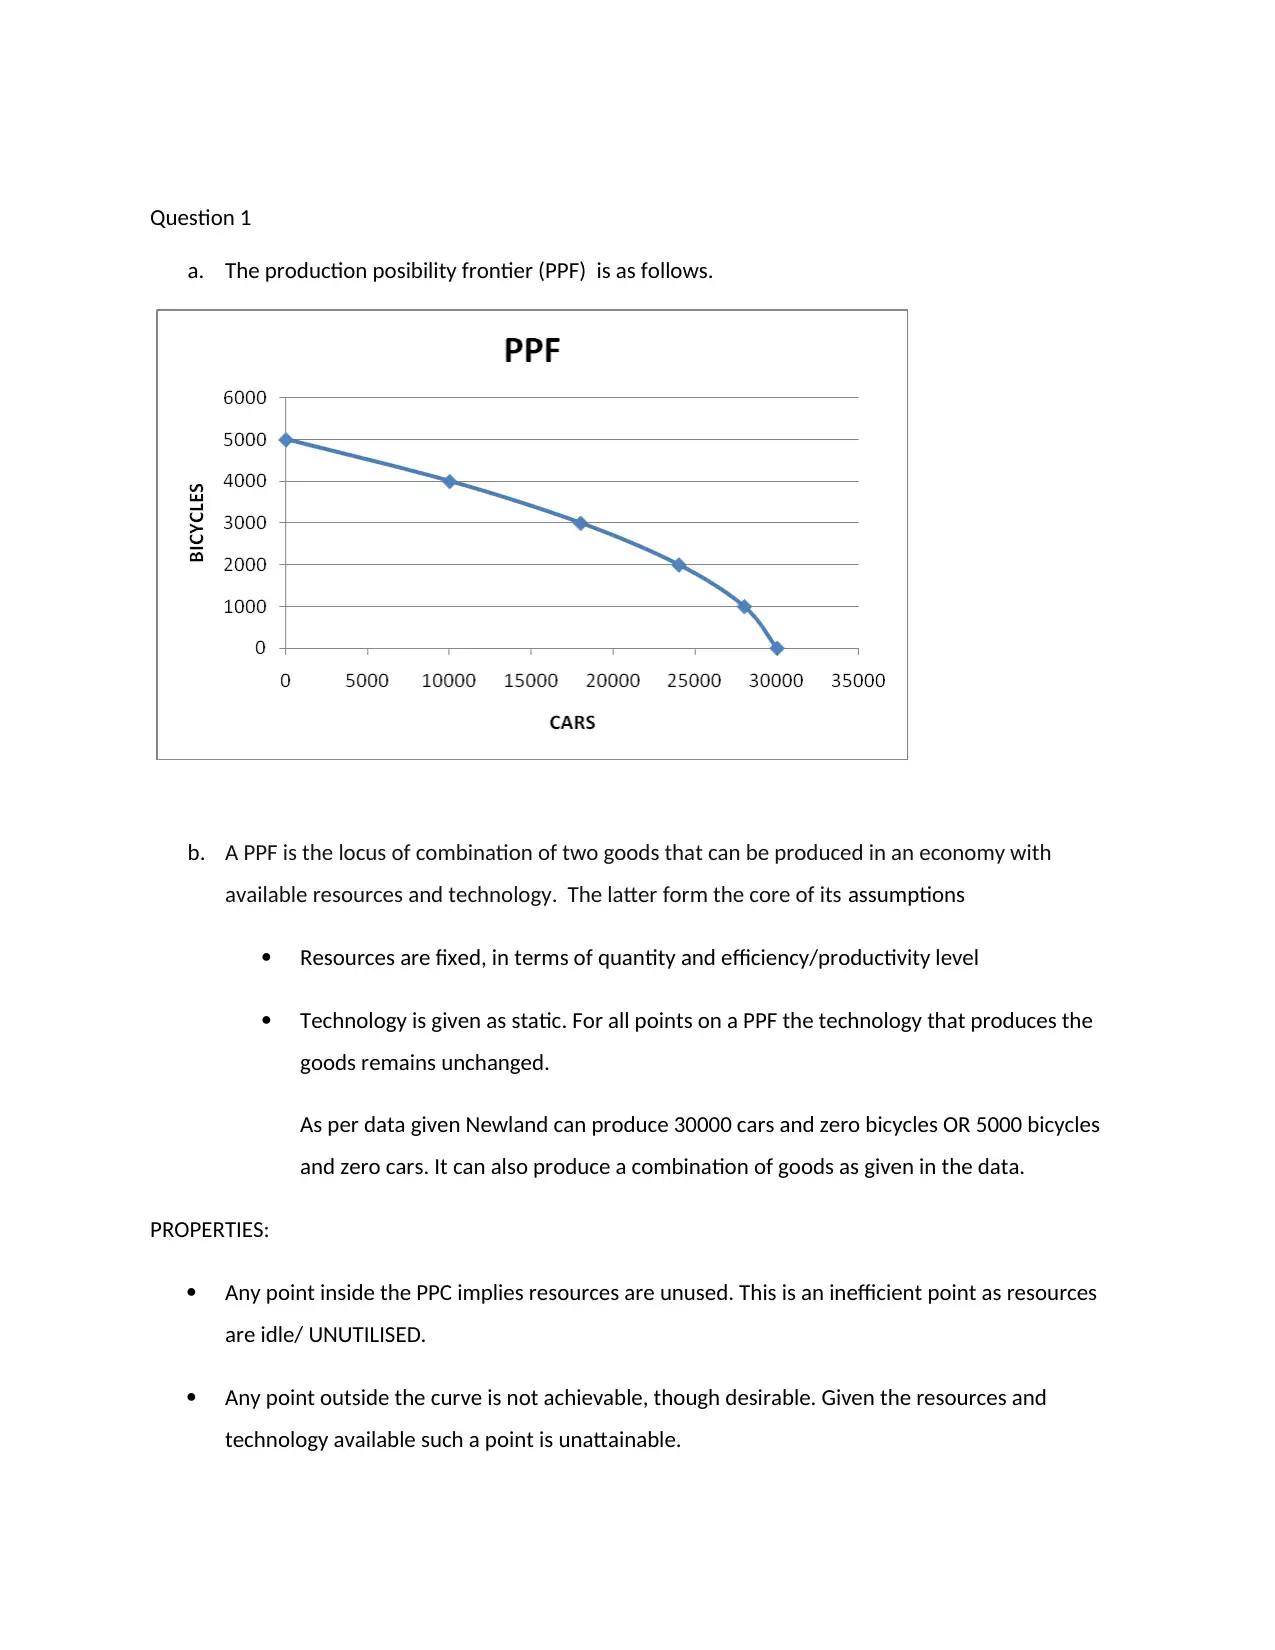
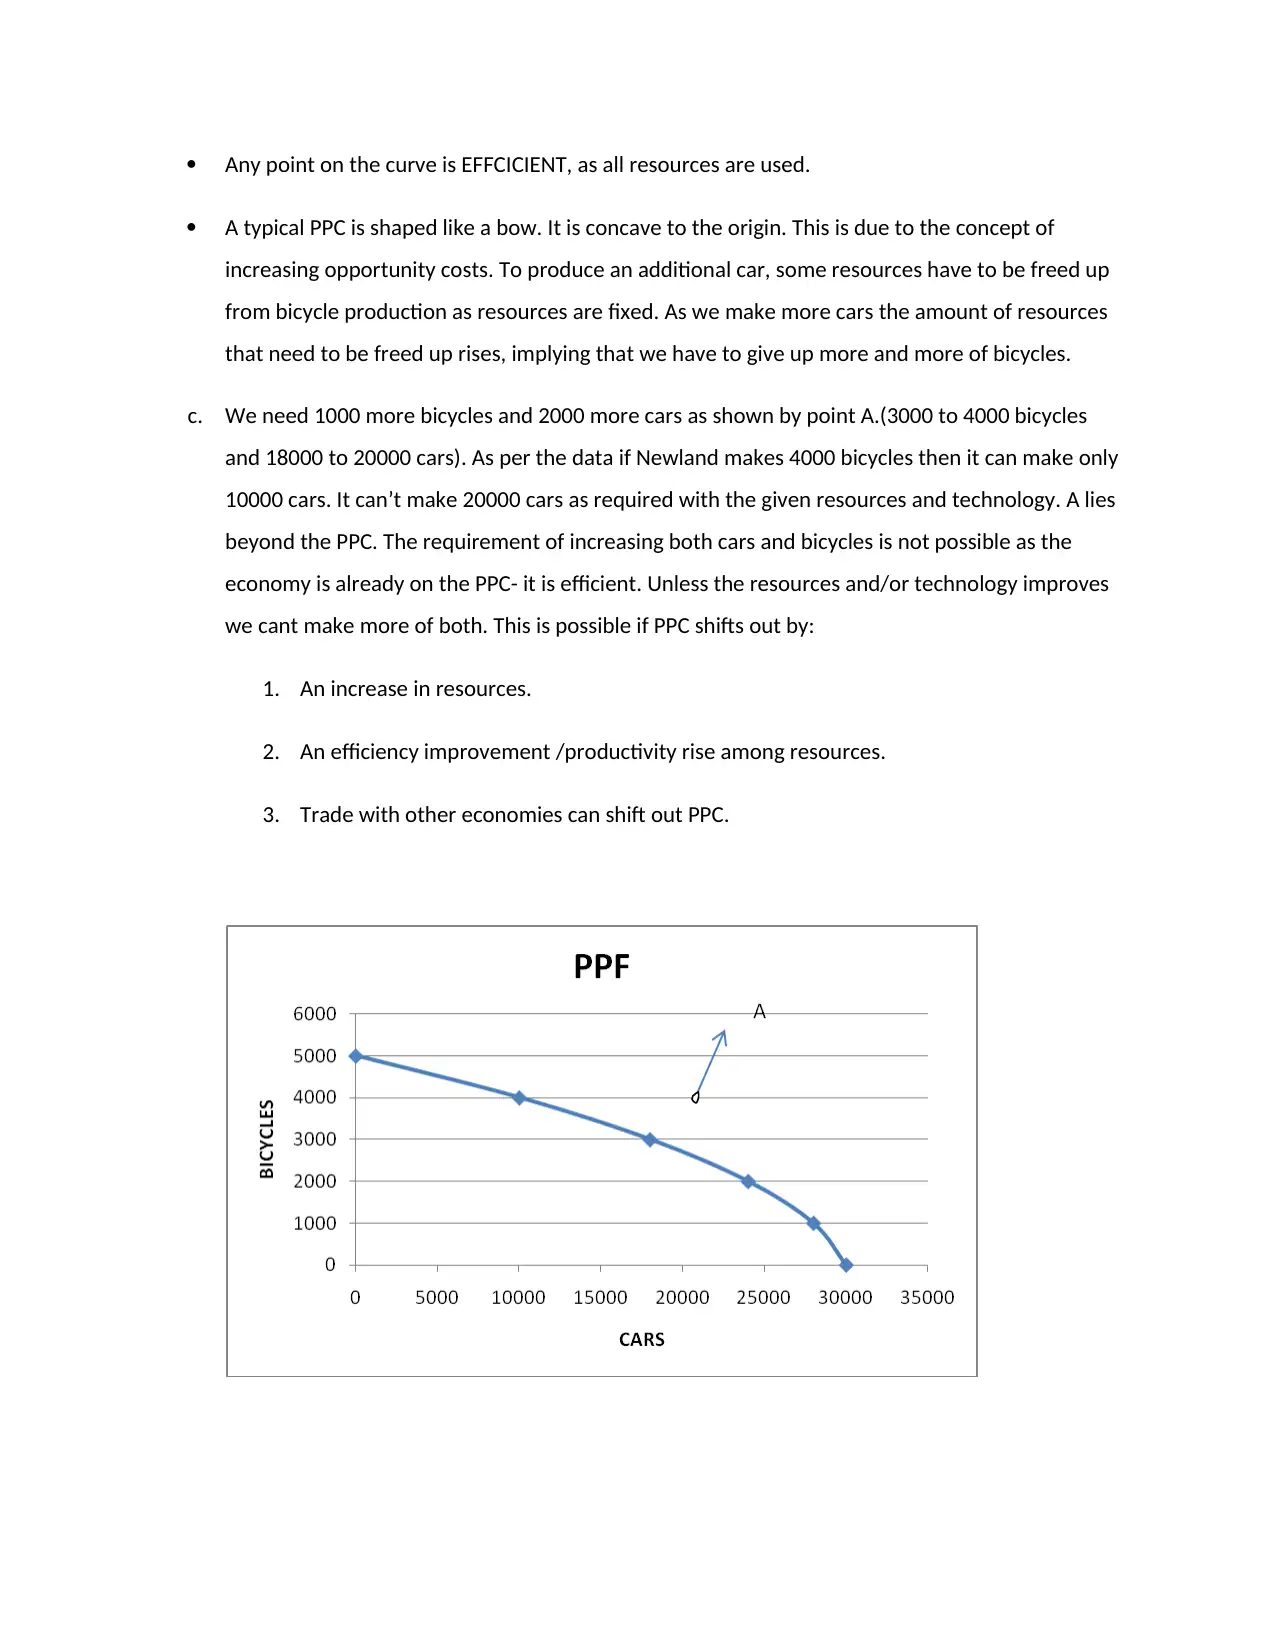
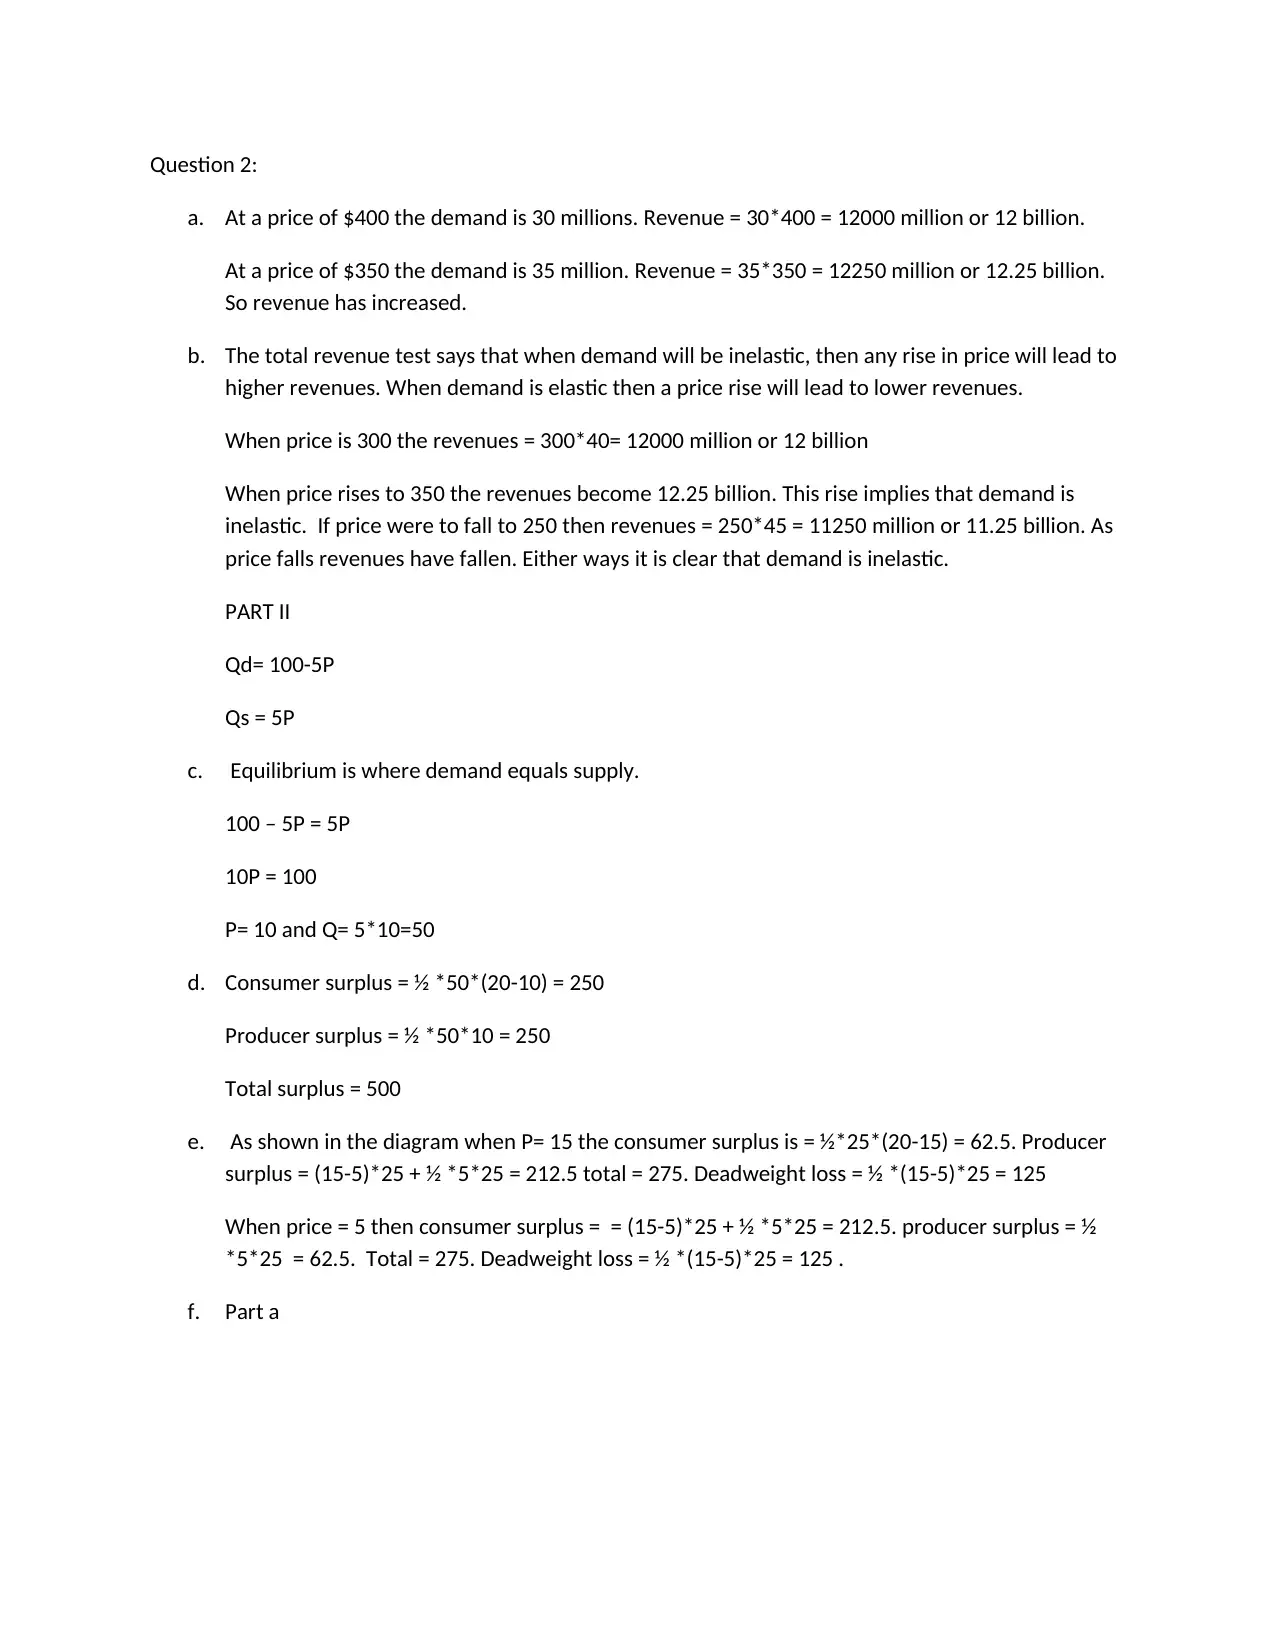
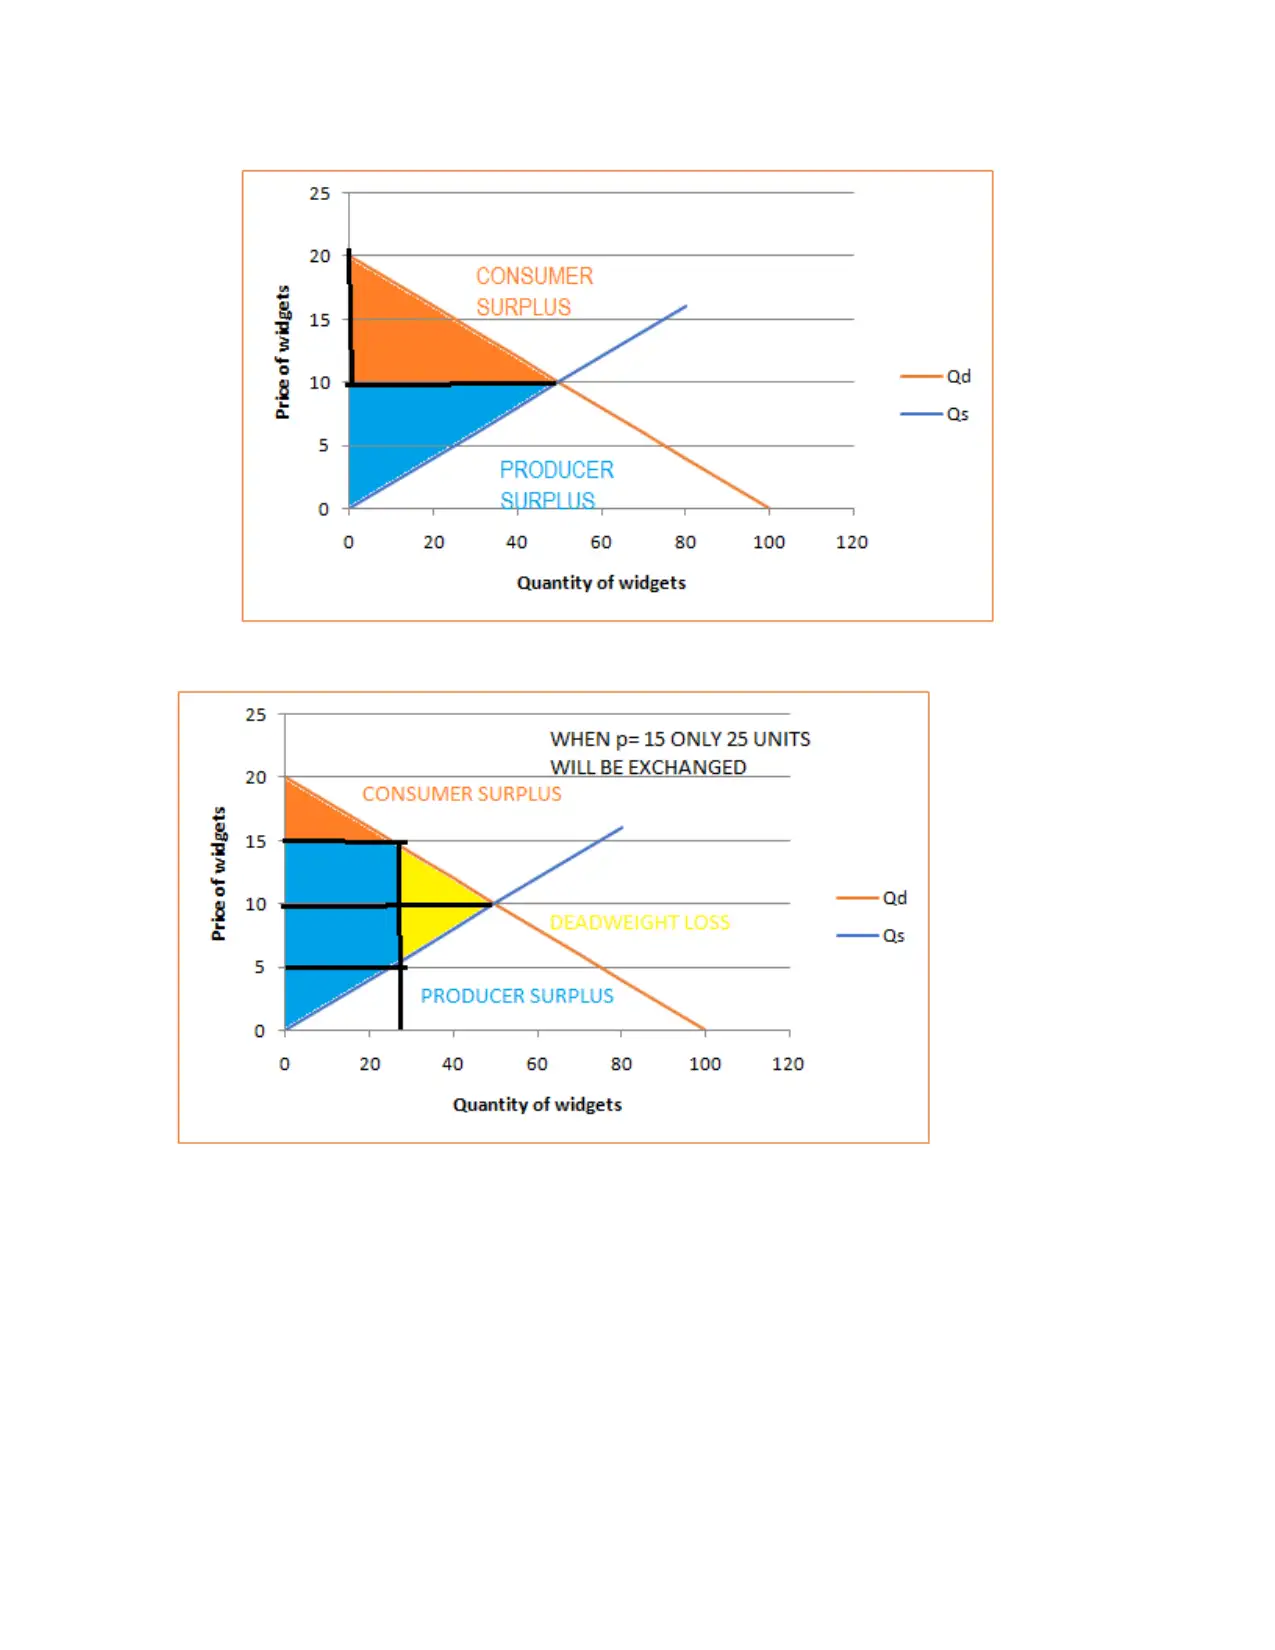
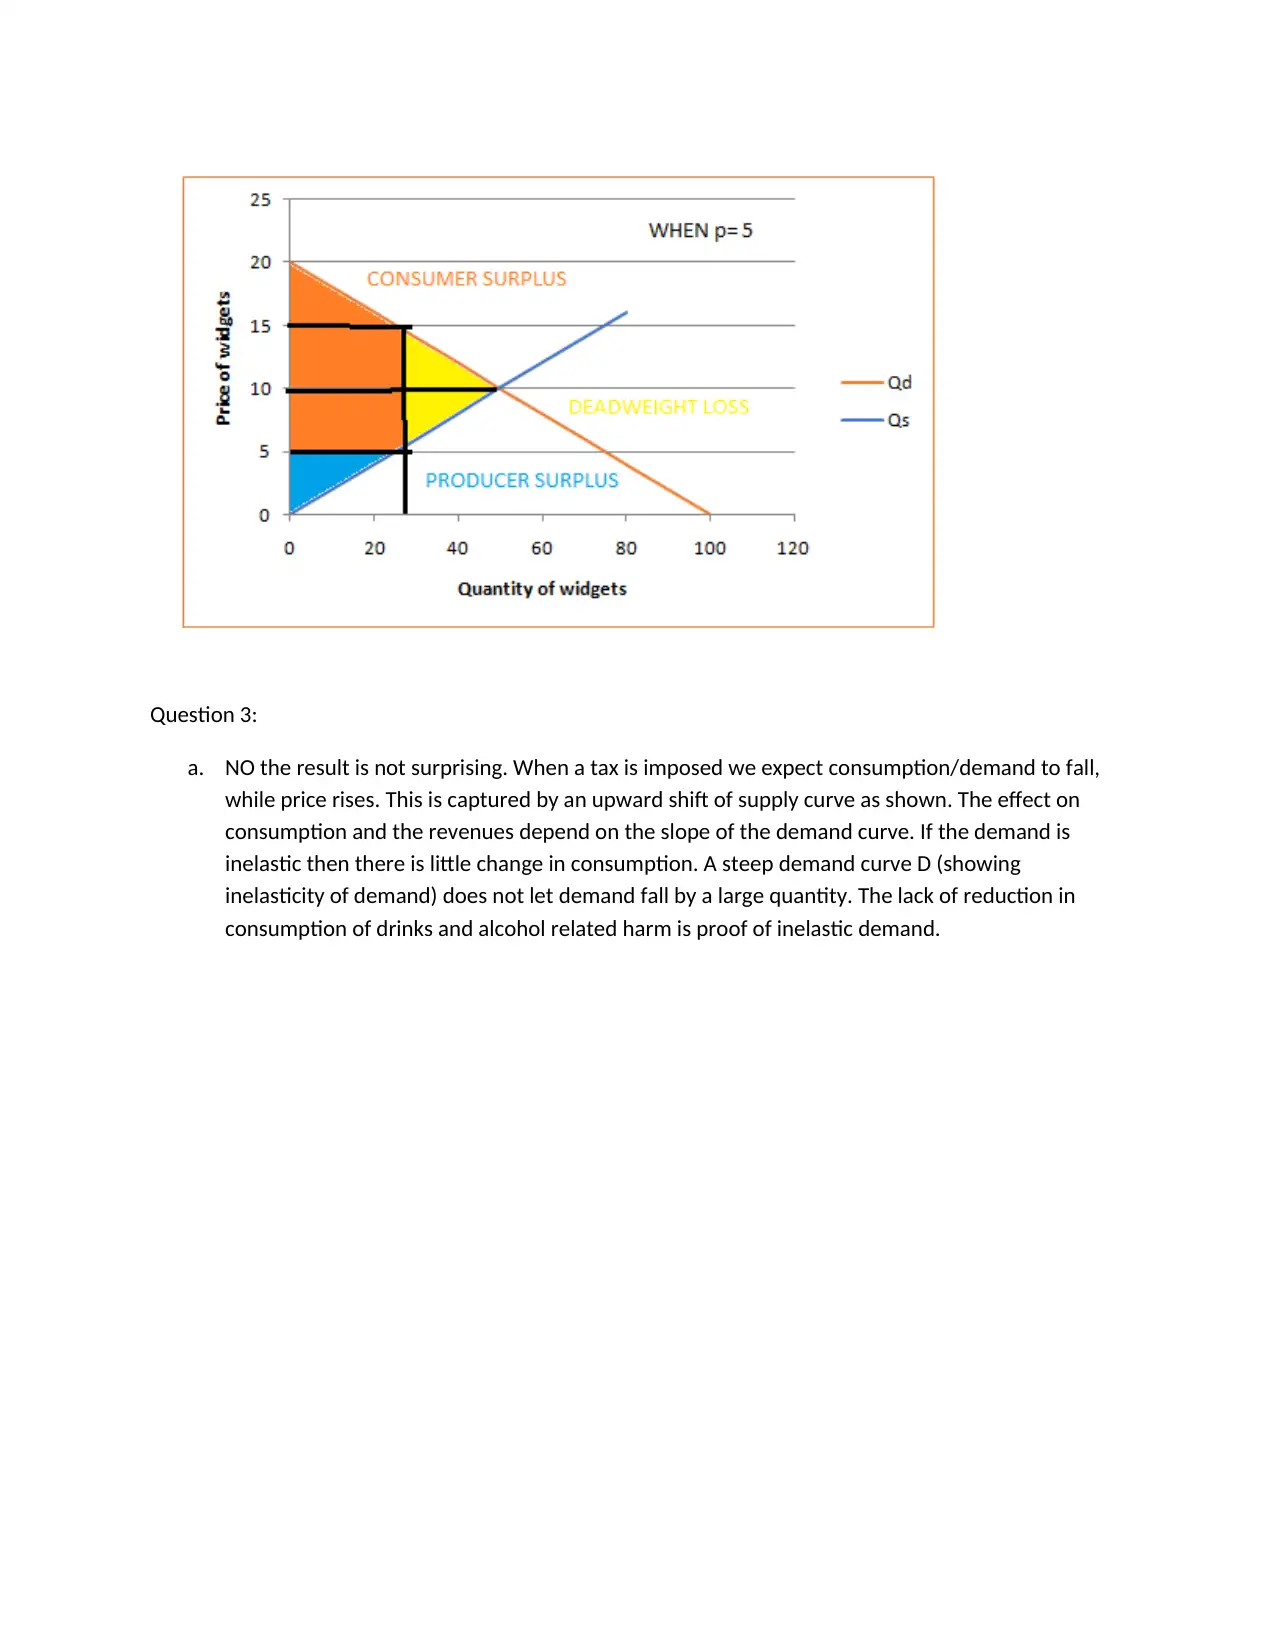
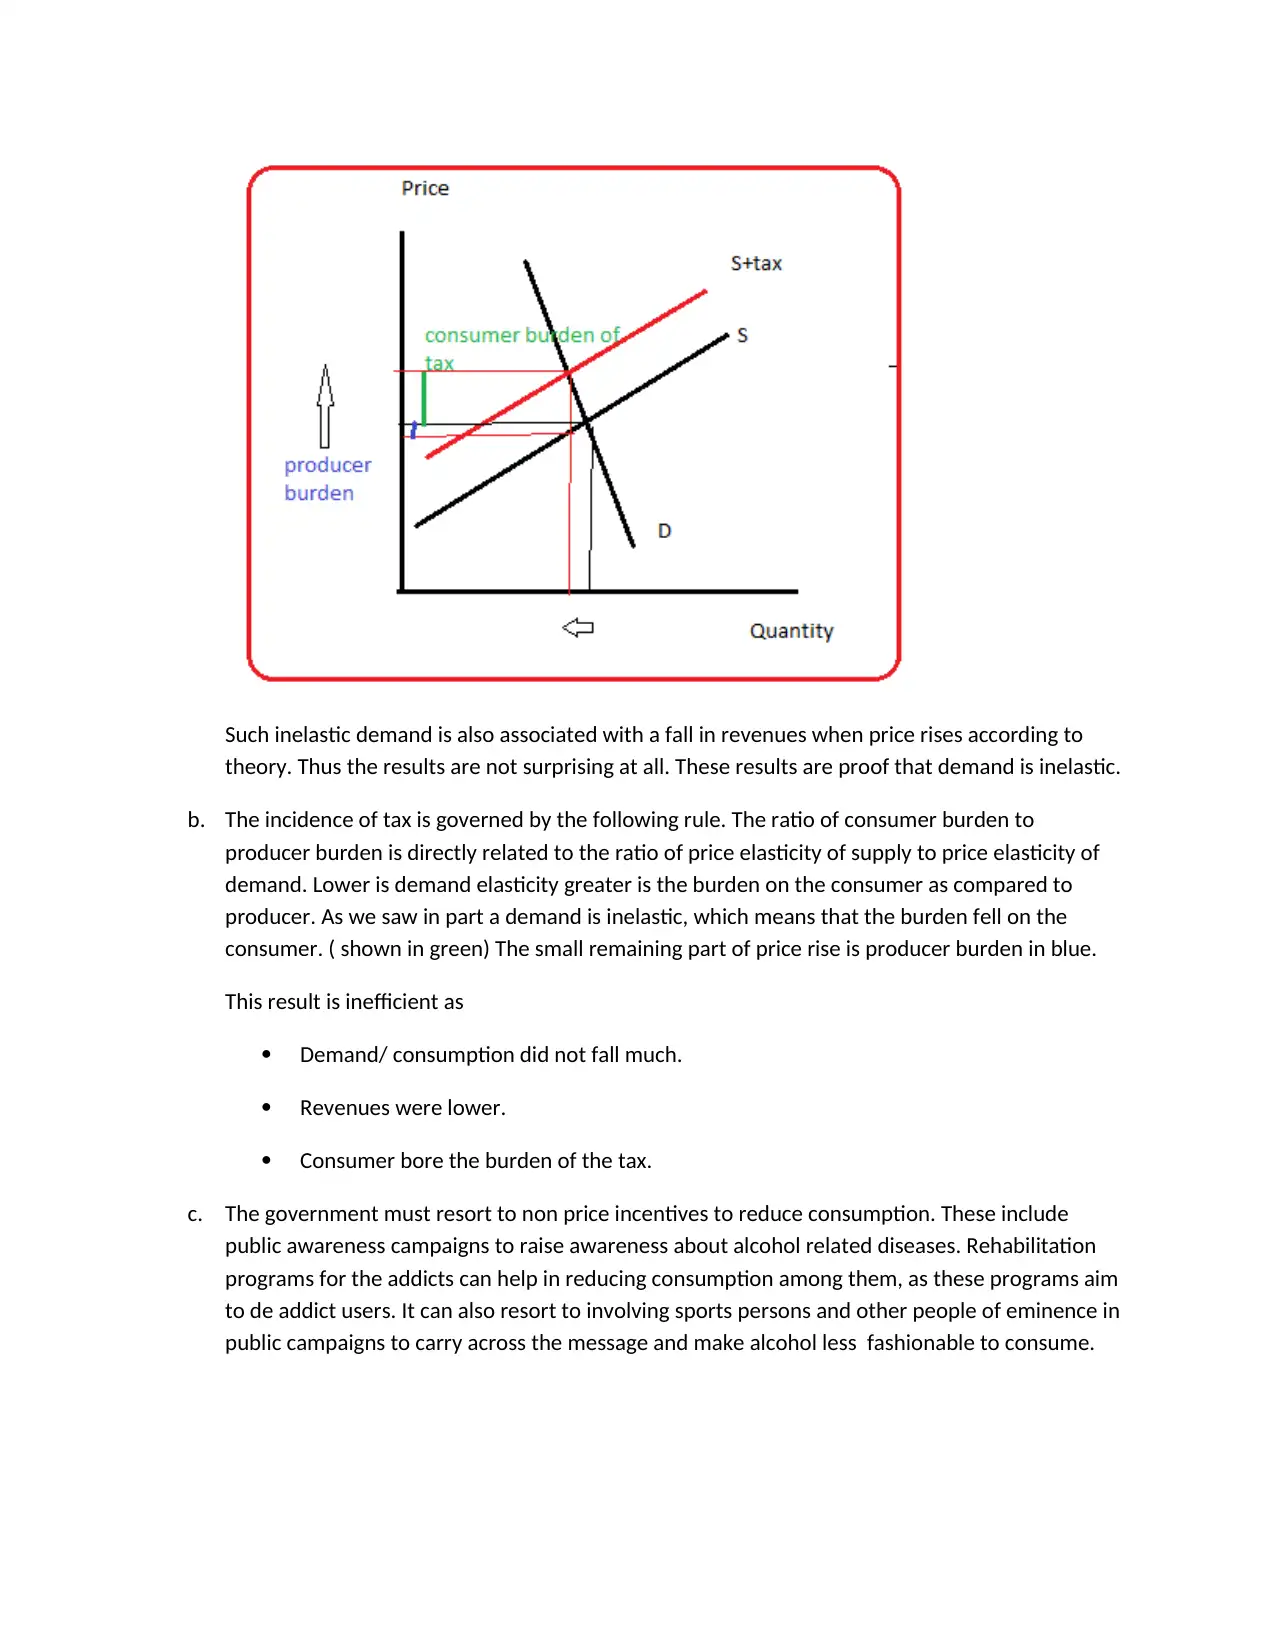
This economics assignment delves into fundamental microeconomic principles. The first section analyzes the Production Possibility Frontier (PPF), illustrating concepts of efficiency, opportunity cost, and resource allocation. The second part examines demand, supply, and market equilibrium, calculating revenue, consumer surplus, producer surplus, and deadweight loss. It explores price elasticity and its impact on revenue. The final section investigates the effects of taxes on markets, including tax incidence, and discusses non-price incentives to reduce consumption, such as public awareness campaigns and rehabilitation programs. The assignment demonstrates an understanding of graphical representations and economic analysis.
tabler-icon-diamond-filled.svg

Contribute Materials

Your contribution can guide someone’s learning journey. Share your documents today.
Document Page
Question 1
a. The production posibility frontier (PPF) is as follows.
b. A PPF is the locus of combination of two goods that can be produced in an economy with
available resources and technology. The latter form the core of its assumptions
Resources are fixed, in terms of quantity and efficiency/productivity level
Technology is given as static. For all points on a PPF the technology that produces the
goods remains unchanged.
As per data given Newland can produce 30000 cars and zero bicycles OR 5000 bicycles
and zero cars. It can also produce a combination of goods as given in the data.
PROPERTIES:
Any point inside the PPC implies resources are unused. This is an inefficient point as resources
are idle/ UNUTILISED.
Any point outside the curve is not achievable, though desirable. Given the resources and
technology available such a point is unattainable.
tabler-icon-diamond-filled.svg

Secure Best Marks with AI Grader

Need help grading? Try our AI Grader for instant feedback on your assignments.
Document Page
Any point on the curve is EFFCICIENT, as all resources are used.
A typical PPC is shaped like a bow. It is concave to the origin. This is due to the concept of
increasing opportunity costs. To produce an additional car, some resources have to be freed up
from bicycle production as resources are fixed. As we make more cars the amount of resources
that need to be freed up rises, implying that we have to give up more and more of bicycles.
c. We need 1000 more bicycles and 2000 more cars as shown by point A.(3000 to 4000 bicycles
and 18000 to 20000 cars). As per the data if Newland makes 4000 bicycles then it can make only
10000 cars. It can’t make 20000 cars as required with the given resources and technology. A lies
beyond the PPC. The requirement of increasing both cars and bicycles is not possible as the
economy is already on the PPC- it is efficient. Unless the resources and/or technology improves
we cant make more of both. This is possible if PPC shifts out by:
1. An increase in resources.
2. An efficiency improvement /productivity rise among resources.
3. Trade with other economies can shift out PPC.
Document Page
Question 2:
a. At a price of $400 the demand is 30 millions. Revenue = 30*400 = 12000 million or 12 billion.
At a price of $350 the demand is 35 million. Revenue = 35*350 = 12250 million or 12.25 billion.
So revenue has increased.
b. The total revenue test says that when demand will be inelastic, then any rise in price will lead to
higher revenues. When demand is elastic then a price rise will lead to lower revenues.
When price is 300 the revenues = 300*40= 12000 million or 12 billion
When price rises to 350 the revenues become 12.25 billion. This rise implies that demand is
inelastic. If price were to fall to 250 then revenues = 250*45 = 11250 million or 11.25 billion. As
price falls revenues have fallen. Either ways it is clear that demand is inelastic.
PART II
Qd= 100-5P
Qs = 5P
c. Equilibrium is where demand equals supply.
100 – 5P = 5P
10P = 100
P= 10 and Q= 5*10=50
d. Consumer surplus = ½ *50*(20-10) = 250
Producer surplus = ½ *50*10 = 250
Total surplus = 500
e. As shown in the diagram when P= 15 the consumer surplus is = ½*25*(20-15) = 62.5. Producer
surplus = (15-5)*25 + ½ *5*25 = 212.5 total = 275. Deadweight loss = ½ *(15-5)*25 = 125
When price = 5 then consumer surplus = = (15-5)*25 + ½ *5*25 = 212.5. producer surplus = ½
*5*25 = 62.5. Total = 275. Deadweight loss = ½ *(15-5)*25 = 125 .
f. Part a
Document Page
tabler-icon-diamond-filled.svg

Secure Best Marks with AI Grader

Need help grading? Try our AI Grader for instant feedback on your assignments.
Document Page
Document Page
Question 3:
a. NO the result is not surprising. When a tax is imposed we expect consumption/demand to fall,
while price rises. This is captured by an upward shift of supply curve as shown. The effect on
consumption and the revenues depend on the slope of the demand curve. If the demand is
inelastic then there is little change in consumption. A steep demand curve D (showing
inelasticity of demand) does not let demand fall by a large quantity. The lack of reduction in
consumption of drinks and alcohol related harm is proof of inelastic demand.
Document Page
Such inelastic demand is also associated with a fall in revenues when price rises according to
theory. Thus the results are not surprising at all. These results are proof that demand is inelastic.
b. The incidence of tax is governed by the following rule. The ratio of consumer burden to
producer burden is directly related to the ratio of price elasticity of supply to price elasticity of
demand. Lower is demand elasticity greater is the burden on the consumer as compared to
producer. As we saw in part a demand is inelastic, which means that the burden fell on the
consumer. ( shown in green) The small remaining part of price rise is producer burden in blue.
This result is inefficient as
Demand/ consumption did not fall much.
Revenues were lower.
Consumer bore the burden of the tax.
c. The government must resort to non price incentives to reduce consumption. These include
public awareness campaigns to raise awareness about alcohol related diseases. Rehabilitation
programs for the addicts can help in reducing consumption among them, as these programs aim
to de addict users. It can also resort to involving sports persons and other people of eminence in
public campaigns to carry across the message and make alcohol less fashionable to consume.
chevron_up_icon
1 out of 7
circle_padding
hide_on_mobile
zoom_out_icon
logo.png

Your All-in-One AI-Powered Toolkit for Academic Success.

Available 24*7 on WhatsApp / Email

[object Object]