Microeconomic Analysis Assignment: Taxes, Subsidies, Automation
VerifiedAdded on 2021/04/17
|10
|1462
|23
Homework Assignment
AI Summary
This microeconomic analysis assignment explores several key concepts. It begins with an analysis of consumer choice, examining optimal bundles with and without subsidies, illustrating how subsidies affect consumer spending and equilibrium. The assignment then delves into the restaurant industry's slowdown, using income and substitution effects to explain how price changes influence consumer choices between eating at home and dining out. Furthermore, the assignment investigates the labor-leisure choice, modeling how income tax affects work effort through income and substitution effects, and considering scenarios where either effect dominates. Finally, the assignment addresses the impact of automation on the job market, discussing the threat to various occupations, including manual and white-collar jobs, and the challenges faced by workers due to advancements in machine-learning.

Running Head: MICROECONOMIC ANALYSIS
Microeconomic Analysis
Name of the Student
Name of the University
Author note
Microeconomic Analysis
Name of the Student
Name of the University
Author note
Paraphrase This Document
Need a fresh take? Get an instant paraphrase of this document with our AI Paraphraser
1MICROECONOMIC ANALYSIS
Table of Contents
Answer 1....................................................................................................................................2
Optimal bundle without subsidy............................................................................................2
Optimal bundle with subsidy.................................................................................................3
Answer 2....................................................................................................................................4
Answer 3....................................................................................................................................5
Income tax and labor-leisure choice......................................................................................5
Answer 4....................................................................................................................................7
References..................................................................................................................................9

2MICROECONOMIC ANALYSIS
Answer 1
Optimal bundle without subsidy
Figure 1: Consumer equilibrium without subsidy
(Source: as created by Author)
The figure above describes optimal bundle choice for Doreen’s family without
implementation of subsidy. The horizontal axis measures childcare services and the vertical
axis measure the spending on all other goods. The current income of Doreen’s family is
$60,000. It is given that the family would never spend more than 50% of its income on
childcare service. This means spending on childcare service would never exceed $30,000.
This gives kinked budget line, ABC. The kink occur at the extreme point where the family
allocate its income between childcare and other goods equally. Currently, the family spend
$10,000 on childcare service. Therefore, rest is spent on other goods. The equilibrium point
without subsidy is E obtained from the tangency between the budget line and the indifference
curve IC11. The optimal consumption bundle is at (10,000, 50,000).
1 Fine, Ben. "Microeconomics." University of Chicago Press Economics Books (2016).
⊘ This is a preview!⊘
Do you want full access?
Subscribe today to unlock all pages.
Trusted by 1+ million students worldwide

3MICROECONOMIC ANALYSIS
Optimal bundle with subsidy
Figure 2: Consumer equilibrium with subsidy
(Source: as created by Author)
The proposed subsidy pays 85% of total childcare cost2. With price of all other things
remaining same, the subsidy shifts the budget line from ABC to AB’C. Previously, the family
spends $10,000 on childcare service. Now, government pay 8500 on part of the family.
Therefore, the family can now spend (50,000 + 8,500) = $58,500 on other goods. The new
equilibrium is at E1. The optimal bundle with subsidy for the family with subsidy is (10000,
58500). In situation, where the family spend 30,000 then also because of subsidy a greater
amount on other goods. The government then spend (30,000 * 0.85) = $25500. Spending on
other goods would then be (30,000 + 25, 500) = $55,000.
Answer 2
2 'Changes To The Child Care Rebate System' (NewsComAu, 2018)
<http://www.news.com.au/lifestyle/parenting/what-the-child-care-changes-mean-for-you/news-story/
75447014c6e02d23f2b6aec34711e5d9> accessed 20 March 2018
Paraphrase This Document
Need a fresh take? Get an instant paraphrase of this document with our AI Paraphraser
4MICROECONOMIC ANALYSIS
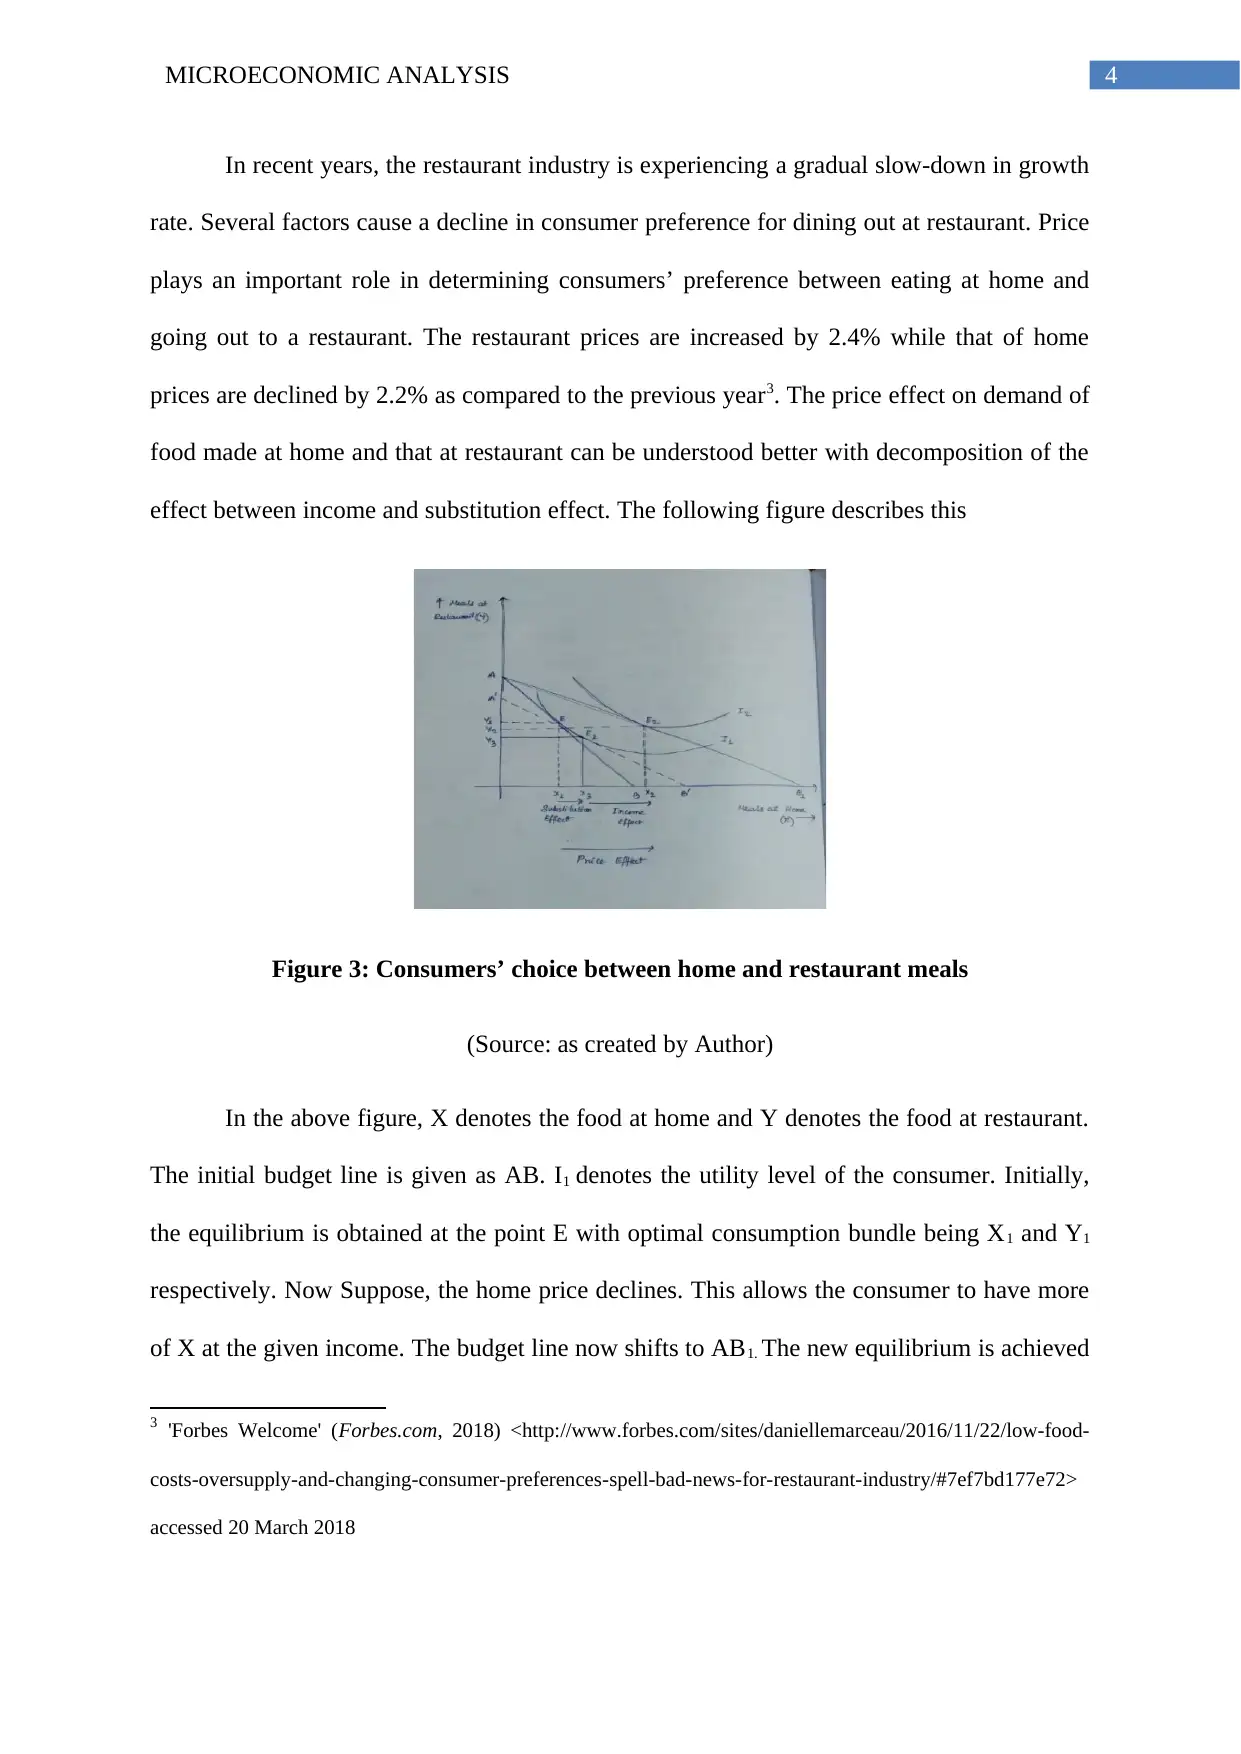
In recent years, the restaurant industry is experiencing a gradual slow-down in growth
rate. Several factors cause a decline in consumer preference for dining out at restaurant. Price
plays an important role in determining consumers’ preference between eating at home and
going out to a restaurant. The restaurant prices are increased by 2.4% while that of home
prices are declined by 2.2% as compared to the previous year3. The price effect on demand of
food made at home and that at restaurant can be understood better with decomposition of the
effect between income and substitution effect. The following figure describes this
Figure 3: Consumers’ choice between home and restaurant meals
(Source: as created by Author)
In the above figure, X denotes the food at home and Y denotes the food at restaurant.
The initial budget line is given as AB. I1 denotes the utility level of the consumer. Initially,
the equilibrium is obtained at the point E with optimal consumption bundle being X1 and Y1
respectively. Now Suppose, the home price declines. This allows the consumer to have more
of X at the given income. The budget line now shifts to AB1. The new equilibrium is achieved
3 'Forbes Welcome' (Forbes.com, 2018) <http://www.forbes.com/sites/daniellemarceau/2016/11/22/low-food-
costs-oversupply-and-changing-consumer-preferences-spell-bad-news-for-restaurant-industry/#7ef7bd177e72>
accessed 20 March 2018
5MICROECONOMIC ANALYSIS
at a higher indifference curve I2. The equilibrium point is E2. Consequently, quantity of food
at home increases to X2 while the demand for restaurant food decreases to Y2. To decompose
the price effect into income and substitution effect an imaginary budget line AB’ is drawn
parallel to the new budget line4. AB’ is tangent to initial indifference curve I1 at point E1. The
movement from E to E1 is the substitution effect and that from E1 to E2 is the income effect.
Answer 3
Income tax and labor-leisure choice
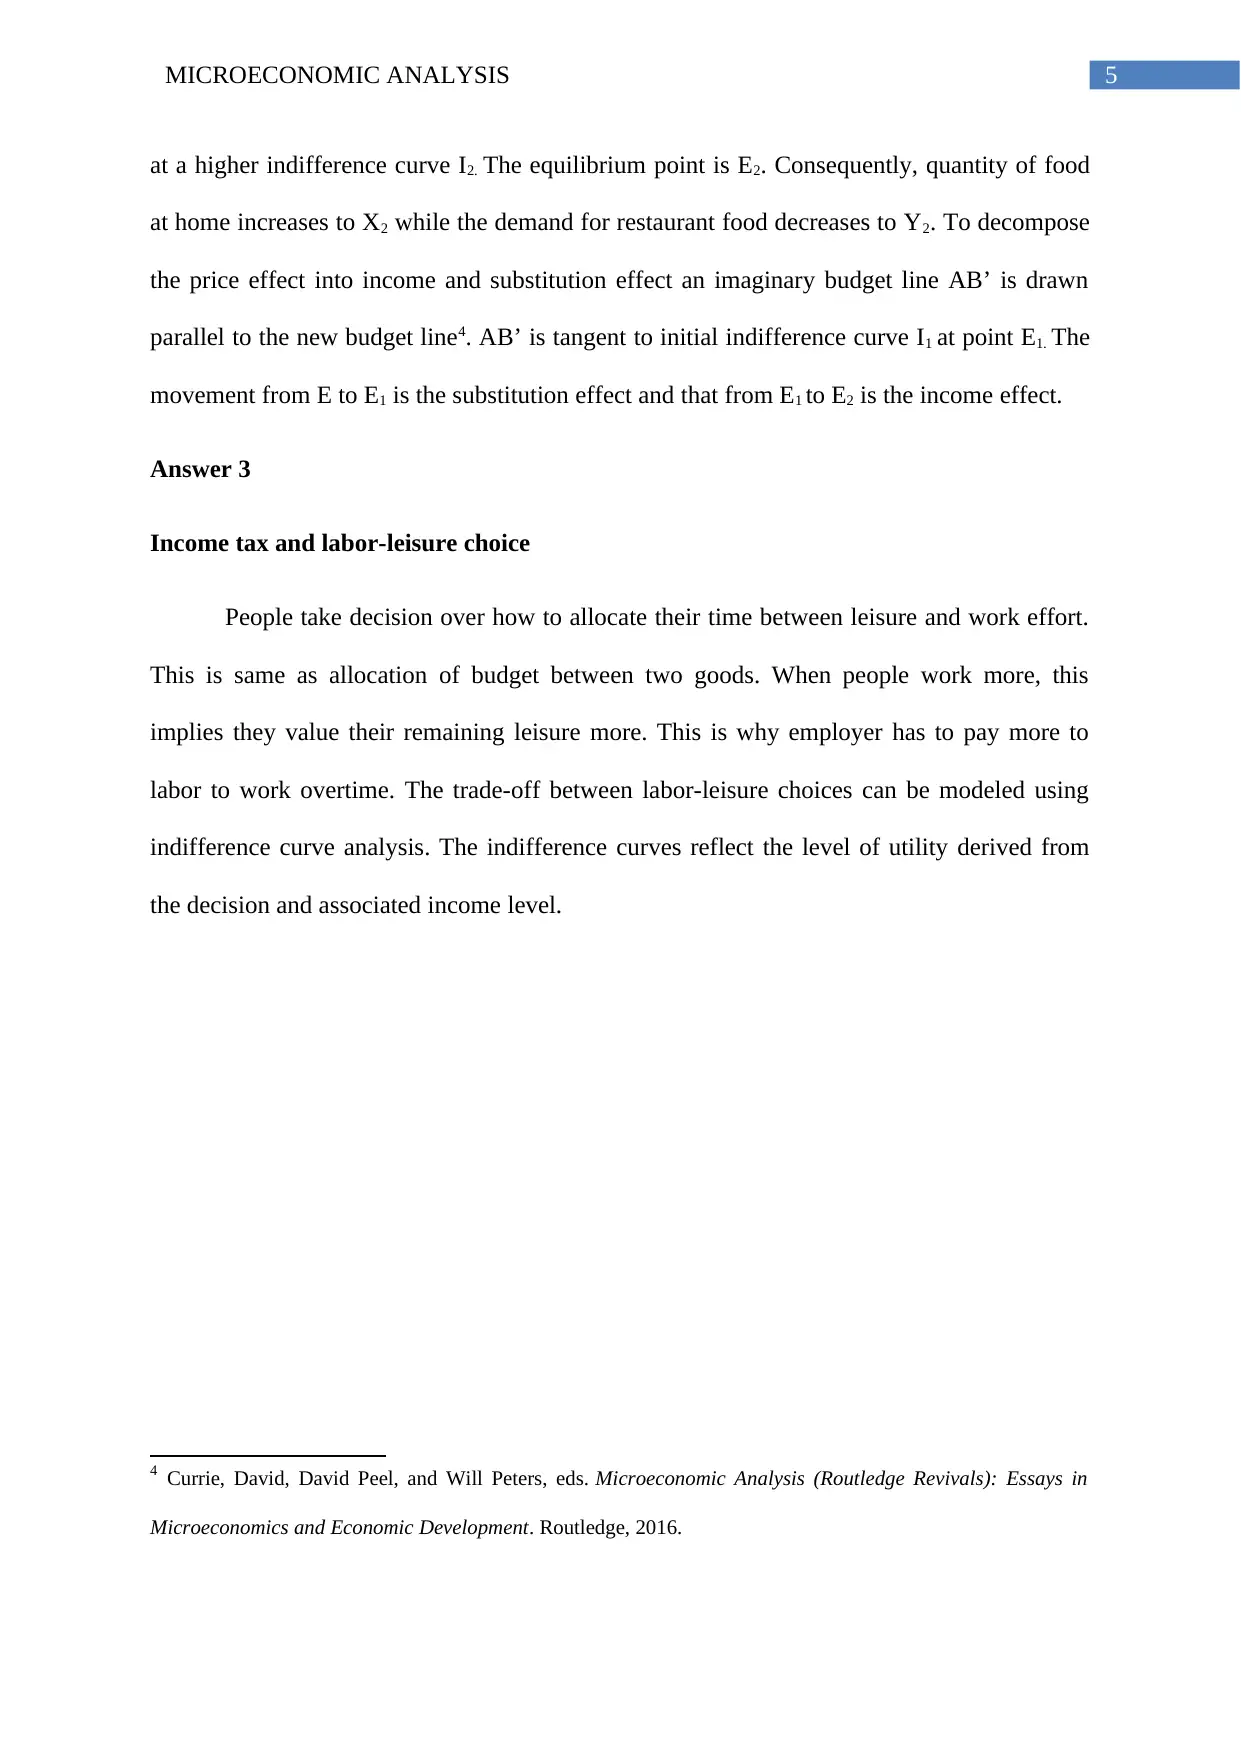
People take decision over how to allocate their time between leisure and work effort.
This is same as allocation of budget between two goods. When people work more, this
implies they value their remaining leisure more. This is why employer has to pay more to
labor to work overtime. The trade-off between labor-leisure choices can be modeled using
indifference curve analysis. The indifference curves reflect the level of utility derived from
the decision and associated income level.
4 Currie, David, David Peel, and Will Peters, eds. Microeconomic Analysis (Routledge Revivals): Essays in
Microeconomics and Economic Development. Routledge, 2016.
at a higher indifference curve I2. The equilibrium point is E2. Consequently, quantity of food
at home increases to X2 while the demand for restaurant food decreases to Y2. To decompose
the price effect into income and substitution effect an imaginary budget line AB’ is drawn
parallel to the new budget line4. AB’ is tangent to initial indifference curve I1 at point E1. The
movement from E to E1 is the substitution effect and that from E1 to E2 is the income effect.
Answer 3
Income tax and labor-leisure choice
People take decision over how to allocate their time between leisure and work effort.
This is same as allocation of budget between two goods. When people work more, this
implies they value their remaining leisure more. This is why employer has to pay more to
labor to work overtime. The trade-off between labor-leisure choices can be modeled using
indifference curve analysis. The indifference curves reflect the level of utility derived from
the decision and associated income level.
4 Currie, David, David Peel, and Will Peters, eds. Microeconomic Analysis (Routledge Revivals): Essays in
Microeconomics and Economic Development. Routledge, 2016.
⊘ This is a preview!⊘
Do you want full access?
Subscribe today to unlock all pages.
Trusted by 1+ million students worldwide
6MICROECONOMIC ANALYSIS
Figure 4: Basic labor supply model
(Source: as created by Author)
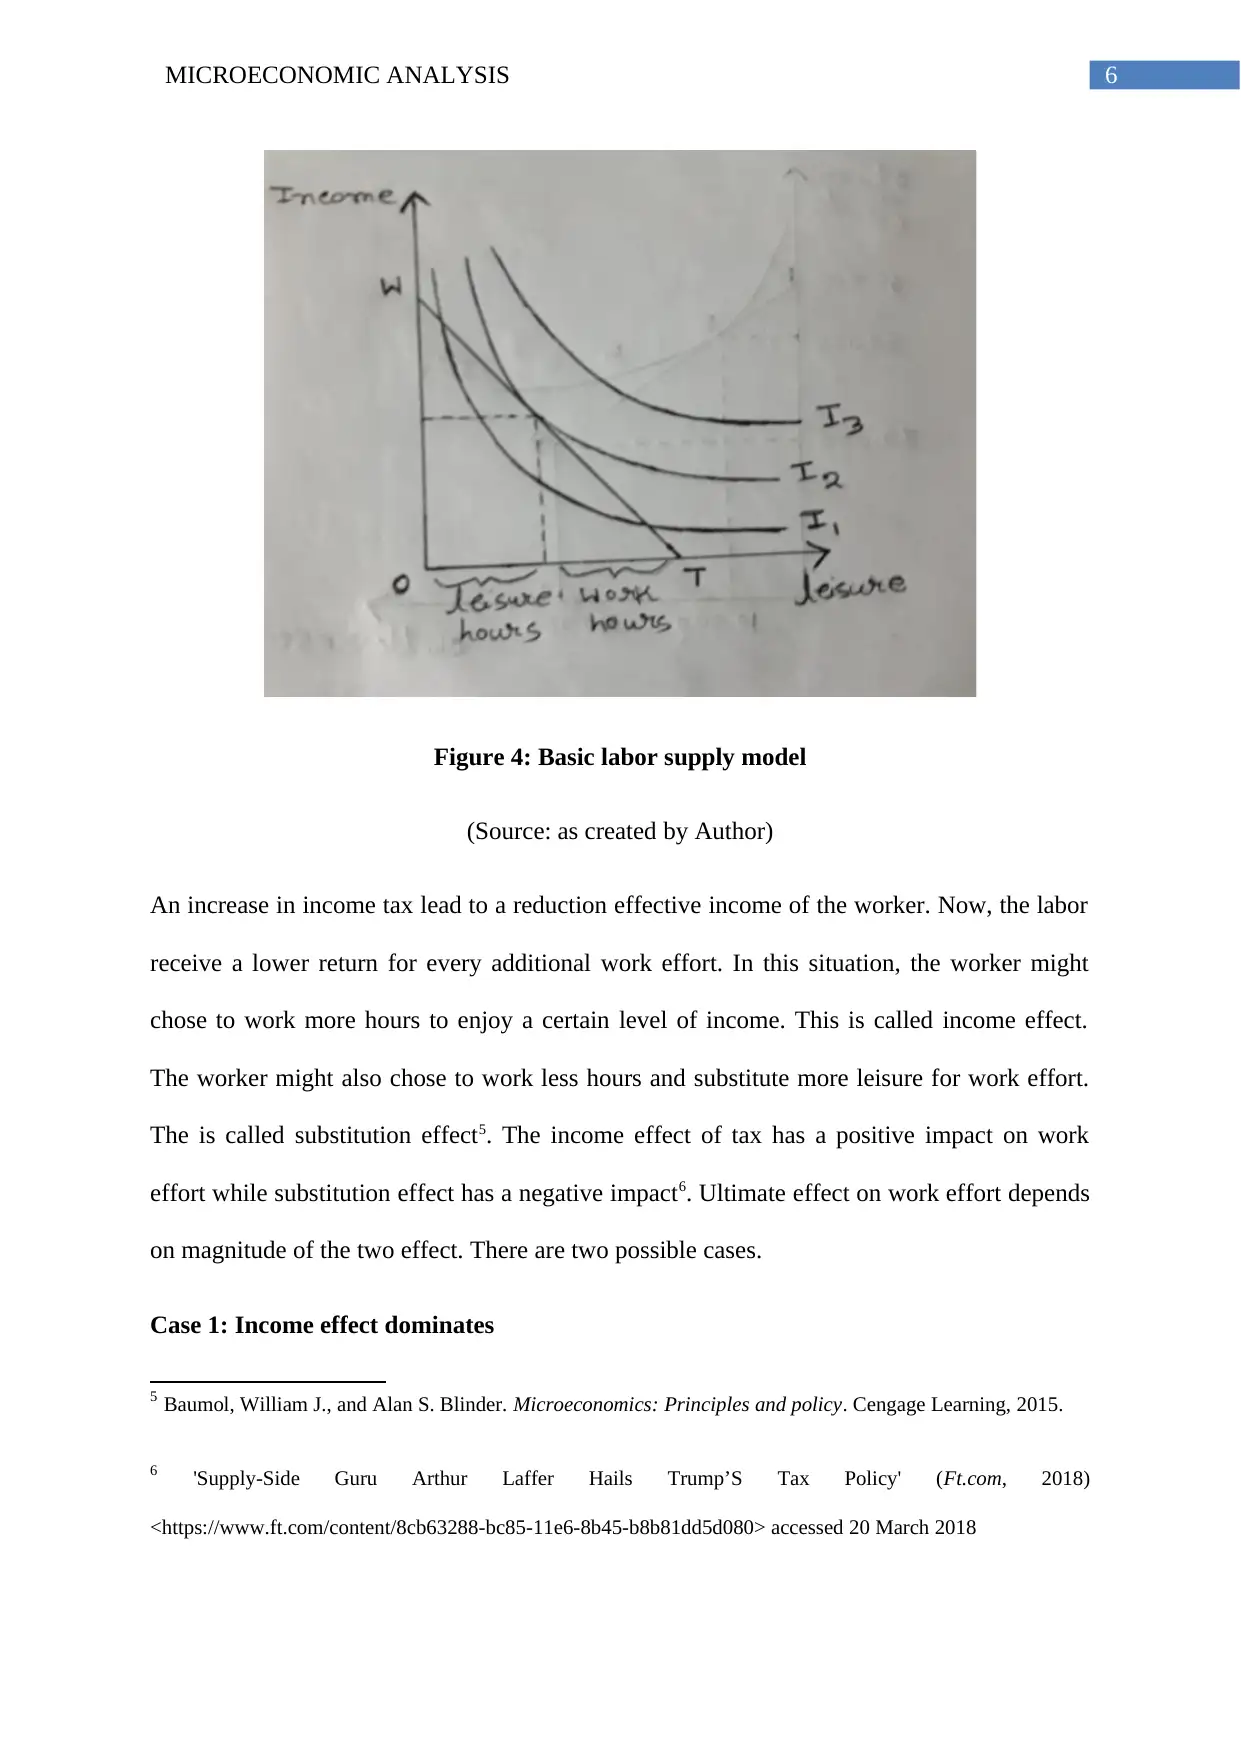
An increase in income tax lead to a reduction effective income of the worker. Now, the labor
receive a lower return for every additional work effort. In this situation, the worker might
chose to work more hours to enjoy a certain level of income. This is called income effect.
The worker might also chose to work less hours and substitute more leisure for work effort.
The is called substitution effect5. The income effect of tax has a positive impact on work
effort while substitution effect has a negative impact6. Ultimate effect on work effort depends
on magnitude of the two effect. There are two possible cases.
Case 1: Income effect dominates
5 Baumol, William J., and Alan S. Blinder. Microeconomics: Principles and policy. Cengage Learning, 2015.
6 'Supply-Side Guru Arthur Laffer Hails Trump’S Tax Policy' (Ft.com, 2018)
<https://www.ft.com/content/8cb63288-bc85-11e6-8b45-b8b81dd5d080> accessed 20 March 2018
Figure 4: Basic labor supply model
(Source: as created by Author)
An increase in income tax lead to a reduction effective income of the worker. Now, the labor
receive a lower return for every additional work effort. In this situation, the worker might
chose to work more hours to enjoy a certain level of income. This is called income effect.
The worker might also chose to work less hours and substitute more leisure for work effort.
The is called substitution effect5. The income effect of tax has a positive impact on work
effort while substitution effect has a negative impact6. Ultimate effect on work effort depends
on magnitude of the two effect. There are two possible cases.
Case 1: Income effect dominates
5 Baumol, William J., and Alan S. Blinder. Microeconomics: Principles and policy. Cengage Learning, 2015.
6 'Supply-Side Guru Arthur Laffer Hails Trump’S Tax Policy' (Ft.com, 2018)
<https://www.ft.com/content/8cb63288-bc85-11e6-8b45-b8b81dd5d080> accessed 20 March 2018
Paraphrase This Document
Need a fresh take? Get an instant paraphrase of this document with our AI Paraphraser

7MICROECONOMIC ANALYSIS
Figure 6: Increase in work effort following income tax
(Source: as created by Author)
Case 2: Substitution Effect dominates
Figure 7: Decline in work effort following income tax
(Source: as created by Author)
Answer 4
Figure 6: Increase in work effort following income tax
(Source: as created by Author)
Case 2: Substitution Effect dominates
Figure 7: Decline in work effort following income tax
(Source: as created by Author)
Answer 4
8MICROECONOMIC ANALYSIS
The spread of automation imposes a great threat for laborers. Initially, advent of
machines substitutes’ only manual work but with passes of time the innovation of more
technically advanced machines even substitute information workers. The earlier concern for
job substitutability of whether it is manual or white-collar is now shifted to whether the job is
routine or not. As per 2013 statistics, 47% worker in America are under the potential threat of
automation7. Workers engaged in transport and logistic such as those in taxi service or
delivery drivers are likely to suffer from substitutability by capital or machines. The jobs in
office support program such as jobs as receptionists and security guards are vulnerable to be
replaced with capital. The rapid expansion of computerization puts potential threats to jobs
like sales and service jobs. Automated techniques are now quickly replacing the manual
works done cashiers, rental and counter clerks, accounts and telemarketers. The professionals
engaged in these fields have faced high threat from computerization. Previously, worker
losing their routine jobs have opportunities to find jobs in some other industry. However,
today the advanced machine-learning training program have reduced such opportunities8. The
highly computerized techniques not only cause job losing in field of software development
but in other fields as well. Jobs in health care sector, administrative works and many other
areas are threatened as well. Labors face high substitutability in every field that have
deployed artificial intelligence. Job types that are under most pressure include Telemarketers,
Accountants and auditors, Retail salespeople, Technical writer, Real-estate sales agents,
typist and word processors and such others.
References
7 'Automation And Anxiety' (The Economist, 2018) <http://www.economist.com/news/special-report/21700758-
will-smarter-machines-cause-mass-unemployment-automation-and-anxiety> accessed 20 March 2018
8 McKenzie, Richard B., and Dwight R. Lee. Microeconomics for MBAs. Cambridge University Press, 2016.
⊘ This is a preview!⊘
Do you want full access?
Subscribe today to unlock all pages.
Trusted by 1+ million students worldwide
9MICROECONOMIC ANALYSIS
'Automation And Anxiety' (The Economist, 2018) <http://www.economist.com/news/special-
report/21700758-will-smarter-machines-cause-mass-unemployment-automation-and-
anxiety> accessed 20 March 2018
Baumol, William J., and Alan S. Blinder. Microeconomics: Principles and policy. Cengage
Learning, 2015.
'Changes To The Child Care Rebate System' (NewsComAu, 2018)
<http://www.news.com.au/lifestyle/parenting/what-the-child-care-changes-mean-for-you/
news-story/75447014c6e02d23f2b6aec34711e5d9> accessed 20 March 2018
Currie, David, David Peel, and Will Peters, eds. Microeconomic Analysis (Routledge
Revivals): Essays in Microeconomics and Economic Development. Routledge, 2016.
Fine, Ben. "Microeconomics." University of Chicago Press Economics Books (2016).
'Forbes Welcome' (Forbes.com, 2018)
<http://www.forbes.com/sites/daniellemarceau/2016/11/22/low-food-costs-oversupply-and-
changing-consumer-preferences-spell-bad-news-for-restaurant-industry/#7ef7bd177e72>
accessed 20 March 2018
McKenzie, Richard B., and Dwight R. Lee. Microeconomics for MBAs. Cambridge
University Press, 2016.
'Supply-Side Guru Arthur Laffer Hails Trump’S Tax Policy' (Ft.com, 2018)
<https://www.ft.com/content/8cb63288-bc85-11e6-8b45-b8b81dd5d080> accessed 20 March
2018.
1 out of 10

Your All-in-One AI-Powered Toolkit for Academic Success.
+13062052269
info@desklib.com
Available 24*7 on WhatsApp / Email
![[object Object]](/_next/static/media/star-bottom.7253800d.svg)
Unlock your academic potential
Copyright © 2020–2026 A2Z Services. All Rights Reserved. Developed and managed by ZUCOL.