Business Economics BUECO5903: Microeconomics Assignment Analysis

Verified

Added on  2022/12/28

|9
|1593
|97
Homework Assignment
AI Summary
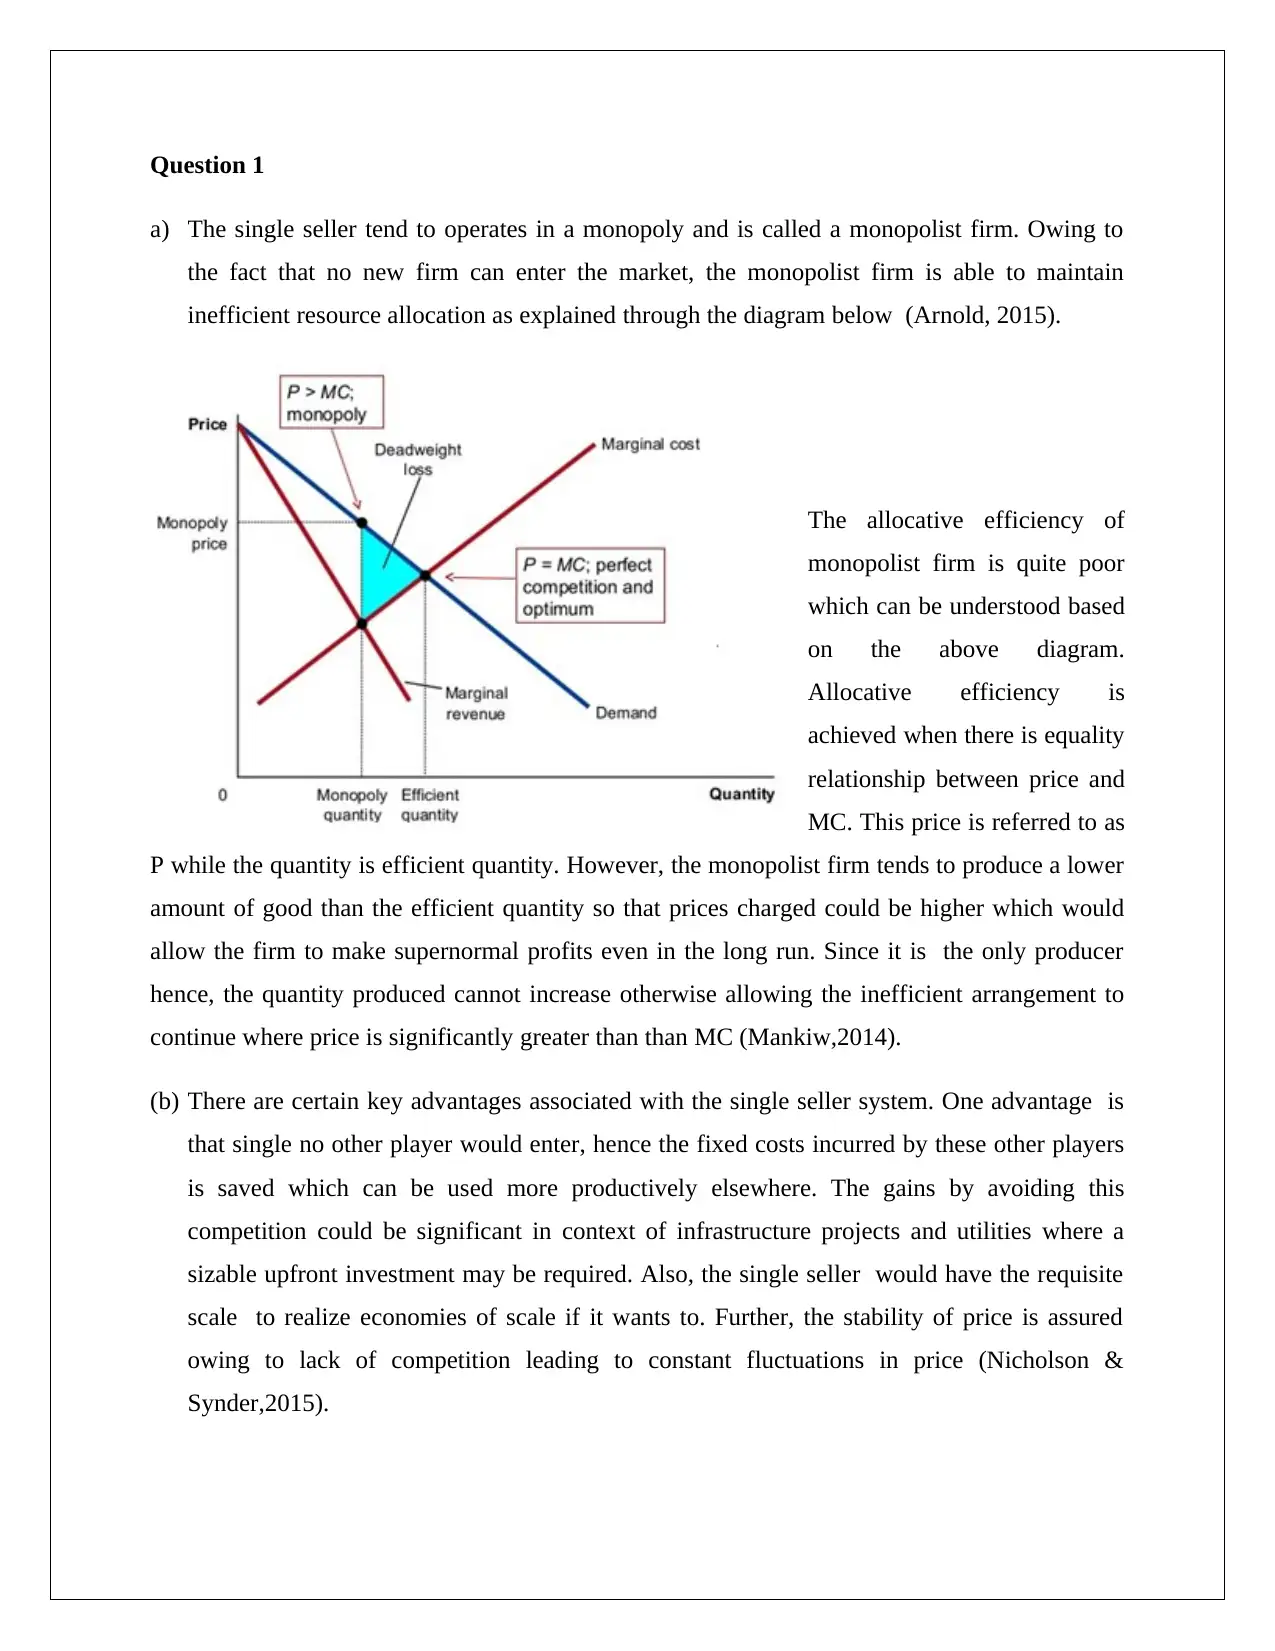
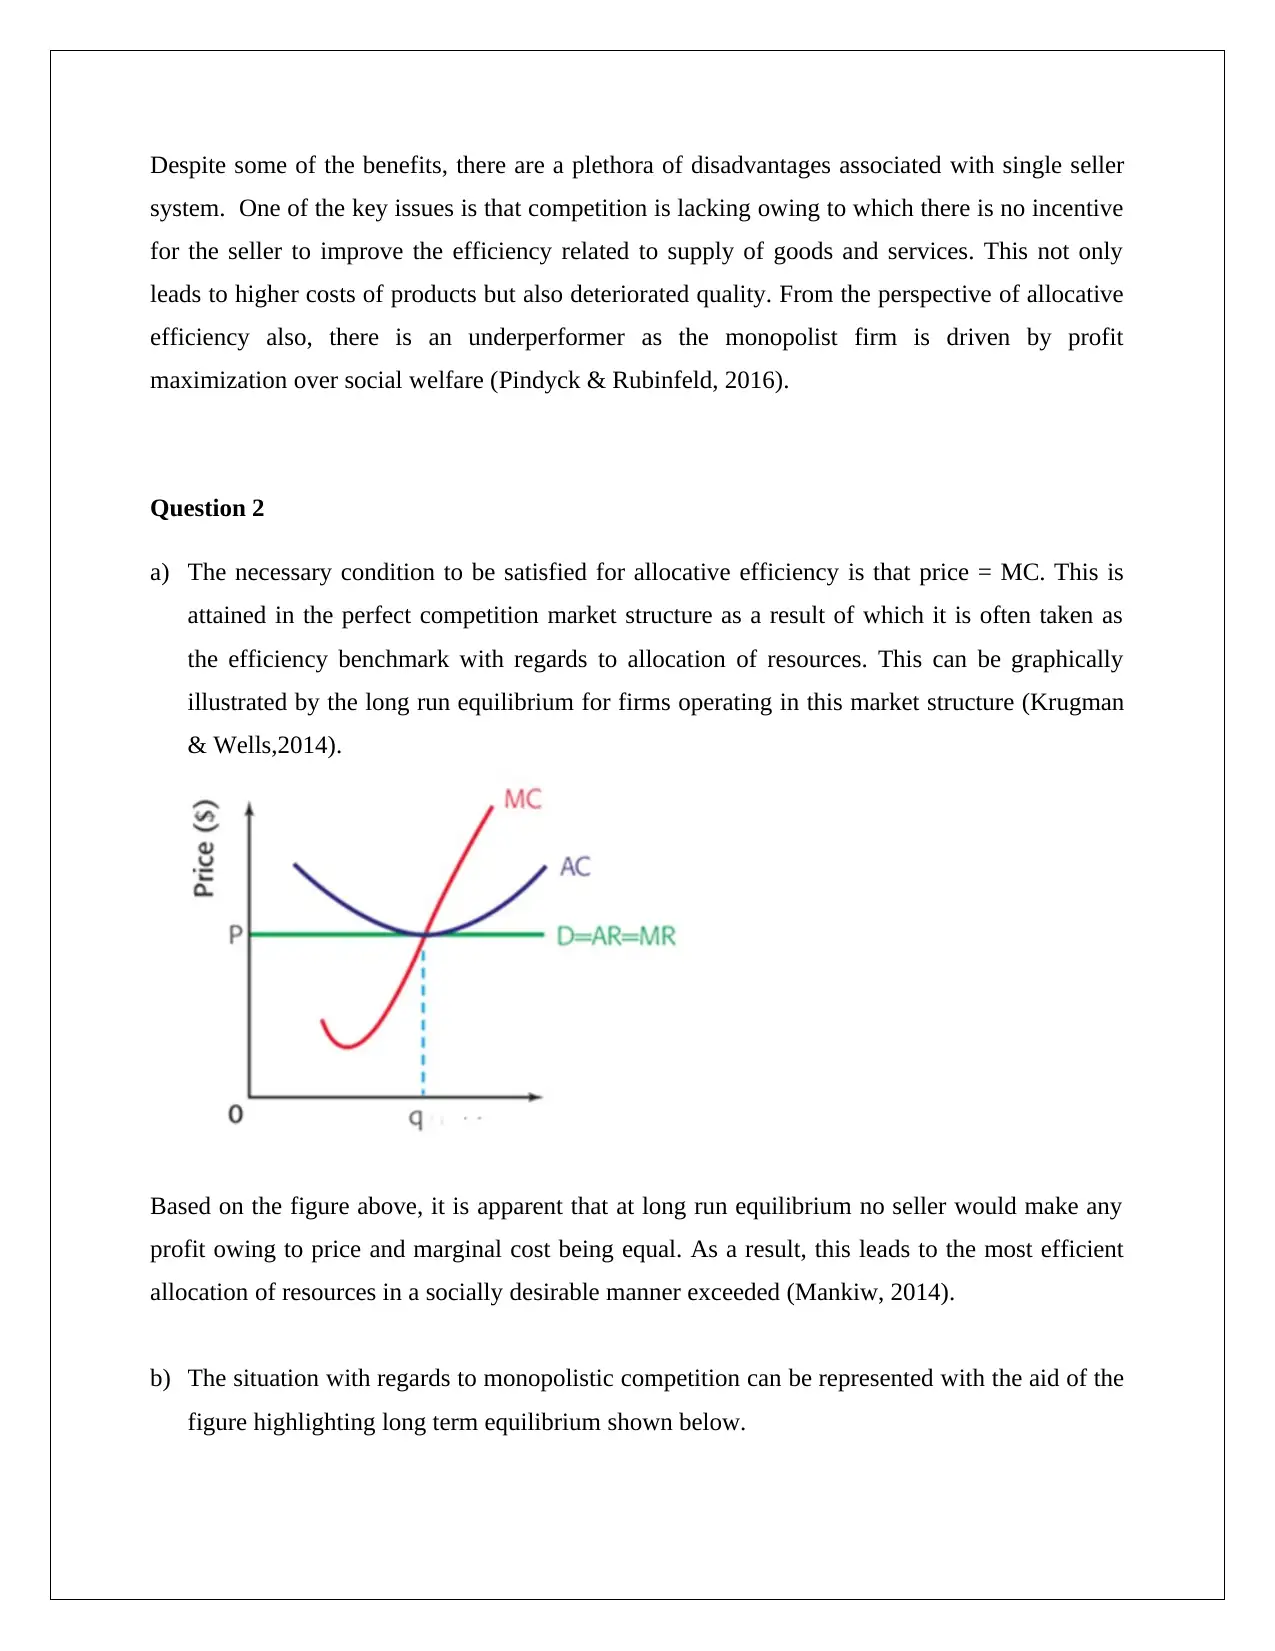
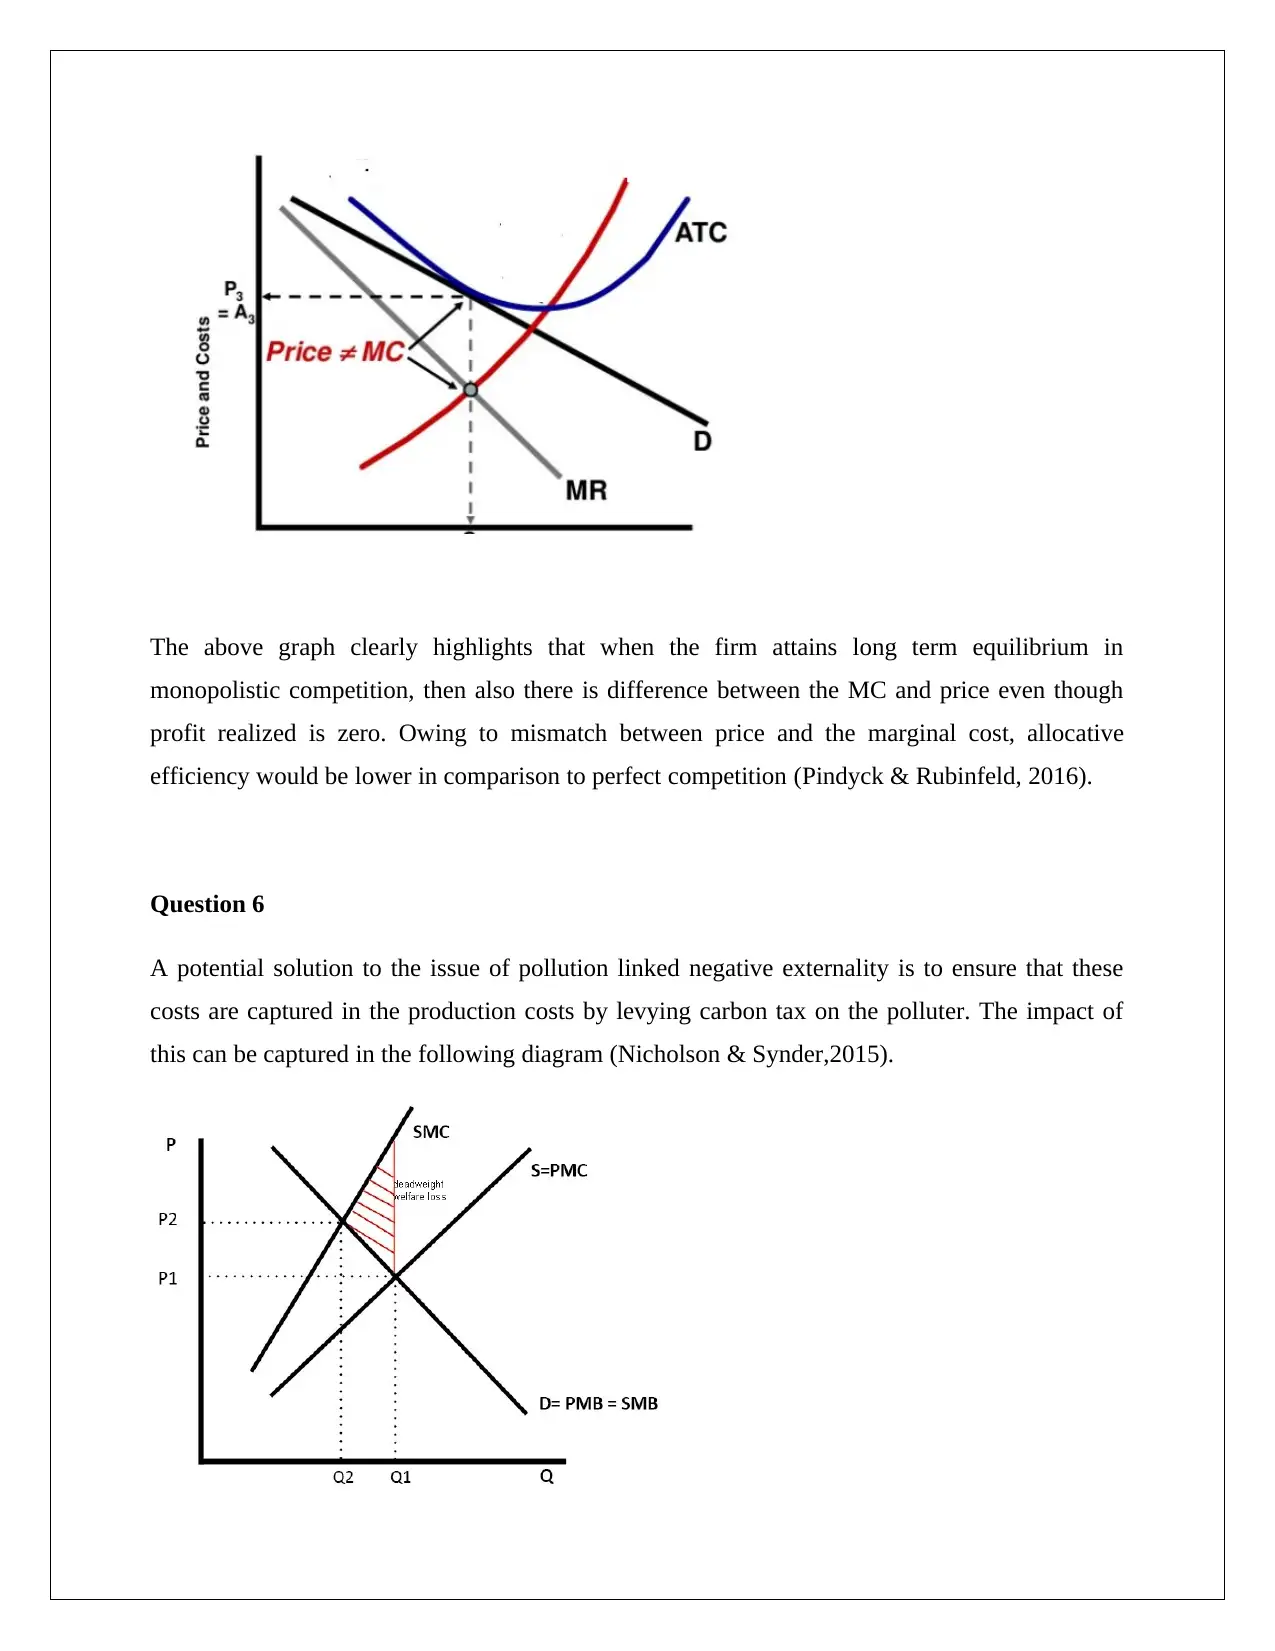
This document presents a comprehensive solution to a microeconomics assignment, addressing key concepts such as allocative efficiency, market structures (monopoly, perfect competition, and monopolistic competition), and externalities. The assignment analyzes the inefficiencies of a single seller, comparing its advantages and disadvantages, and explores how different market structures achieve or fail to achieve allocative efficiency. It also delves into the impact of carbon taxes and quota-based emission systems on pollution, and examines firm behavior in the short and long run, including shutdown decisions. The solution includes graphical illustrations and detailed explanations, providing a thorough understanding of the economic principles involved. Furthermore, the assignment provides a numerical analysis of a firm's profit maximization and shutdown decisions based on marginal cost, average total cost, and price.
tabler-icon-diamond-filled.svg

Contribute Materials

Your contribution can guide someone’s learning journey. Share your documents today.
Document Page
MICROECONOMICS
STUDENT ID:
[Pick the date]
tabler-icon-diamond-filled.svg

Secure Best Marks with AI Grader

Need help grading? Try our AI Grader for instant feedback on your assignments.
Document Page
Question 1
a) The single seller tend to operates in a monopoly and is called a monopolist firm. Owing to
the fact that no new firm can enter the market, the monopolist firm is able to maintain
inefficient resource allocation as explained through the diagram below (Arnold, 2015).
The allocative efficiency of
monopolist firm is quite poor
which can be understood based
on the above diagram.
Allocative efficiency is
achieved when there is equality
relationship between price and
MC. This price is referred to as
P while the quantity is efficient quantity. However, the monopolist firm tends to produce a lower
amount of good than the efficient quantity so that prices charged could be higher which would
allow the firm to make supernormal profits even in the long run. Since it is the only producer
hence, the quantity produced cannot increase otherwise allowing the inefficient arrangement to
continue where price is significantly greater than than MC (Mankiw,2014).
(b) There are certain key advantages associated with the single seller system. One advantage is
that single no other player would enter, hence the fixed costs incurred by these other players
is saved which can be used more productively elsewhere. The gains by avoiding this
competition could be significant in context of infrastructure projects and utilities where a
sizable upfront investment may be required. Also, the single seller would have the requisite
scale to realize economies of scale if it wants to. Further, the stability of price is assured
owing to lack of competition leading to constant fluctuations in price (Nicholson &
Synder,2015).
Document Page
Despite some of the benefits, there are a plethora of disadvantages associated with single seller
system. One of the key issues is that competition is lacking owing to which there is no incentive
for the seller to improve the efficiency related to supply of goods and services. This not only
leads to higher costs of products but also deteriorated quality. From the perspective of allocative
efficiency also, there is an underperformer as the monopolist firm is driven by profit
maximization over social welfare (Pindyck & Rubinfeld, 2016).
Question 2
a) The necessary condition to be satisfied for allocative efficiency is that price = MC. This is
attained in the perfect competition market structure as a result of which it is often taken as
the efficiency benchmark with regards to allocation of resources. This can be graphically
illustrated by the long run equilibrium for firms operating in this market structure (Krugman
& Wells,2014).
Based on the figure above, it is apparent that at long run equilibrium no seller would make any
profit owing to price and marginal cost being equal. As a result, this leads to the most efficient
allocation of resources in a socially desirable manner exceeded (Mankiw, 2014).
b) The situation with regards to monopolistic competition can be represented with the aid of the
figure highlighting long term equilibrium shown below.
Document Page
The above graph clearly highlights that when the firm attains long term equilibrium in
monopolistic competition, then also there is difference between the MC and price even though
profit realized is zero. Owing to mismatch between price and the marginal cost, allocative
efficiency would be lower in comparison to perfect competition (Pindyck & Rubinfeld, 2016).
Question 6
A potential solution to the issue of pollution linked negative externality is to ensure that these
costs are captured in the production costs by levying carbon tax on the polluter. The impact of
this can be captured in the following diagram (Nicholson & Synder,2015).
tabler-icon-diamond-filled.svg

Secure Best Marks with AI Grader

Need help grading? Try our AI Grader for instant feedback on your assignments.
Document Page
On the basis of the above diagram, it is clear that imposition of carbon tax leads to shift of supply
cost to a more socially desirable level as the underlying negative externalities are priced in the
production costs. The demand curve does not alter leading to a new equilibrium point where the
quantity consumed of the product would decline. From the perspective of social welfare, this is
desirable as lesser production would cause lower environmental pollution (Samuelson &
Marks,2015).
An alternative system which focuses on providing incentive to producers for reduced pollution is
the quota based emission system. In this system, the government based on the desirable
emissions level provides quotas to the various polluting industries. It is expected that these
industries would adhere to the emission norms as incremental emissions would require emission
certificates to be bought from other industries which may have a surplus owing to lesser
emissions than the quota. The demand supply theory is applicable to this system as exhibited
below (Arnold,2015).
In the graph above, the supply of emission permits is kept constant by the government but as the
pollution level rise there would be higher demand for permits which would increase the price. On
one hand, this would act as a deterrent for the polluting firms not to increase the emissions level
while on the other, it would act as an incentive for firms that have surplus of emission quota and
can monetize the same (Pinkdyck and Rubinfield, 2016).
Document Page
Question 7
(a) In order to opine on the accuracy of the statement, it is imperative to consider the condition
for firm shutdown in short run and long run,
For the short term, a firm should operate only if P≥AVC or else the losses would keep on
mounting. It is noteworthy that in the short term the endeavor is not to necessary recover the
fixed costs but to ensure that more loss should not occur. In the long term, a firm should
operate only if P≥ATC. The average total cost would also comprise a portion of the fixed
cost. Hence, the decision to shutdown or operate the firm in the long run would not be
dependent only on the variable cost but also the fixed cost (Krugman & Wells, 2014).
As a result, I do not agree with the given statement from the perspective of long term shut
down.
(b) To verity the extent of accuracy of the given statement, the long term equilibrium of a firm
operating in monopoly has been considered as highlighted below.
A key observation from the above graph is that the equilibrium price is indicated by P while
the ATC at equilibrium is indicated by P’. It is apparent from the graph that P>P’ which
Document Page
would imply that the firm is profitable at equilibrium i.e. when MR=MC. Clearly, the given
statement is not true as firm is realizing profit at MR=MC (Mankiw, 2014).
Question 8
(a) The intersection of MR and MC curve for $ 8 would take place at the quantity level of 70
units which is the equilibrium quantity.
(b) The corresponding average total cost at the above equilibrium point is $ 6.
(c) Profit = (Unit Price – ATC)*Equilibrium Quantity = ($8 - $6)*70 = $140
(d) The intersection of MR and MC curve for $ 5 would take place at the quantity level of 50
units which is the equilibrium quantity.
(e) The corresponding average total cost at the above equilibrium point is $ 5.
Profit = (Unit Price – ATC)*Equilibrium Quantity = ($5 - $5)*50= $0
(f) The intersection of MR and MC curve for $ 4 would take place at the quantity level of 40
units which is the equilibrium quantity.
(g) The corresponding average total cost at the above equilibrium point is $ 5.5.
Profit = (Unit Price – ATC)*Equilibrium quantity = ($4 - $5.5)*40 = -$60
(h) In the short term, firm should only shut down operations when the price dips below AVC or
$ 3.5 per unit in the given scenario.
tabler-icon-diamond-filled.svg

Paraphrase This Document

Need a fresh take? Get an instant paraphrase of this document with our AI Paraphraser
Document Page
(i) In the long run, firm should only shut down operations when the price dips below ATC or $ 5
per unit in the given scenario.
References
Arnold, A.R. (2015). Microeconomics (9thed.). Sydney: Cengage Learning.
Krugman,P. & Wells, R. (2014).Microeconomics (2nded.). London: Worth Publishers.
Mankiw, G. (2014) Microeconomics (6thed.). London: Worth Publishers.
Nicholson, W. & Snyder, C. (2015).Fundamentals of Microeconomics (11thed.). New York:
Cengage Learning.
Pindyck, R. & Rubinfeld, D. (2014).Microeconomics (5th ed.). London: Prentice-Hall
Publications.
Samuelson, W. & Marks, S. (2015). Managerial Economics (4th ed.). New York: Wiley
Publications.
Document Page
chevron_up_icon
1 out of 9
circle_padding
hide_on_mobile
zoom_out_icon
logo.png

Your All-in-One AI-Powered Toolkit for Academic Success.

Available 24*7 on WhatsApp / Email

[object Object]