Microeconomics Assignment: Price Floors, Tariffs, and Bicycle Demand
VerifiedAdded on 2022/08/19
|15
|2879
|17
Homework Assignment
AI Summary
This microeconomics assignment analyzes various market scenarios and economic policies. It begins by examining the equilibrium in the banana market, illustrating how shifts in supply and demand affect prices and quantities. The assignment then delves into the effects of a price floor on wheat, analyzing its impact on consumer and producer surplus, as well as the resulting deadweight loss. Furthermore, it explores the consequences of imposing tariffs on tyres, detailing changes in market dynamics, surplus distribution, and social welfare. Finally, the assignment considers the relationship between the price of motor vehicles and the demand for bicycles, using cross-price elasticity to explain how changes in one market influence the other. The analysis includes graphical representations to support the explanations.
Running head: MICROECONOMICS
Microeconomics
Name of the Student
Name of the University
Student ID
Microeconomics
Name of the Student
Name of the University
Student ID
Paraphrase This Document
Need a fresh take? Get an instant paraphrase of this document with our AI Paraphraser
1MICROECONOMICS
Table of Contents
Answer 1..........................................................................................................................................2
Answer 2..........................................................................................................................................5
Answer 3..........................................................................................................................................9
Reference.......................................................................................................................................11
2MICROECONOMICS
Answer 1
(a)
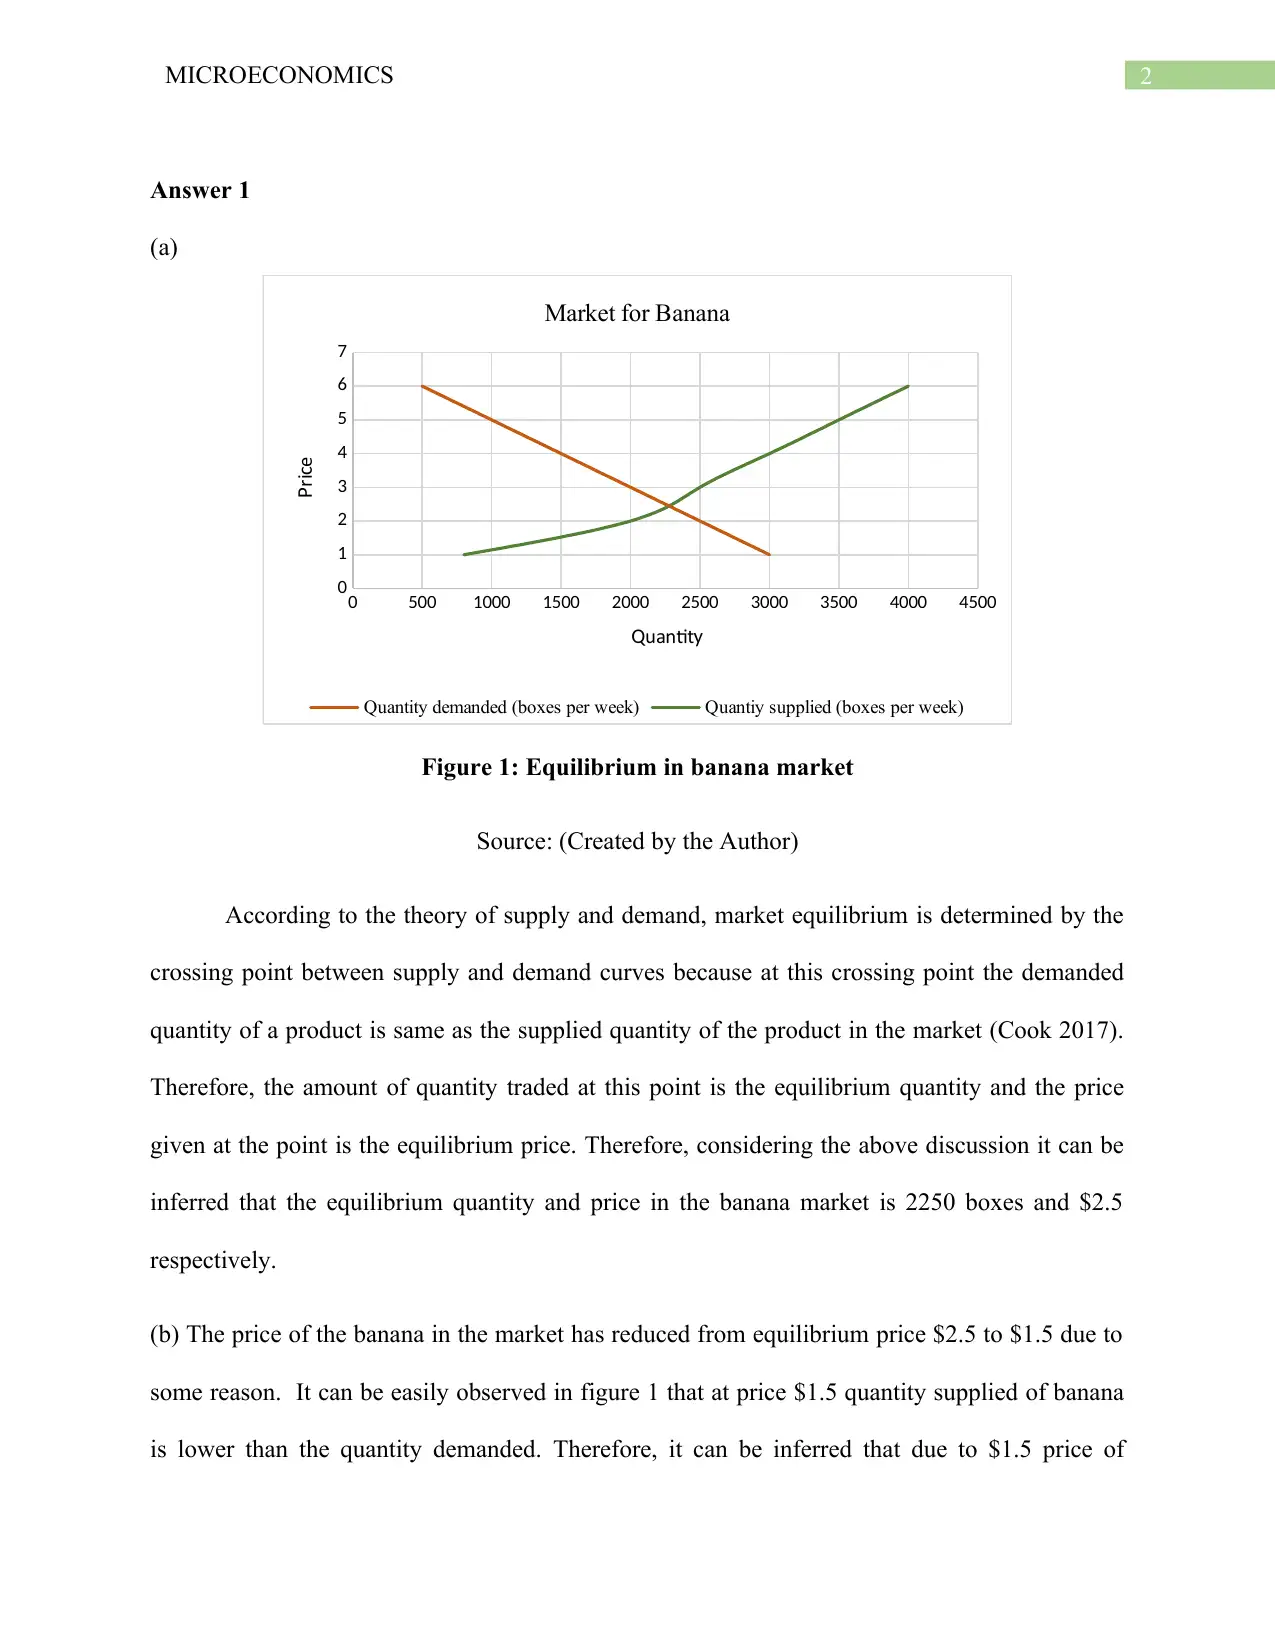
Figure 1: Equilibrium in banana market
Source: (Created by the Author)
According to the theory of supply and demand, market equilibrium is determined by the
crossing point between supply and demand curves because at this crossing point the demanded
quantity of a product is same as the supplied quantity of the product in the market (Cook 2017).
Therefore, the amount of quantity traded at this point is the equilibrium quantity and the price
given at the point is the equilibrium price. Therefore, considering the above discussion it can be
inferred that the equilibrium quantity and price in the banana market is 2250 boxes and $2.5
respectively.
(b) The price of the banana in the market has reduced from equilibrium price $2.5 to $1.5 due to
some reason. It can be easily observed in figure 1 that at price $1.5 quantity supplied of banana
is lower than the quantity demanded. Therefore, it can be inferred that due to $1.5 price of
0 500 1000 1500 2000 2500 3000 3500 4000 4500
0
1
2
3
4
5
6
7
Market for Banana
Quantity demanded (boxes per week) Quantiy supplied (boxes per week)
uantitQ y
ri eP c
Answer 1
(a)
Figure 1: Equilibrium in banana market
Source: (Created by the Author)
According to the theory of supply and demand, market equilibrium is determined by the
crossing point between supply and demand curves because at this crossing point the demanded
quantity of a product is same as the supplied quantity of the product in the market (Cook 2017).
Therefore, the amount of quantity traded at this point is the equilibrium quantity and the price
given at the point is the equilibrium price. Therefore, considering the above discussion it can be
inferred that the equilibrium quantity and price in the banana market is 2250 boxes and $2.5
respectively.
(b) The price of the banana in the market has reduced from equilibrium price $2.5 to $1.5 due to
some reason. It can be easily observed in figure 1 that at price $1.5 quantity supplied of banana
is lower than the quantity demanded. Therefore, it can be inferred that due to $1.5 price of
0 500 1000 1500 2000 2500 3000 3500 4000 4500
0
1
2
3
4
5
6
7
Market for Banana
Quantity demanded (boxes per week) Quantiy supplied (boxes per week)
uantitQ y
ri eP c
⊘ This is a preview!⊘
Do you want full access?
Subscribe today to unlock all pages.
Trusted by 1+ million students worldwide
3MICROECONOMICS
banana there is a shortage in the market (Aragon 2016). Hence, there is excess demand in the
market of banana. Perceiving the profit prospect, the suppliers of banana will increase the price
to the level till which the consumers are willing to pay in order to meet their excess demand. In
addition to this, the suppliers will increase the supply in order to increase revenue and thereby
profit (Norvell and Horky 2017). Thus, after adjustment, the market will operate at the
equilibrium where price is $2.5 and quantity is 2250 boxes.
(c)
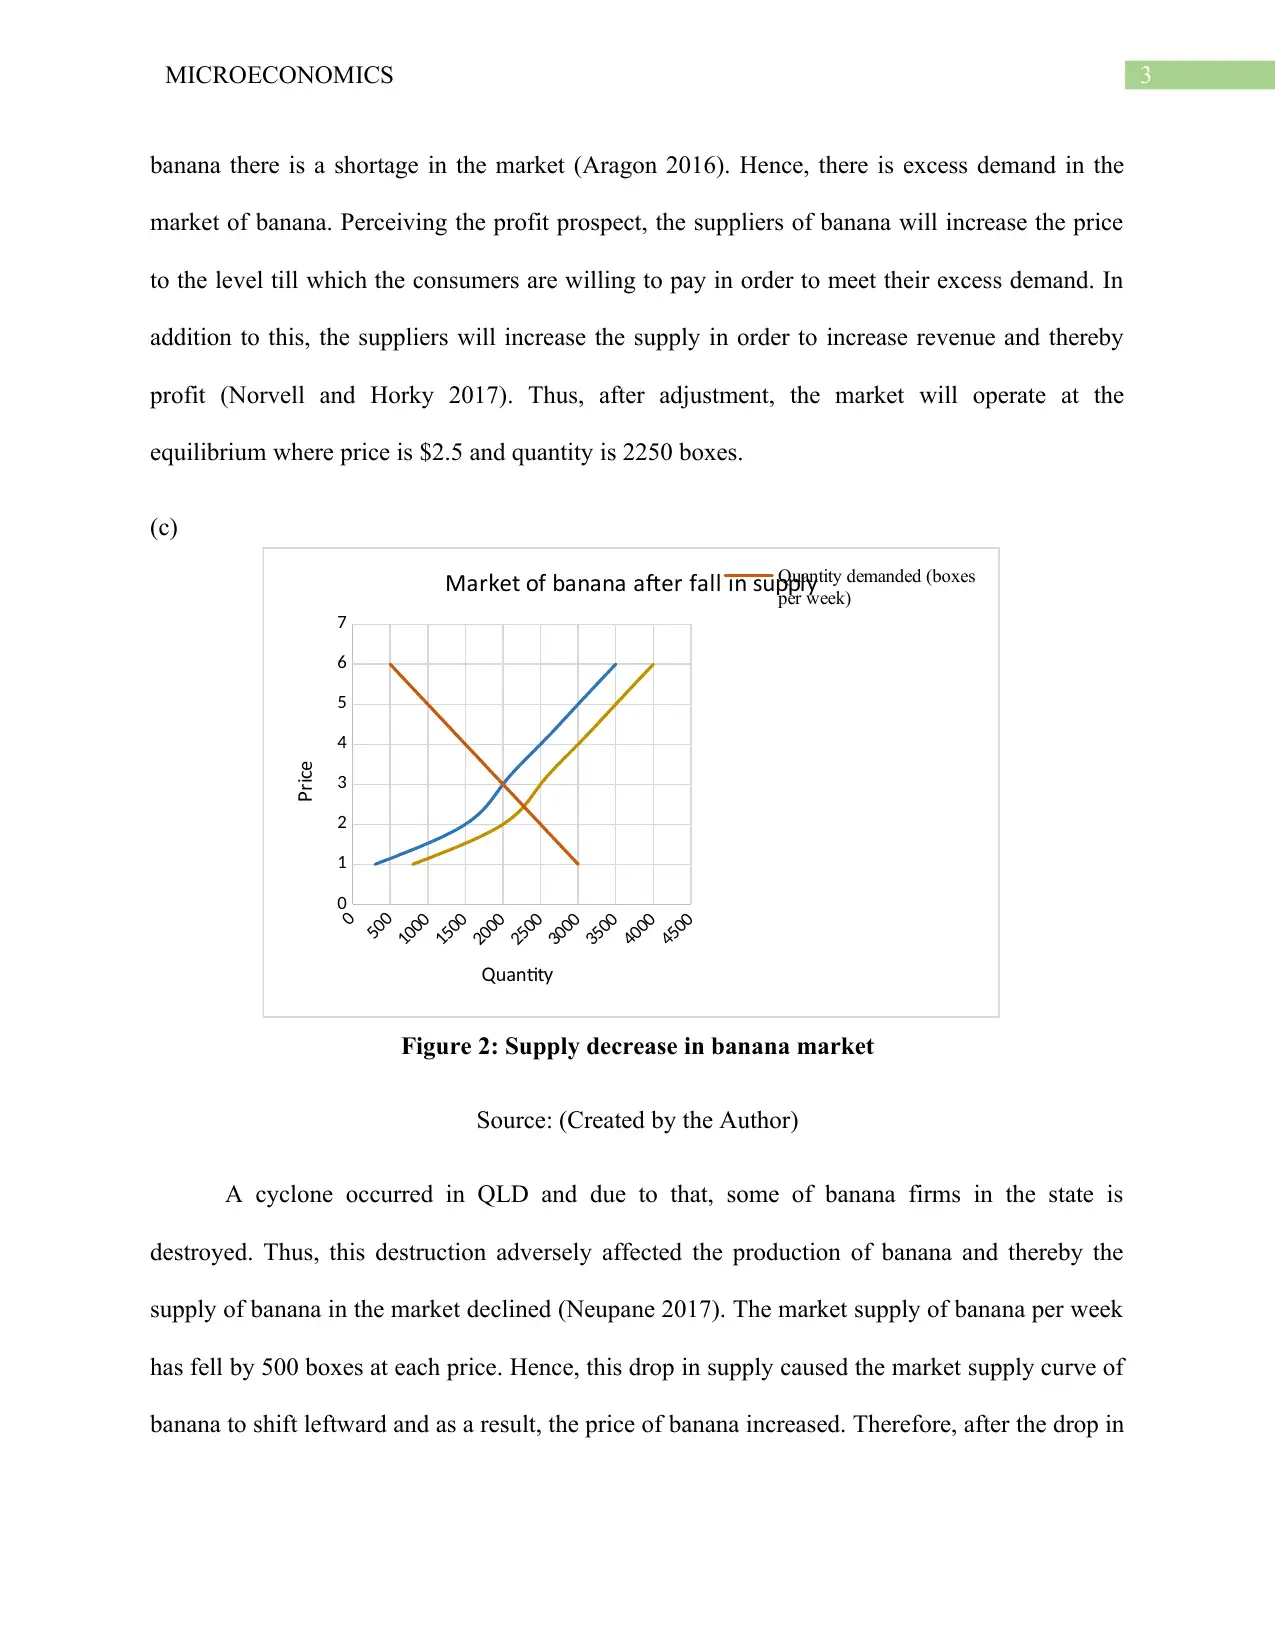
Figure 2: Supply decrease in banana market
Source: (Created by the Author)
A cyclone occurred in QLD and due to that, some of banana firms in the state is
destroyed. Thus, this destruction adversely affected the production of banana and thereby the
supply of banana in the market declined (Neupane 2017). The market supply of banana per week
has fell by 500 boxes at each price. Hence, this drop in supply caused the market supply curve of
banana to shift leftward and as a result, the price of banana increased. Therefore, after the drop in
0
500
1000
1500
2000
2500
3000
3500
4000
4500
0
1
2
3
4
5
6
7
Mar et of banana after fall in su lk pp yQuantity demanded (boxes
per week)
uantitQ y
ri eP c
banana there is a shortage in the market (Aragon 2016). Hence, there is excess demand in the
market of banana. Perceiving the profit prospect, the suppliers of banana will increase the price
to the level till which the consumers are willing to pay in order to meet their excess demand. In
addition to this, the suppliers will increase the supply in order to increase revenue and thereby
profit (Norvell and Horky 2017). Thus, after adjustment, the market will operate at the
equilibrium where price is $2.5 and quantity is 2250 boxes.
(c)
Figure 2: Supply decrease in banana market
Source: (Created by the Author)
A cyclone occurred in QLD and due to that, some of banana firms in the state is
destroyed. Thus, this destruction adversely affected the production of banana and thereby the
supply of banana in the market declined (Neupane 2017). The market supply of banana per week
has fell by 500 boxes at each price. Hence, this drop in supply caused the market supply curve of
banana to shift leftward and as a result, the price of banana increased. Therefore, after the drop in
0
500
1000
1500
2000
2500
3000
3500
4000
4500
0
1
2
3
4
5
6
7
Mar et of banana after fall in su lk pp yQuantity demanded (boxes
per week)
uantitQ y
ri eP c
Paraphrase This Document
Need a fresh take? Get an instant paraphrase of this document with our AI Paraphraser

4MICROECONOMICS
supply of banana, the equilibrium banana market price rises to $3 and at this price equilibrium
quantity is 2000 boxes.
supply of banana, the equilibrium banana market price rises to $3 and at this price equilibrium
quantity is 2000 boxes.
5MICROECONOMICS
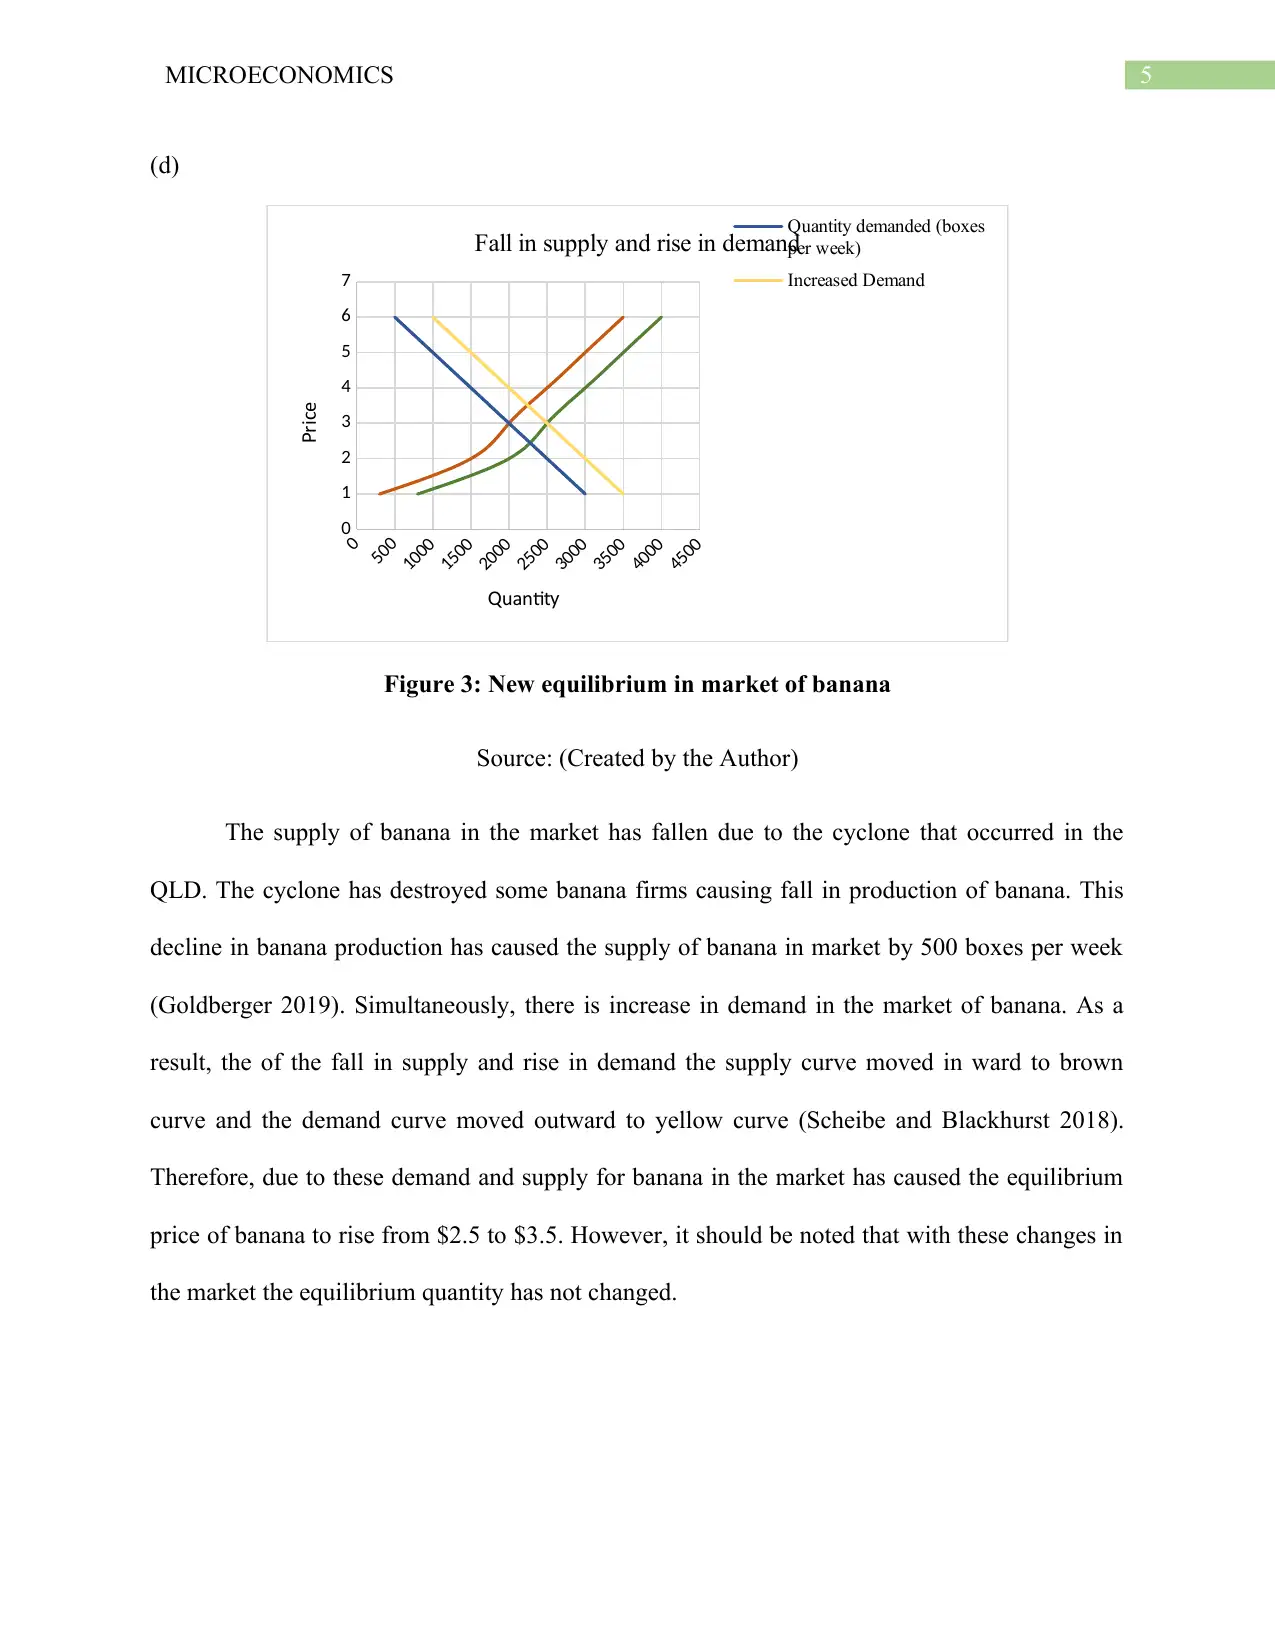
(d)
Figure 3: New equilibrium in market of banana
Source: (Created by the Author)
The supply of banana in the market has fallen due to the cyclone that occurred in the
QLD. The cyclone has destroyed some banana firms causing fall in production of banana. This
decline in banana production has caused the supply of banana in market by 500 boxes per week
(Goldberger 2019). Simultaneously, there is increase in demand in the market of banana. As a
result, the of the fall in supply and rise in demand the supply curve moved in ward to brown
curve and the demand curve moved outward to yellow curve (Scheibe and Blackhurst 2018).
Therefore, due to these demand and supply for banana in the market has caused the equilibrium
price of banana to rise from $2.5 to $3.5. However, it should be noted that with these changes in
the market the equilibrium quantity has not changed.
0
500
1000
1500
2000
2500
3000
3500
4000
4500
0
1
2
3
4
5
6
7
Fall in supply and rise in demand
Quantity demanded (boxes
per week)
Increased Demand
uantitQ y
ri eP c
⊘ This is a preview!⊘
Do you want full access?
Subscribe today to unlock all pages.
Trusted by 1+ million students worldwide
6MICROECONOMICS
Answer 2
(a)
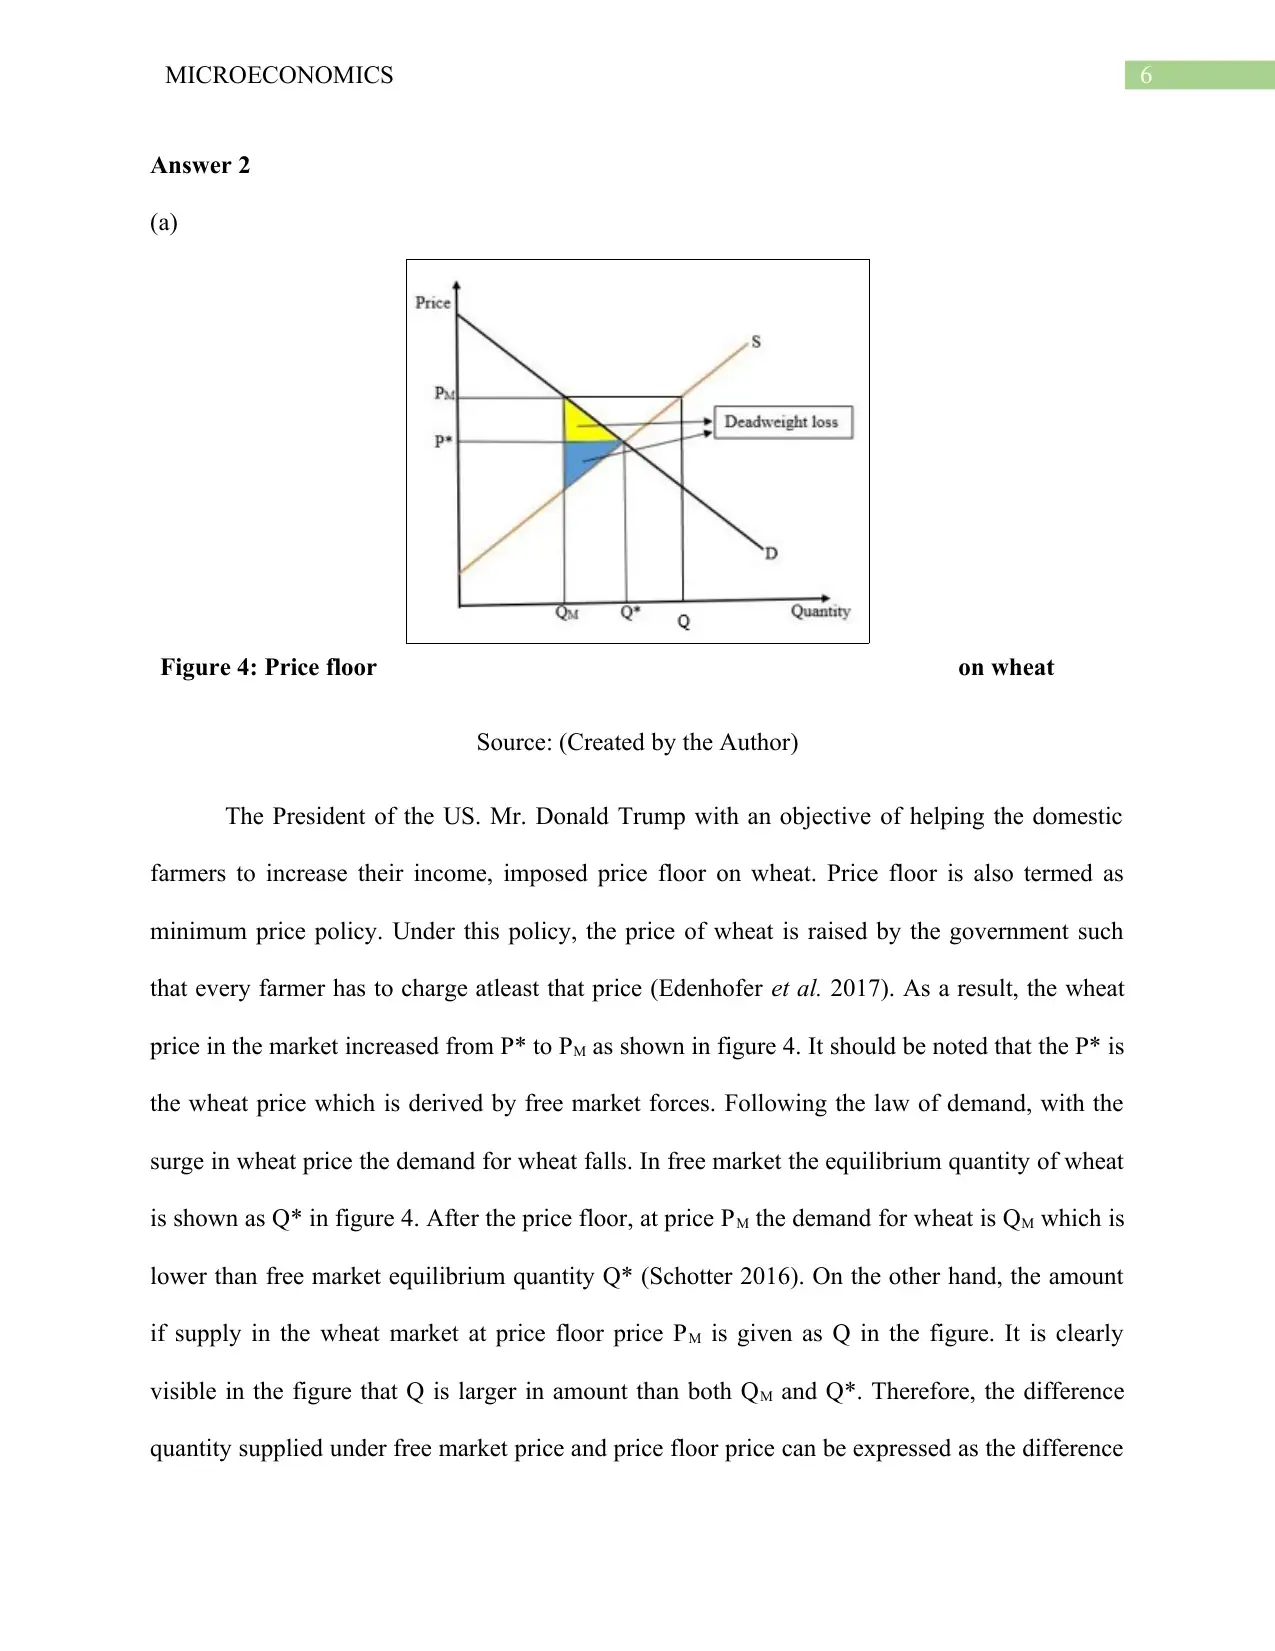
Figure 4: Price floor on wheat
Source: (Created by the Author)
The President of the US. Mr. Donald Trump with an objective of helping the domestic
farmers to increase their income, imposed price floor on wheat. Price floor is also termed as
minimum price policy. Under this policy, the price of wheat is raised by the government such
that every farmer has to charge atleast that price (Edenhofer et al. 2017). As a result, the wheat
price in the market increased from P* to PM as shown in figure 4. It should be noted that the P* is
the wheat price which is derived by free market forces. Following the law of demand, with the
surge in wheat price the demand for wheat falls. In free market the equilibrium quantity of wheat
is shown as Q* in figure 4. After the price floor, at price PM the demand for wheat is QM which is
lower than free market equilibrium quantity Q* (Schotter 2016). On the other hand, the amount
if supply in the wheat market at price floor price PM is given as Q in the figure. It is clearly
visible in the figure that Q is larger in amount than both QM and Q*. Therefore, the difference
quantity supplied under free market price and price floor price can be expressed as the difference
Answer 2
(a)
Figure 4: Price floor on wheat
Source: (Created by the Author)
The President of the US. Mr. Donald Trump with an objective of helping the domestic
farmers to increase their income, imposed price floor on wheat. Price floor is also termed as
minimum price policy. Under this policy, the price of wheat is raised by the government such
that every farmer has to charge atleast that price (Edenhofer et al. 2017). As a result, the wheat
price in the market increased from P* to PM as shown in figure 4. It should be noted that the P* is
the wheat price which is derived by free market forces. Following the law of demand, with the
surge in wheat price the demand for wheat falls. In free market the equilibrium quantity of wheat
is shown as Q* in figure 4. After the price floor, at price PM the demand for wheat is QM which is
lower than free market equilibrium quantity Q* (Schotter 2016). On the other hand, the amount
if supply in the wheat market at price floor price PM is given as Q in the figure. It is clearly
visible in the figure that Q is larger in amount than both QM and Q*. Therefore, the difference
quantity supplied under free market price and price floor price can be expressed as the difference
Paraphrase This Document
Need a fresh take? Get an instant paraphrase of this document with our AI Paraphraser
7MICROECONOMICS
between Q and QM. The difference between these two quantities is positive since Q is greater
than QM. This rise in supply occurred because at higher price suppliers perceived that there will
be higher profit and thus raised supply. Therefore, it can be inferred based on the above
discussion that after implementation of price floor in the wheat market in the US there is surplus
in the market.
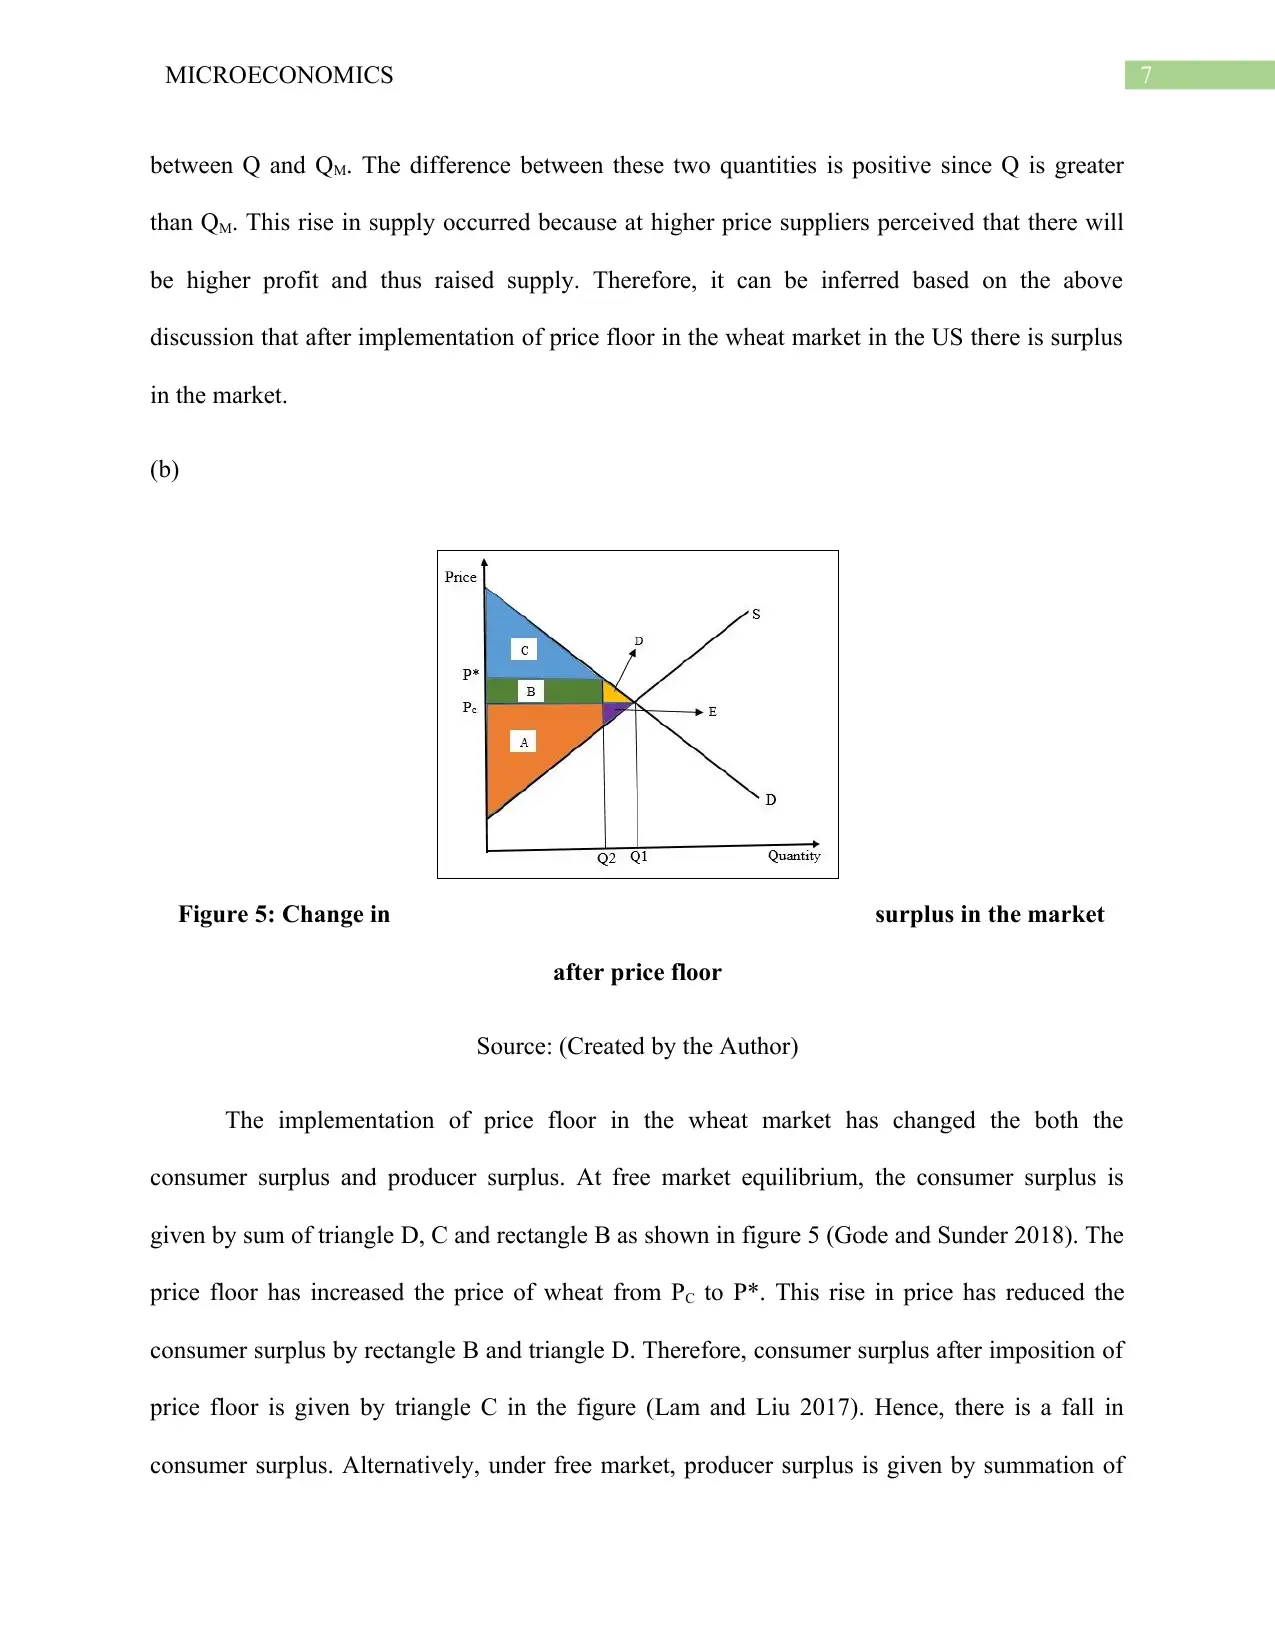
(b)
Figure 5: Change in surplus in the market
after price floor
Source: (Created by the Author)
The implementation of price floor in the wheat market has changed the both the
consumer surplus and producer surplus. At free market equilibrium, the consumer surplus is
given by sum of triangle D, C and rectangle B as shown in figure 5 (Gode and Sunder 2018). The
price floor has increased the price of wheat from PC to P*. This rise in price has reduced the
consumer surplus by rectangle B and triangle D. Therefore, consumer surplus after imposition of
price floor is given by triangle C in the figure (Lam and Liu 2017). Hence, there is a fall in
consumer surplus. Alternatively, under free market, producer surplus is given by summation of
between Q and QM. The difference between these two quantities is positive since Q is greater
than QM. This rise in supply occurred because at higher price suppliers perceived that there will
be higher profit and thus raised supply. Therefore, it can be inferred based on the above
discussion that after implementation of price floor in the wheat market in the US there is surplus
in the market.
(b)
Figure 5: Change in surplus in the market
after price floor
Source: (Created by the Author)
The implementation of price floor in the wheat market has changed the both the
consumer surplus and producer surplus. At free market equilibrium, the consumer surplus is
given by sum of triangle D, C and rectangle B as shown in figure 5 (Gode and Sunder 2018). The
price floor has increased the price of wheat from PC to P*. This rise in price has reduced the
consumer surplus by rectangle B and triangle D. Therefore, consumer surplus after imposition of
price floor is given by triangle C in the figure (Lam and Liu 2017). Hence, there is a fall in
consumer surplus. Alternatively, under free market, producer surplus is given by summation of
8MICROECONOMICS
triangle E and quadrilateral A as given in the figure. However, after price floor, there is both fall
and rise in producer surplus. The producer surplus declined by triangle E but increased by
rectangle B. It is clearly visible from figure 5 that rectangle B is larger in area than triangle E.
Therefore, it can be inferred that there is an increase in producer surplus after imposition of price
floor. Finally, it can be observed that triangle D and E are lost surplus and thus this is the loss in
social welfare. Thus, triangle D and E represent the deadweight loss due to implementation of
price floor in wheat market in the US.
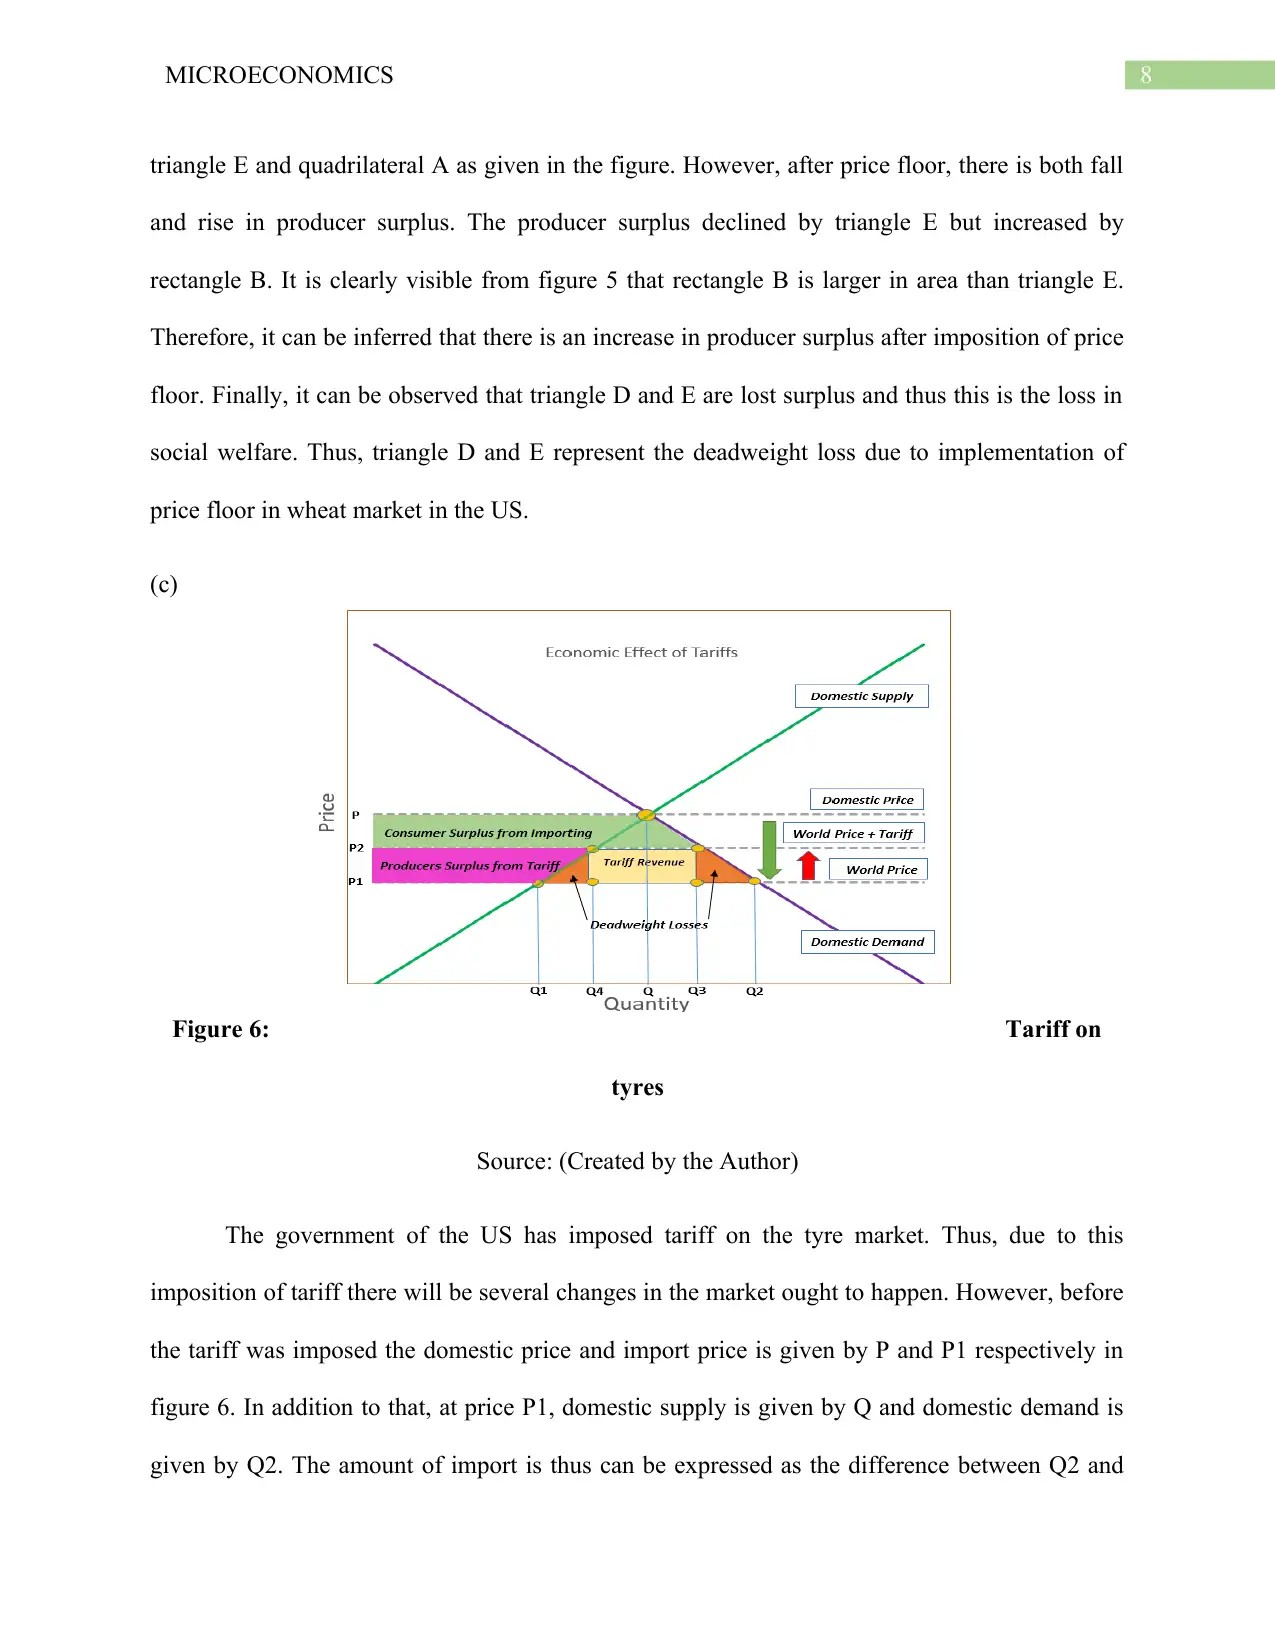
(c)
Figure 6: Tariff on
tyres
Source: (Created by the Author)
The government of the US has imposed tariff on the tyre market. Thus, due to this
imposition of tariff there will be several changes in the market ought to happen. However, before
the tariff was imposed the domestic price and import price is given by P and P1 respectively in
figure 6. In addition to that, at price P1, domestic supply is given by Q and domestic demand is
given by Q2. The amount of import is thus can be expressed as the difference between Q2 and
triangle E and quadrilateral A as given in the figure. However, after price floor, there is both fall
and rise in producer surplus. The producer surplus declined by triangle E but increased by
rectangle B. It is clearly visible from figure 5 that rectangle B is larger in area than triangle E.
Therefore, it can be inferred that there is an increase in producer surplus after imposition of price
floor. Finally, it can be observed that triangle D and E are lost surplus and thus this is the loss in
social welfare. Thus, triangle D and E represent the deadweight loss due to implementation of
price floor in wheat market in the US.
(c)
Figure 6: Tariff on
tyres
Source: (Created by the Author)
The government of the US has imposed tariff on the tyre market. Thus, due to this
imposition of tariff there will be several changes in the market ought to happen. However, before
the tariff was imposed the domestic price and import price is given by P and P1 respectively in
figure 6. In addition to that, at price P1, domestic supply is given by Q and domestic demand is
given by Q2. The amount of import is thus can be expressed as the difference between Q2 and
⊘ This is a preview!⊘
Do you want full access?
Subscribe today to unlock all pages.
Trusted by 1+ million students worldwide
9MICROECONOMICS
Q1 (Liepmann 2017). However, after imposition of tariff the import price increased to P2 from
P1, supply in domestic surged to Q4 from Q1and the domestic demand diminished to Q3 from
Q2. Therefore, after tariff import volume of tyres is given by difference between Q3 and Q4. It
has been observed that after tariff import, volume has decreased and domestic sales has
increased. Hence, domestic market has expanded and import market has contracted after the
tariff. Additionally due to tariff, there is change in economic surplus in the market (Xu 2019).
Before tariff, the consumer surplus is given by pink and green quadrilateral, orange triangle and
the rectangle shown as tariff revenue. However, after tariff consumer surplus is given by green
quadrilateral only. There is increase in domestic producers’ surplus due to tariff. The rise in
producer surplus is given by pin quadrilateral. The government has gained revenue, shown as
tariff revenue in figure 6. However, there is social welfare loss due to imposition of tariff, shown
as two orange triangles in the figure. This loss in social welfare is termed as deadweight loss
(Lee et al. 2019). Therefore, it can be said that after imposition of tariff there is a economic
surplus loss in the form of deadweight loss. Thus, the losers in this case are the consumers and
the winners are the producers and the government.
(d) The rules of price floor are meant to improve the condition of producers such that the income
of producers increase. It has been observed that imposition of price floor and tariff has increased
the amount of producer surplus and thus it can be said that the policies are efficient as they
fulfilled the respective objectives. However, it has further been observed that in presence of tariff
there is consumer surplus loss and the fall in total surplus due to social welfare loss in the form
of deadweight loss. Thus, the gain in producer surplus due to price floor and producer surplus
and government revenue in tariff is occurred at the cost of society’s consumers. Therefore, none
of the concerned policies is fair.
Paraphrase This Document
Need a fresh take? Get an instant paraphrase of this document with our AI Paraphraser
10MICROECONOMICS
(e) The policies of price floor and tariff are both efficient in achieving the desired objective of
increasing the welfare of producers but do so at the cost of society’s consumers. Therefore, the
policies are not fair and may lead to social distress owing to imposition of these policies.
Therefore, it is recommended that these policies should not be implemented and if for any reason
the government has to implement the policies then it must be assured that, it is implemented for
short run changes.
Answer 3
A study by Australian Cycle Promotion Foundation (ACPF), top cycling promotion
group in Australia has found that in future the amount of Australian cycle riders would go up to
66% from 33%. The rise in number of bicycle riders is good change as it would benefit the
health of the population of the country and the environment. Alternatively, there are alterations
occurring in the market of automobile and that is too in the technological aspect. However,
driving automobile does not provide health benefits. It has been observed that with rise in
income people tend to become more inclined toward leisure and thus refrain from doing physical
work like cycling. Therefore, the report explains the importance of providing incentive to
encourage cycling by discussing different factors of bicycle market.
The technology in the market of motor vehicle is changing and due to that the production
of cars has become easier and cheaper. Hence, with fall in cost of production there is a decline in
price of cars. Therefore, people who could not afford to buy a car earlier can now buy one. Car is
a faster mode of transport and it has been found that people does not like to time and thus with
fall in price people tend to buy more cars and thus there will be fall in demand for bicycles. It
happens because motor vehicle and bicycle are different modes of transport and thus they are
substitute products.
11MICROECONOMICS
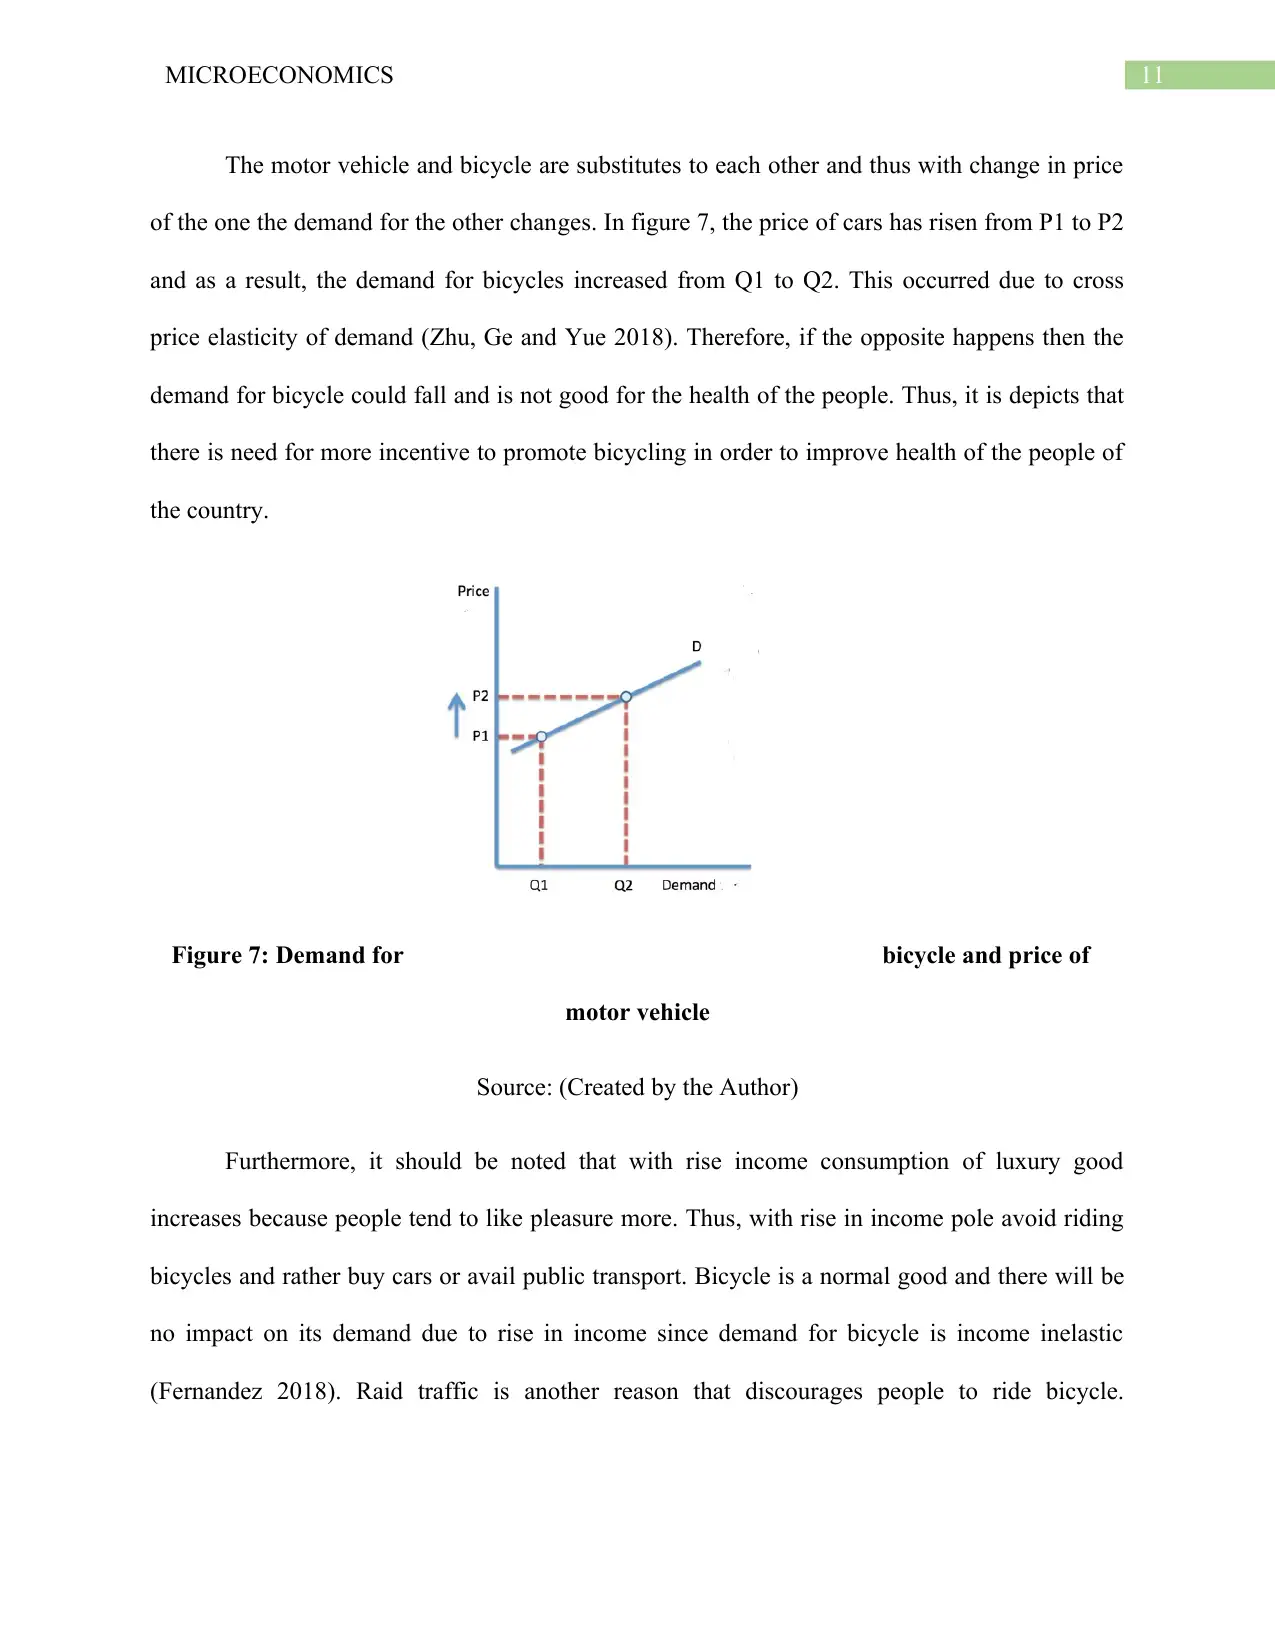
The motor vehicle and bicycle are substitutes to each other and thus with change in price
of the one the demand for the other changes. In figure 7, the price of cars has risen from P1 to P2
and as a result, the demand for bicycles increased from Q1 to Q2. This occurred due to cross
price elasticity of demand (Zhu, Ge and Yue 2018). Therefore, if the opposite happens then the
demand for bicycle could fall and is not good for the health of the people. Thus, it is depicts that
there is need for more incentive to promote bicycling in order to improve health of the people of
the country.
Figure 7: Demand for bicycle and price of
motor vehicle
Source: (Created by the Author)
Furthermore, it should be noted that with rise income consumption of luxury good
increases because people tend to like pleasure more. Thus, with rise in income pole avoid riding
bicycles and rather buy cars or avail public transport. Bicycle is a normal good and there will be
no impact on its demand due to rise in income since demand for bicycle is income inelastic
(Fernandez 2018). Raid traffic is another reason that discourages people to ride bicycle.
⊘ This is a preview!⊘
Do you want full access?
Subscribe today to unlock all pages.
Trusted by 1+ million students worldwide
1 out of 15
Related Documents


Your All-in-One AI-Powered Toolkit for Academic Success.
+13062052269
info@desklib.com
Available 24*7 on WhatsApp / Email
![[object Object]](/_next/static/media/star-bottom.7253800d.svg)
Unlock your academic potential
Copyright © 2020–2026 A2Z Services. All Rights Reserved. Developed and managed by ZUCOL.